Where BofA Says European Equity Risk Is Most Concentrated
37 mins ago
The standard bubble narrative goes like this: prices detach from reality, multiples balloon, and eventually gravity wins. But in mid-2026, something unusual is happening. Forward price-to-earnings ratios across major markets have not ballooned. In several sectors, they have actually compressed, even as nominal prices have risen.
The dominant investor anxiety heading into mid-2026 has been valuation. Elevated indices, persistent geopolitical pressure, and historically high interest rates have kept bubble comparisons circulating widely. But this framing may be asking the wrong question entirely. The more precise question, as Damien Klassen of Nucleus Wealth framed it in a June 2026 analysis published via Firstlinks and Morningstar, is not whether markets are overpriced but whether the corporate earnings underpinning those prices have themselves become detached from reality.
Here is what the data actually tells you about that distinction: what the earnings numbers show, how the AI-driven capex cycle is spreading profit growth well beyond technology, why the current environment does not fit the standard speculative pattern, and where the genuine risk is located. Getting the difference between a price bubble and an earnings cycle right shapes every portfolio decision made in conditions like these.
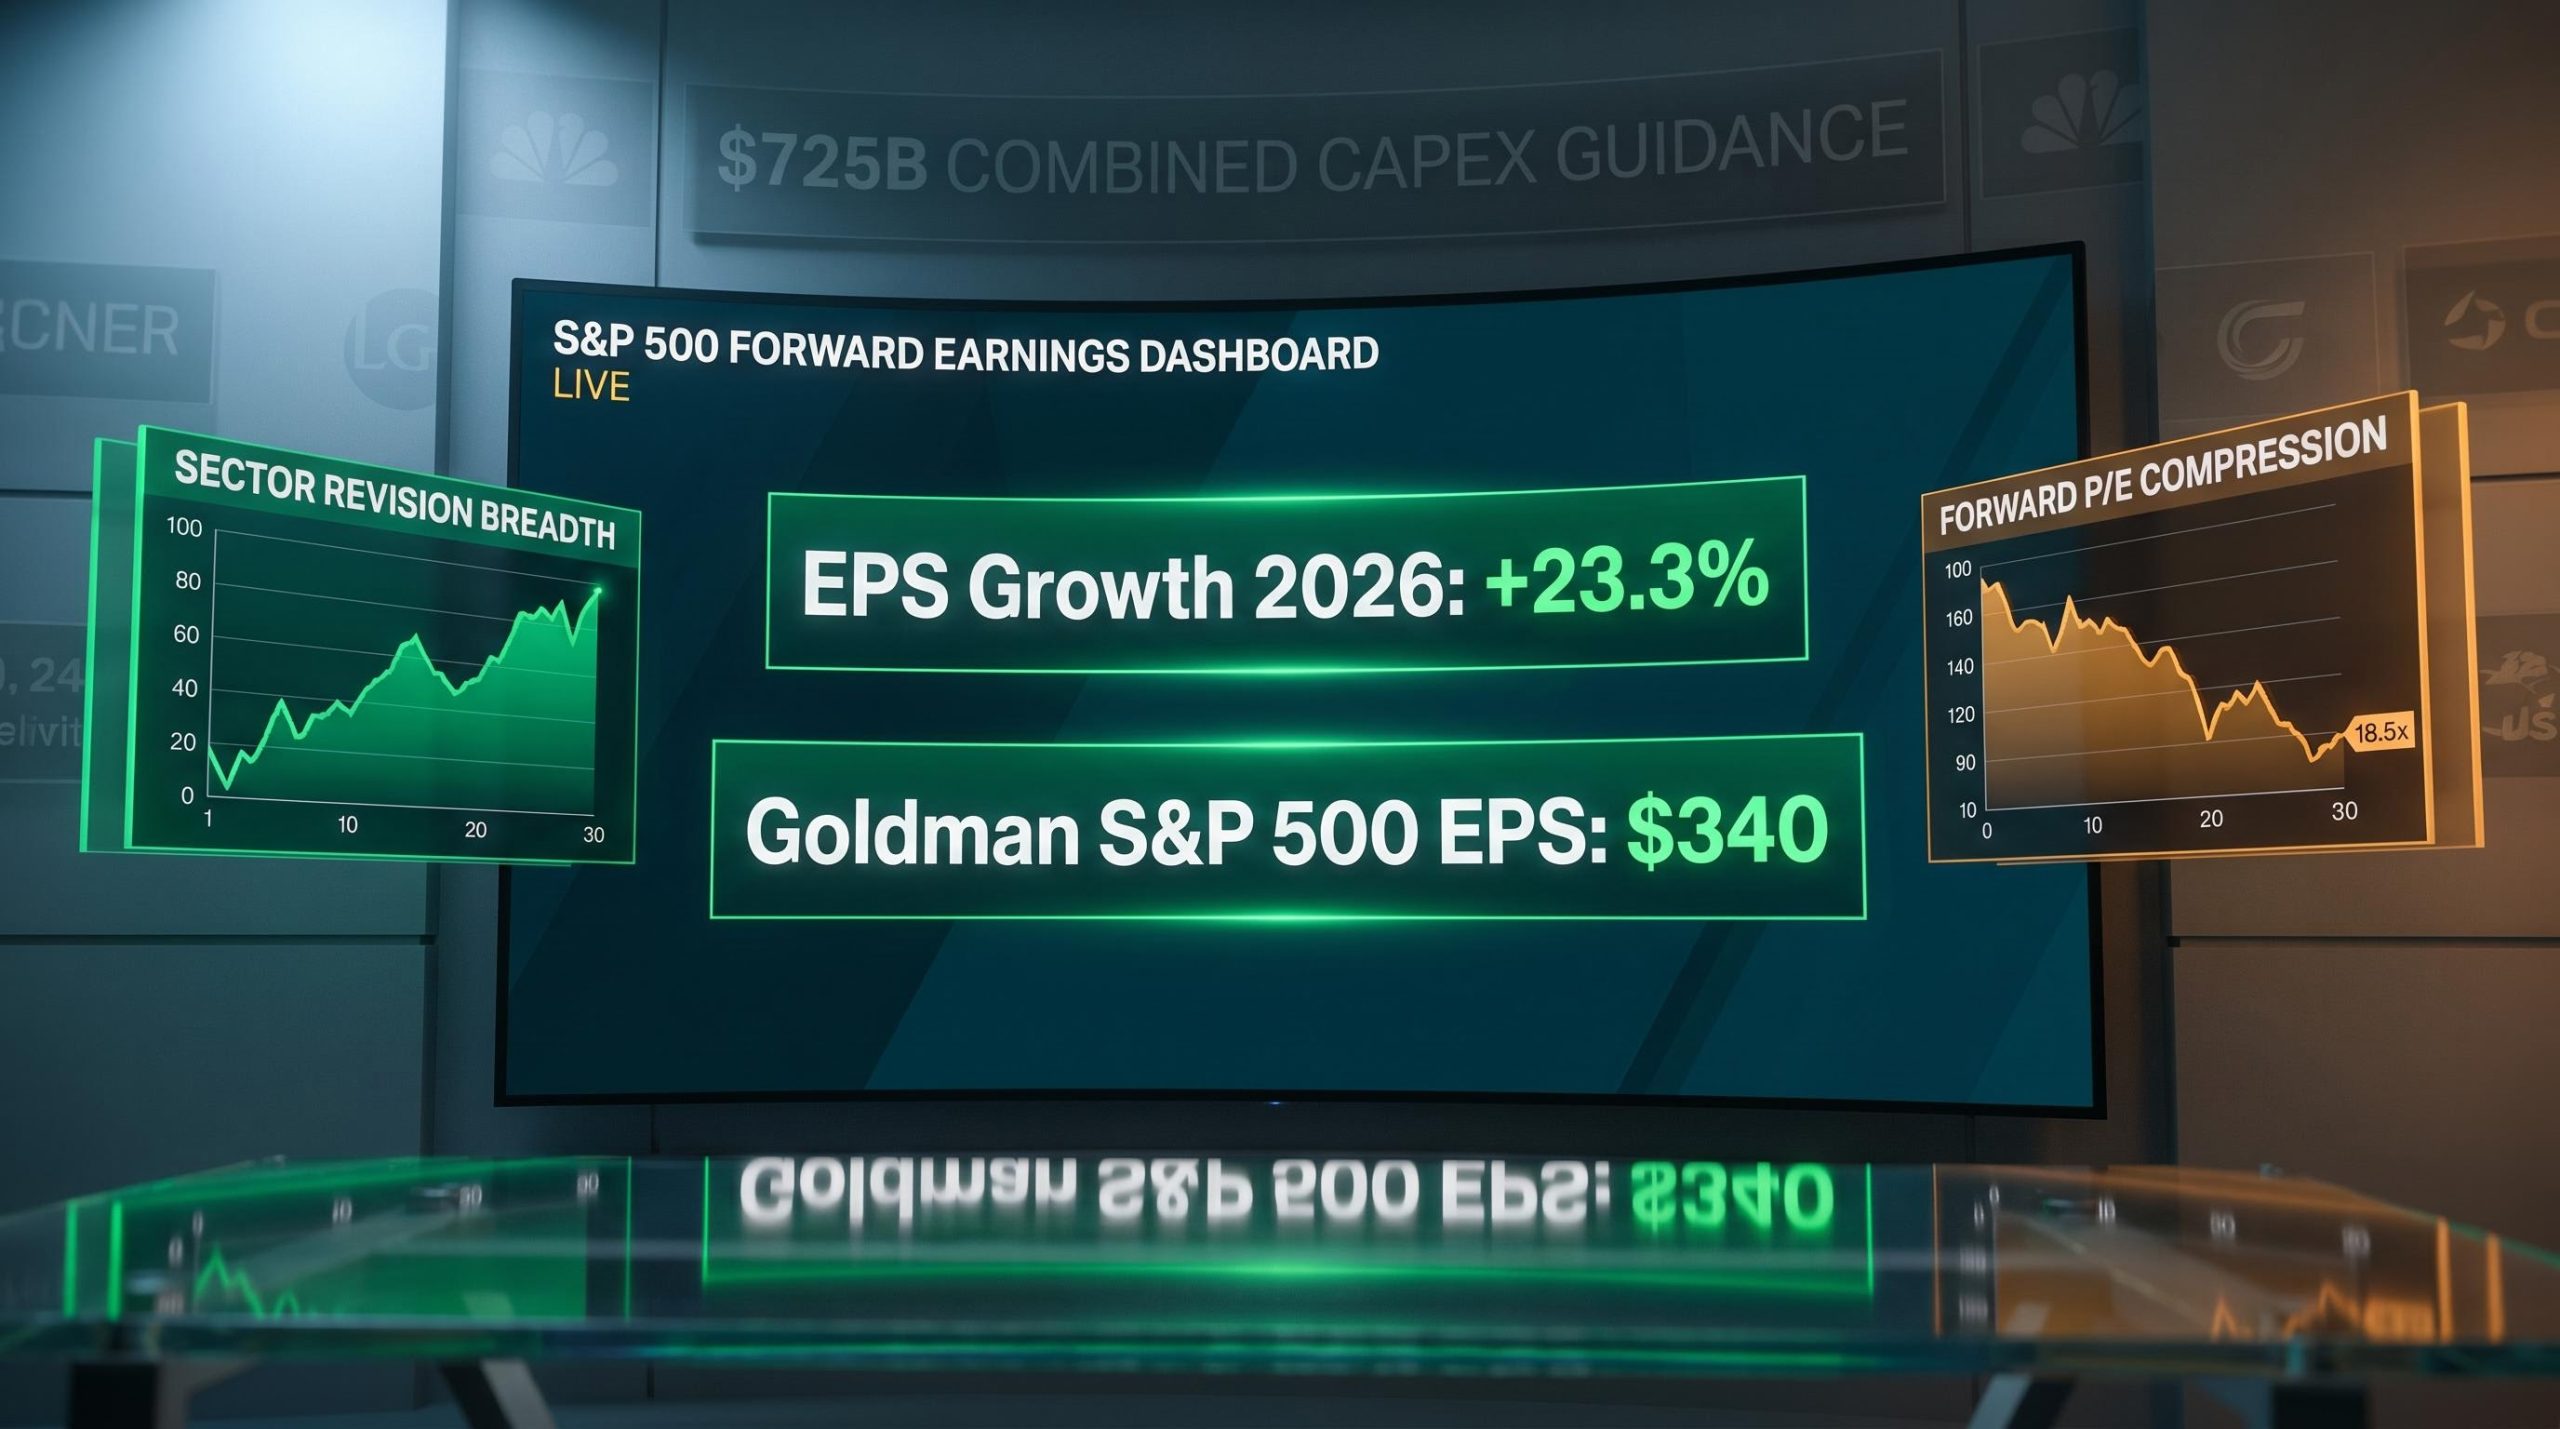
In sector after sector, forward price-to-earnings ratios have actually pulled back in 2026. Even as nominal prices have climbed, stocks have become relatively cheaper when measured against their earnings. That is the opposite of how speculative excess typically presents itself.
The mechanics are straightforward. When earnings rise faster than prices, multiples fall, regardless of how expensive things feel in nominal terms. And the earnings numbers are not modest.
| Source | 2026 EPS Estimate | Annual Growth Rate |
|---|---|---|
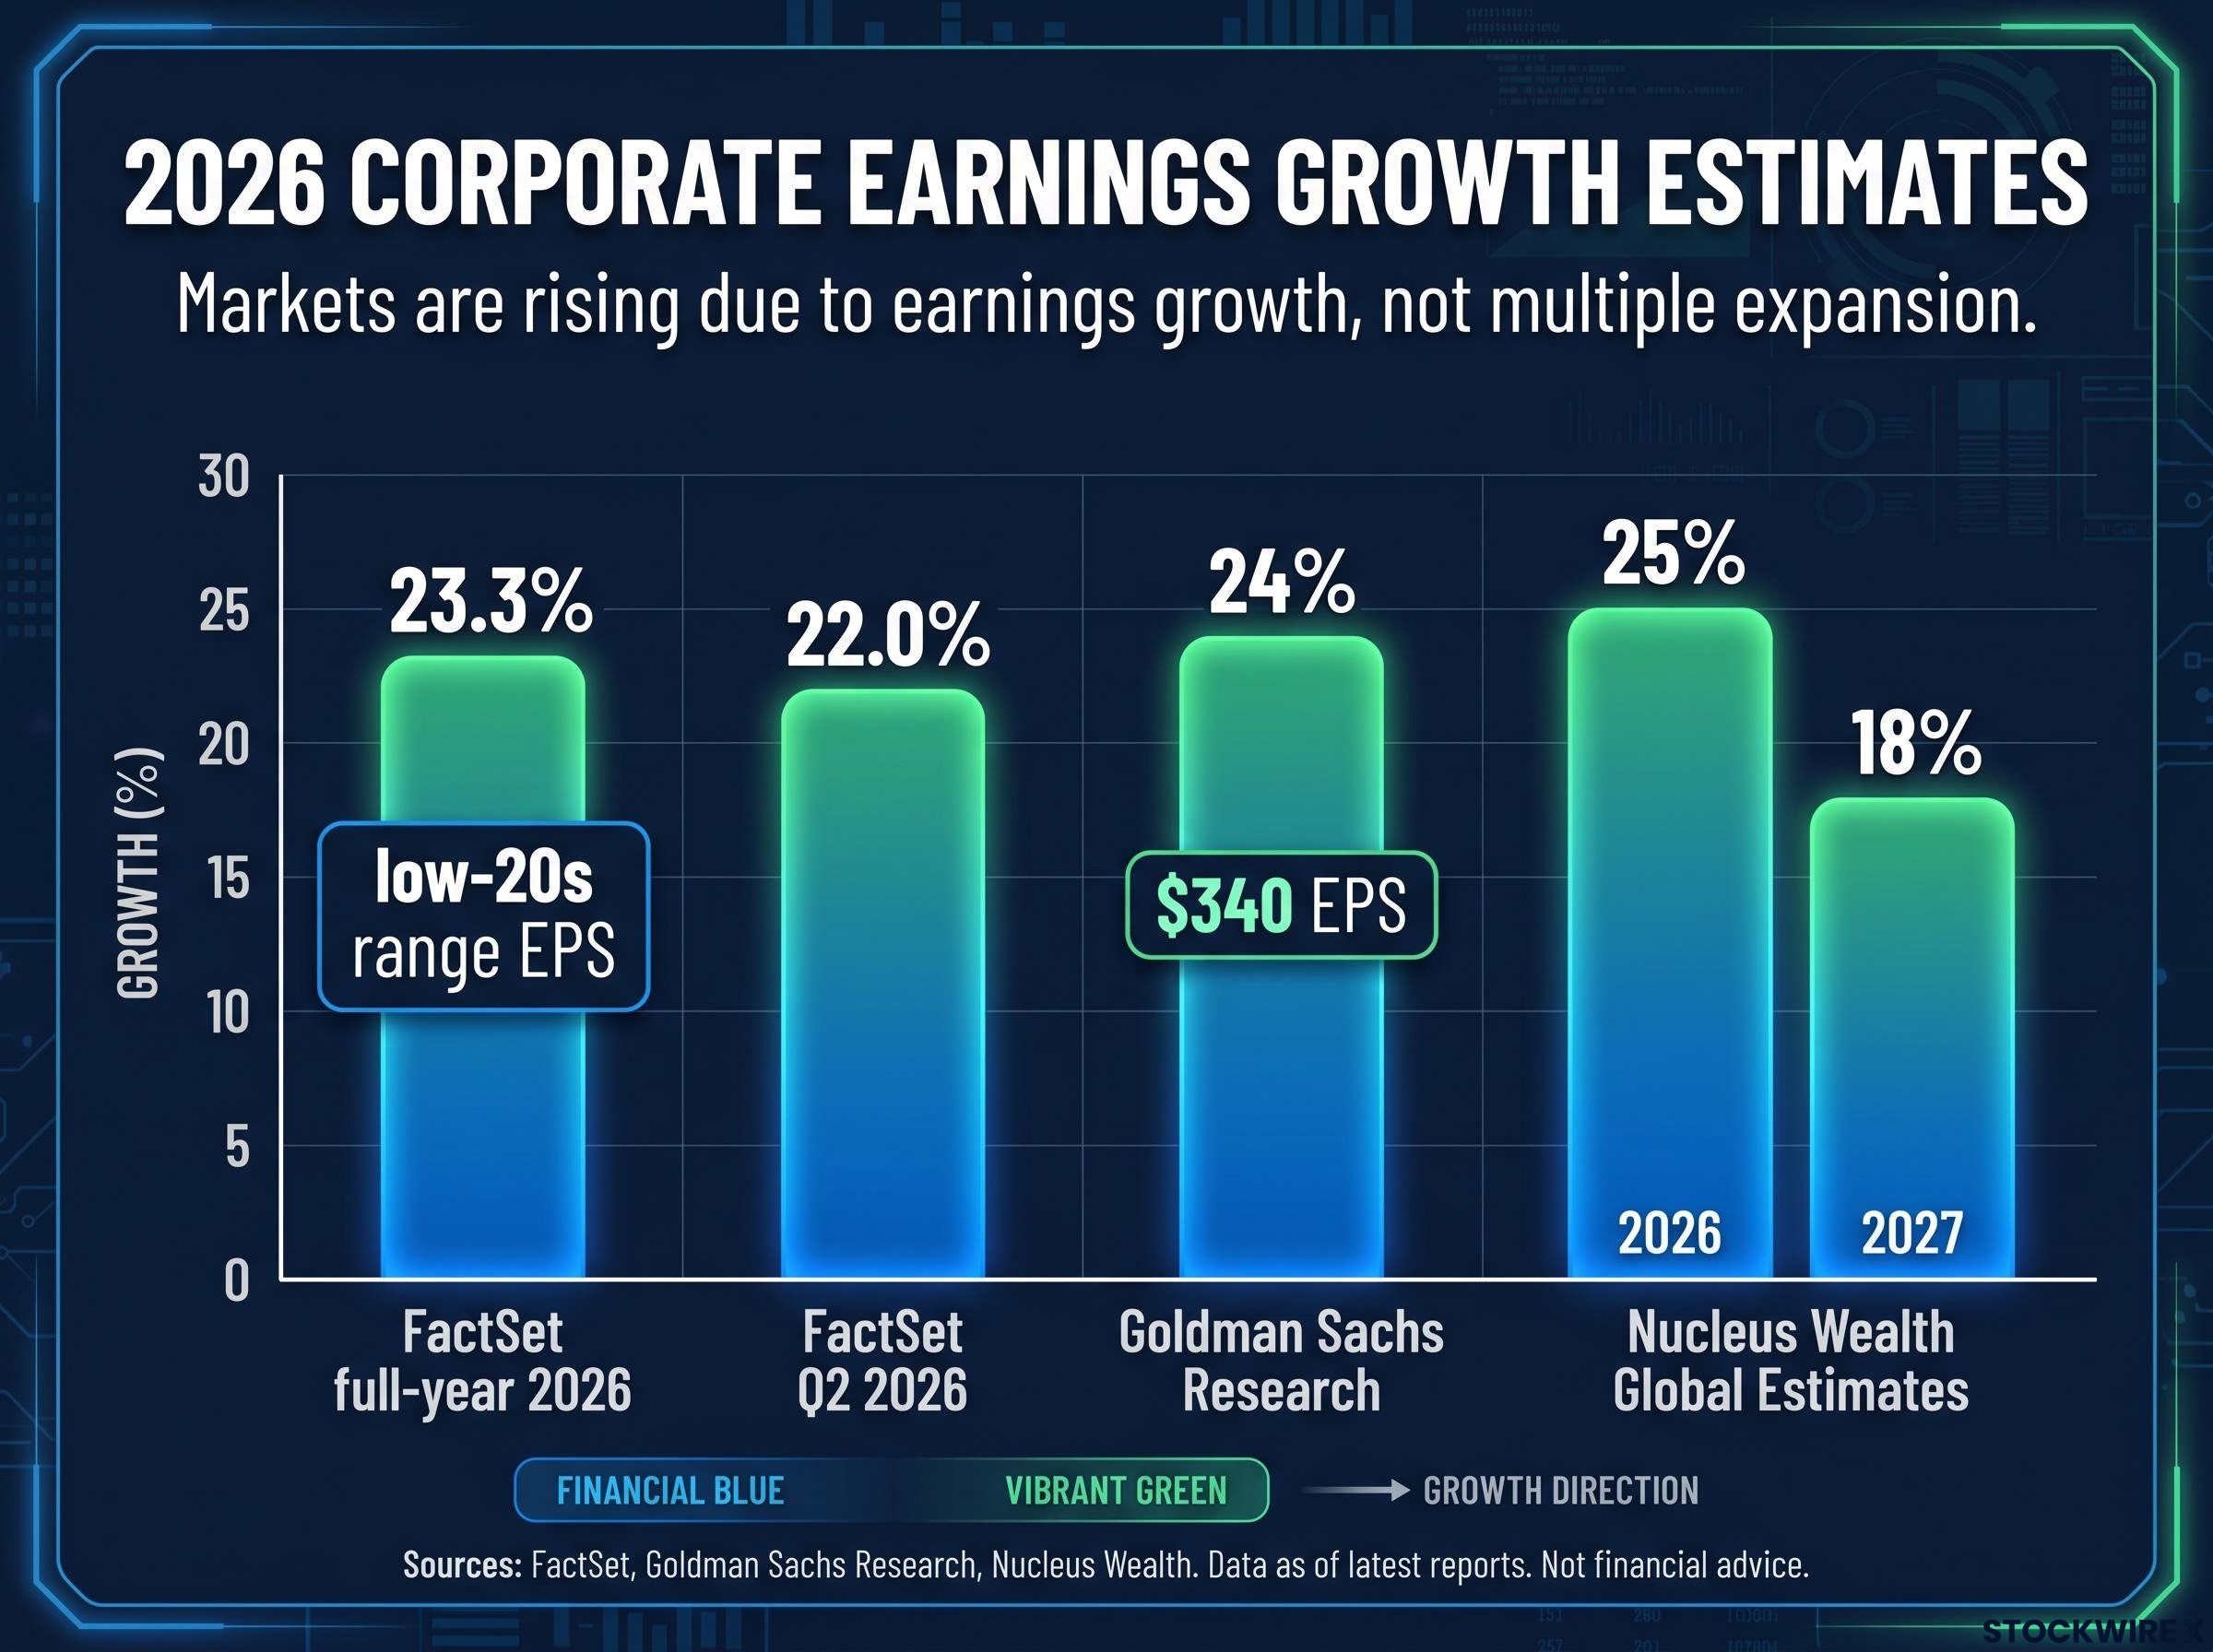
| FactSet (full-year 2026) | Low-20s range | 23.3% |
| FactSet (Q2 2026) | Q2 specific | 22.0% |
| Goldman Sachs Research | $340 | 24% |
Klassen’s analysis puts global forward earnings growth at roughly 25% for 2026 and approaching 18% for 2027. Numbers of that magnitude are not consistent with a market being carried purely by optimism.
A speculative bubble would not typically produce declining forward earnings multiples alongside rising prices. The current environment is distinct from that pattern.
Valuations are not cheap. But the multiple compression data tells you that stocks have become relatively cheaper in earnings terms even as they feel more expensive in price terms. That distinction is directly material to how stretched current valuations actually are.
The forward P/E vs CAPE divergence in 2026 is quantifiably large: the S&P 500’s forward P/E expanded by roughly 4 points since end-2022 while the Shiller CAPE expanded by approximately 13 points over the same period, a gap that reflects the market’s embedded bet on AI-driven earnings delivery rather than any disagreement about methodology.
The scale of upward earnings revisions in 2026 has been unusual by any historical measure. Full-year S&P 500 estimates have been revised up from the mid-teens to the low-20s range over the course of the year, and the upgrades are not confined to a handful of mega-cap names.
According to Klassen’s analysis at Nucleus Wealth, the sector-level detail is where the breadth becomes clear:
The Q1 2026 earnings beat produced a blended S&P 500 EPS growth rate of 27.1%, nearly double the 13.1% pre-season consensus estimate, with an 84% beat rate and an aggregate surprise almost three times the five-year norm, data that makes the full-year revision from mid-teens to low-20s growth look like a function of reported results rather than analyst optimism.
Klassen characterises the current rate of earnings acceleration as surpassing what materialised in the years following both the Global Financial Crisis (GFC) and the COVID-19 pandemic. That is a significant comparison, because both of those periods involved recoveries from severe earnings troughs.
The sector-level revision data tells you that this is not a concentrated tech earnings story extrapolated to the index level. Upgrade breadth of this magnitude has genuine implications for whether the profit cycle can extend further.
The channels through which AI is delivering margin gains are increasingly specific: lower labour intensity in routine tasks, faster product development cycles, dynamic pricing capabilities, and more efficient operations across back-office and logistics functions.
These gains are currently most visible among early adopters. But the analytical and pricing tools are spreading. Whether that diffusion sustains margins across the broader economy, or eventually compresses them as competitors adopt identical efficiencies, is one of the open questions that matters most for 2027 and beyond.
The AI productivity paradox sits at the core of the durability debate: economy-wide productivity growth remains near 0.1% annually even as AI-assisted tasks show efficiency gains of 40-55%, a disconnect that Bank of America, the OECD, BIS, McKinsey, and Goldman Sachs all document and that directly shapes whether current margin expansion represents a structural shift or a temporary efficiency harvest.
The AI infrastructure build-out has reached a scale where its spending alone is generating earnings growth across sectors that have no direct connection to artificial intelligence.
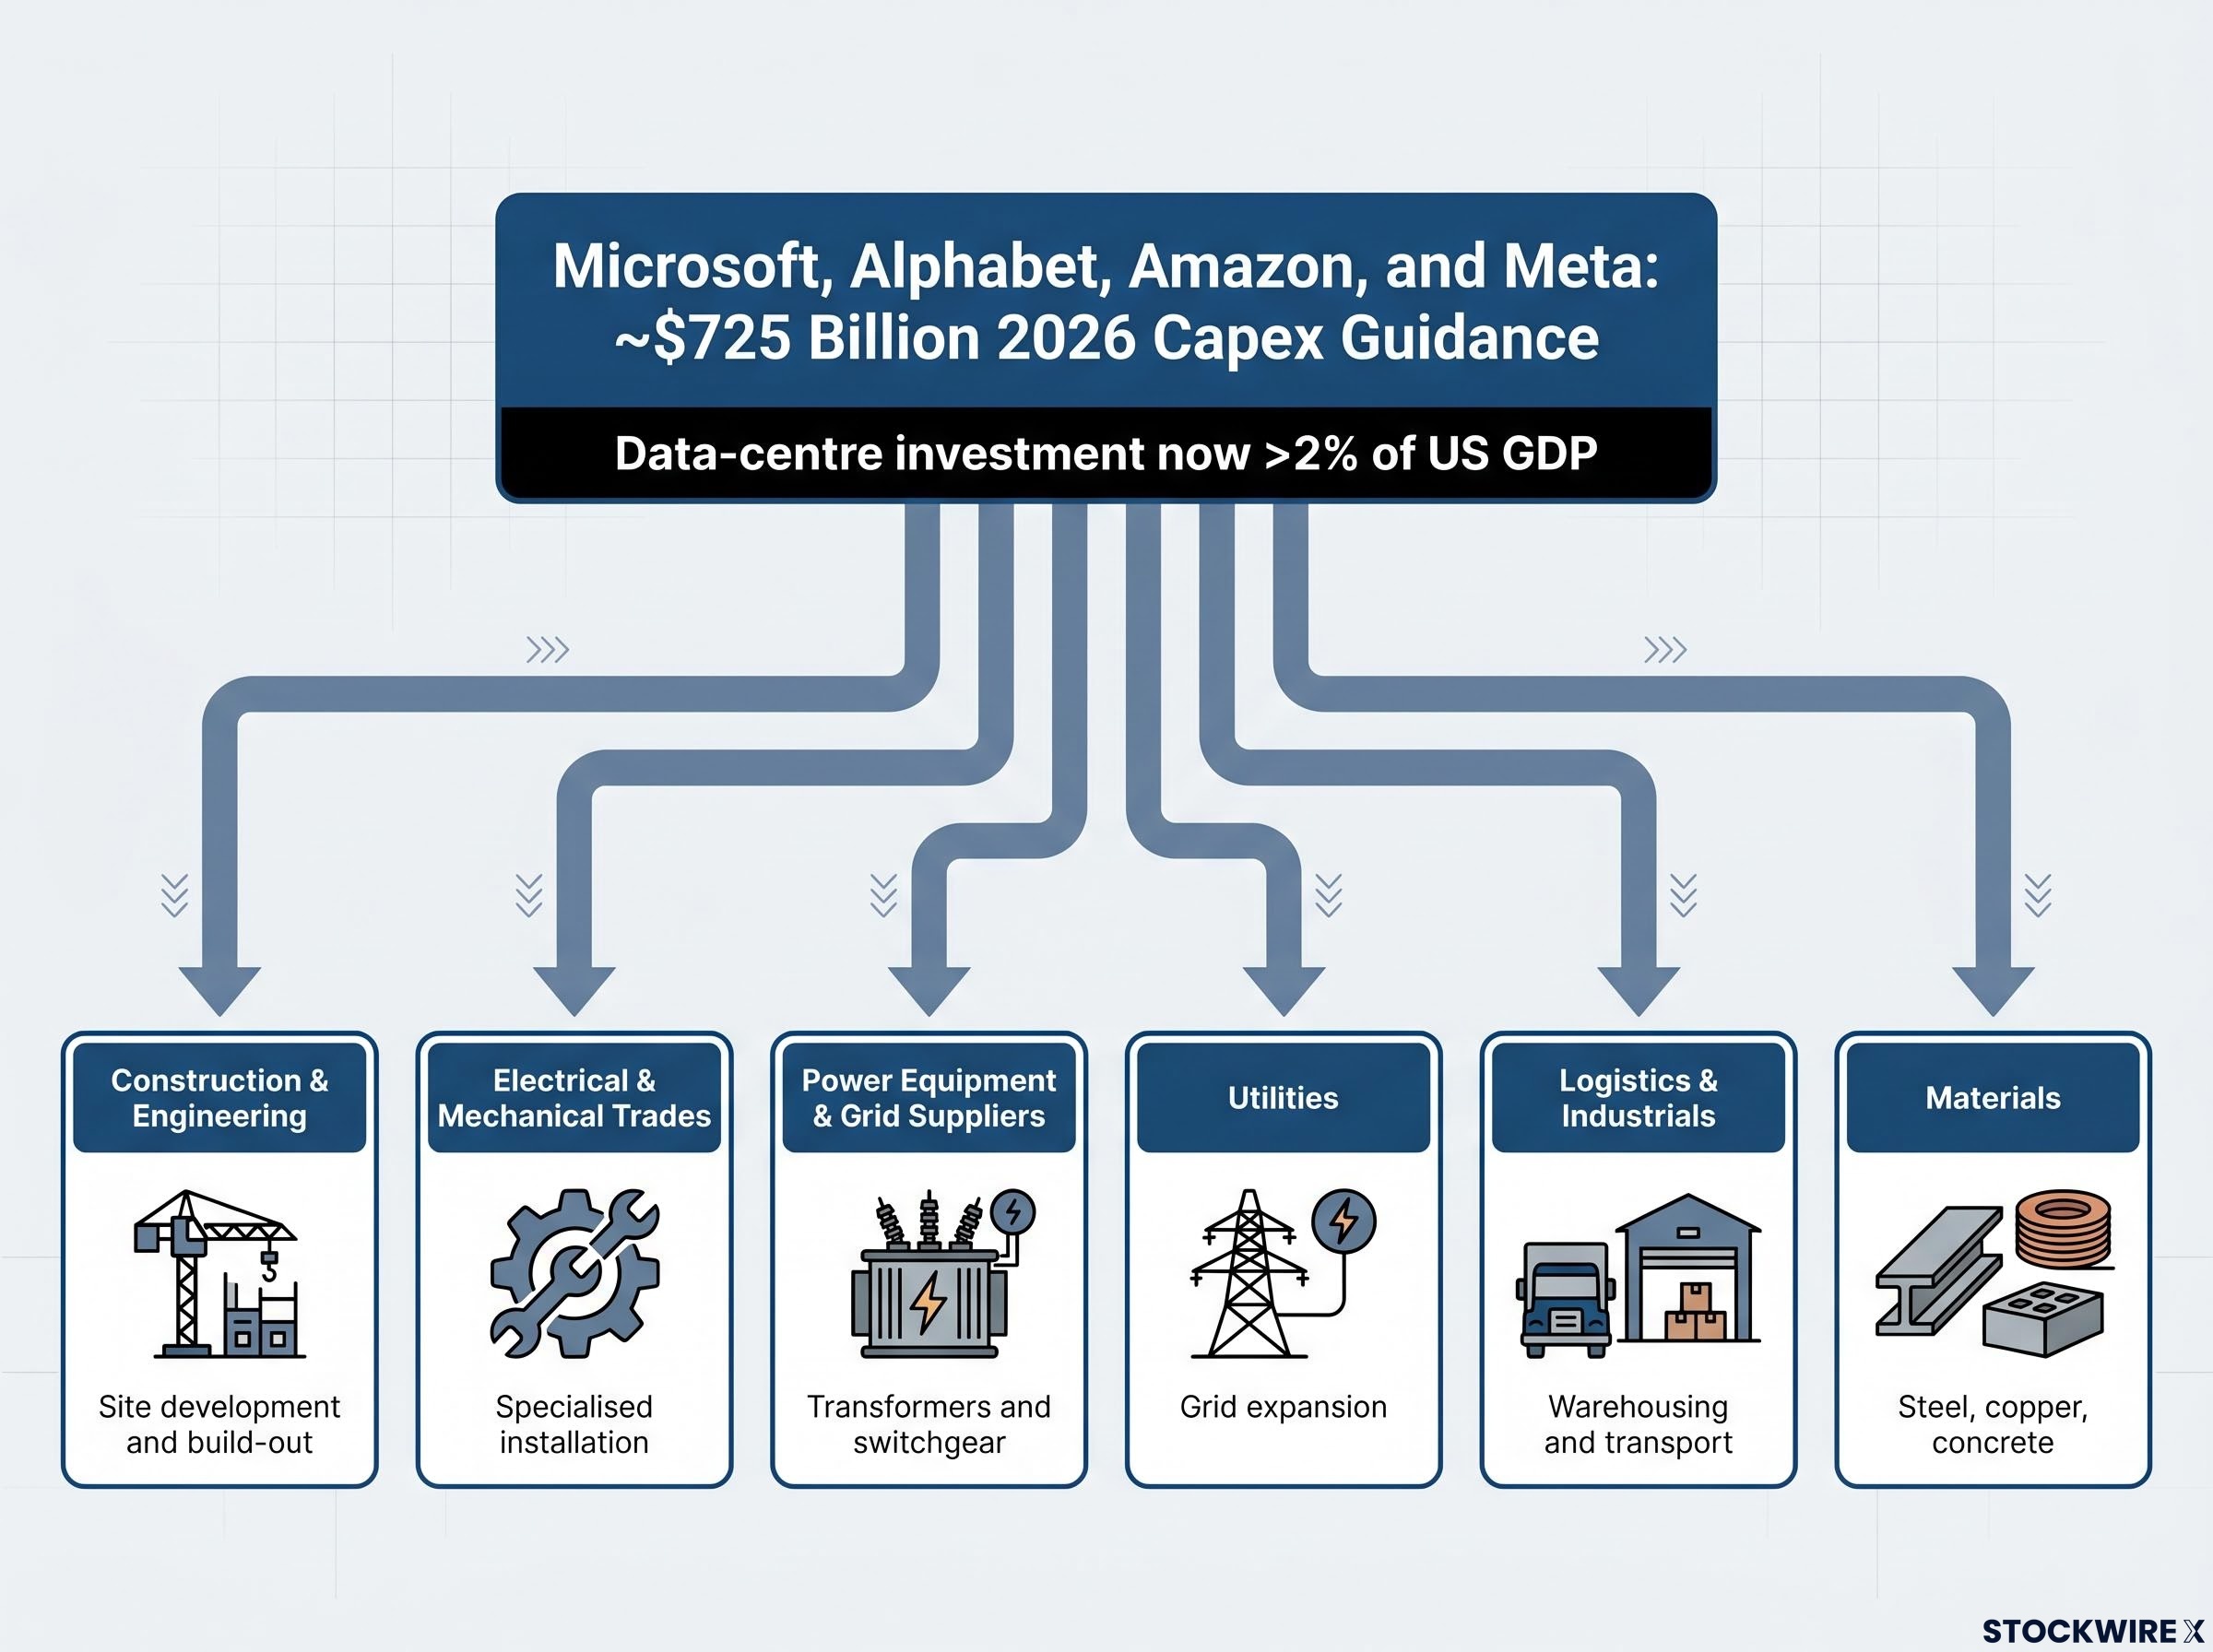
Microsoft, Alphabet, Amazon, and Meta have combined capital expenditure guidance of approximately $725 billion for 2026. According to Klassen’s analysis, data-centre investment by the technology sector now accounts for more than 2% of US GDP in fresh capital deployment.
Data-centre spending by major technology companies has grown to represent more than 2% of US GDP in new capital committed, a volume of investment large enough to generate meaningful earnings effects well outside the technology sector itself.
AI investment as a share of GDP has already surpassed every prior technology cycle peak, reaching 4.9% of US GDP in Q1 2026 and exceeding both the dot-com era high of approximately 4.2% and the cloud build-out peak of approximately 3.8%, providing historical context for why the current capex wave is generating earnings effects across sectors with no direct connection to artificial intelligence.
The structural shift in how these companies deploy capital matters. Large technology firms that had spent years channelling surplus profits into buybacks, debt reduction, and cash reserves have fundamentally changed direction. They are now actively raising capital and borrowing to fund infrastructure at scale, redirecting that money into the physical economy rather than back into financial markets.
That spending flows through a long chain of downstream beneficiaries:
| Sector | Mechanism of Benefit |
|---|---|
| Construction and engineering | Data-centre design, site development, and build-out contracts |
| Electrical and mechanical trades | Specialised installation and fit-out for high-density compute facilities |
| Power equipment and grid suppliers | Transformer, switchgear, and generation capacity to meet surging power demand |
| Utilities | Long-term power purchase agreements and grid expansion investment |
| Logistics and industrials | Equipment transport, warehousing, and supply-chain coordination |
| Materials | Steel, copper, concrete, and specialised components for facility construction |
The growth channel here runs through business-to-business activity rather than consumer demand. That separation matters because households are still dealing with the pressure of elevated prices and borrowing costs. The two situations are not contradictory: corporate profits can broaden across sectors even while consumer budgets remain tight, because the capex cycle is driving that earnings expansion directly, without relying on any improvement in household confidence or spending. Waiting for consumer sentiment to recover before expecting earnings breadth in industrials and materials would miss what is already happening.
If the earnings story is real, the next question is whether those earnings represent a new floor or a cyclical peak. The honest answer is that the evidence does not resolve cleanly in either direction.
AI productivity gains appear to be delivering real, measurable margin improvements across multiple industries, via lower labour intensity, faster development, better pricing, and more efficient operations. The diffusion of these tools across sectors is still in progress, which means the margin uplift may not yet be fully reflected in aggregate numbers.
Beyond the current data-centre super-cycle, the long-term trend in cloud, software, and automation spending remains upward. Even if the most intense phase of physical build-out slows, the digital investment layer supporting tech-enabled firms has a structural trajectory that extends well past 2026.
Capex waves are, by definition, finite. Once the most urgent build-out phase completes, spending growth can slow or flatten, and the multiplier effects in construction, materials, and industrials fade. The sectors most directly tied to the ramp-up phase will be most exposed.
Consensus forward estimates carry their own risk. Current projections of low-20s earnings growth for 2026, and still-solid growth for 2027 (approximately 18% per Klassen’s global estimates), reflect an optimistic baseline. Historically, forward earnings projections tend to be revised down when conditions deteriorate. If AI capex moderates faster than expected, or if margins prove less defensible than modelled, 2027-2028 numbers face meaningful downward revision risk.
Macro regime-shift candidates sit in the background. Elevated real interest rates, potential AI regulation, and taxation changes are not dominating the 2026 narrative, but they represent identifiable exposure points that could alter both capex plans and profit margins.
The durability question is the one that should actually unsettle you: prices can be rational relative to 2026 earnings and still carry meaningful risk if 2028-2029 earnings end up well below today’s extrapolations.
On the evidence available, the current environment fails the standard bubble diagnostic tests. Specifically:
That is reassuring on the valuation question. But it does not reduce the earnings sustainability risk. What genuinely warrants concern is not the current price level measured against current earnings. It is the question of whether the earnings level itself is built to last, or whether it reflects a temporary peak generated by conditions that will not repeat.
Distinguishing between a valuation risk and an earnings sustainability risk is what allows you to ask sharper, more actionable questions about your current allocations. The blunt “bubble or not” framing does not give you that precision.
This article is for informational purposes only and should not be considered financial advice. Investors should conduct their own research and consult with financial professionals before making investment decisions.
The analytical verdict is not a prediction. It is a monitoring framework, and each of the four variables below is trackable from publicly available guidance and analyst revision data:
The weight of evidence in 2026 points toward a market being repriced on the basis of genuine earnings expansion rather than speculative enthusiasm. What remains unresolved, and where the real exposure lies, is whether the earnings driving that repricing will hold at their current level or prove to have been inflated by a concentrated AI infrastructure cycle that eventually fades.
Each of these variables gives you the tools to track the thesis yourself rather than waiting for a definitive verdict from markets.
Financial projections referenced in this analysis are subject to market conditions and various risk factors. Past performance does not guarantee future results.
The evidence favours an earnings-driven repricing over a speculative bubble. But the open question of earnings durability means the risk has not disappeared. It has shifted form.
The relevant question is no longer whether markets are overvalued in the abstract. It is whether the earnings underpinning current prices are structural or cyclical. That is a question you can actually answer with data, which is more useful than a price-level verdict that depends entirely on which historical analogue you choose.
The quantitative frame supports the distinction: earnings acceleration in 2026 is exceeding both the post-GFC and post-COVID recoveries. Global forward earnings growth estimates (25% for 2026, 18% for 2027) indicate this is not a US-only phenomenon, adding structural plausibility but also widening the potential exposure if the cycle turns.
As the AI capex wave matures, the quality and breadth of earnings growth will tell you far more about the market’s actual risk level than any comparison to historical valuation multiples. The investors best positioned to spot the inflection point are the ones tracking earnings revisions, not the ones watching for a price-level signal that may come late in any correction.
The primary risk, if one exists, sits in the earnings level itself rather than in the price level. Specifically, the danger is in treating today’s profit run-rate as a permanent new baseline when it may yet prove to be a cyclical high.
—
A price bubble occurs when asset prices detach from fundamentals through multiple expansion; a corporate earnings bubble occurs when the earnings themselves are inflated and unsustainable. In 2026, the concern is less about stretched valuations and more about whether the profit levels driving current prices will hold once the AI capex cycle matures.
The evidence points to real earnings growth: forward P/E ratios have compressed in several sectors even as prices rose, S&P 500 EPS growth is tracking at roughly 23-24% for full-year 2026, and the Q1 2026 blended earnings growth rate came in at 27.1%, nearly double the pre-season consensus estimate of 13.1%.
Microsoft, Alphabet, Amazon, and Meta have combined 2026 capex guidance of approximately $725 billion, with data-centre investment alone exceeding 2% of US GDP. That spending flows directly into construction, electrical trades, power equipment, utilities, logistics, and materials, generating earnings breadth in sectors with no direct connection to artificial intelligence.
The primary risk is earnings durability rather than current valuation: if AI capex moderates faster than expected or margin gains prove harder to sustain as competitors adopt identical tools, consensus estimates projecting roughly 18% global earnings growth in 2027 face meaningful downward revision, which would expose the current price level to a sharper correction.
The four most informative signals are: the direction of combined Big Tech capex guidance, whether AI-driven margin gains hold as competitive adoption spreads, whether industrial and materials earnings persist if build-out activity slows, and the direction of analyst revisions to 2027-2028 EPS estimates, which are the clearest leading indicator of whether current profit levels are structural or transitory.