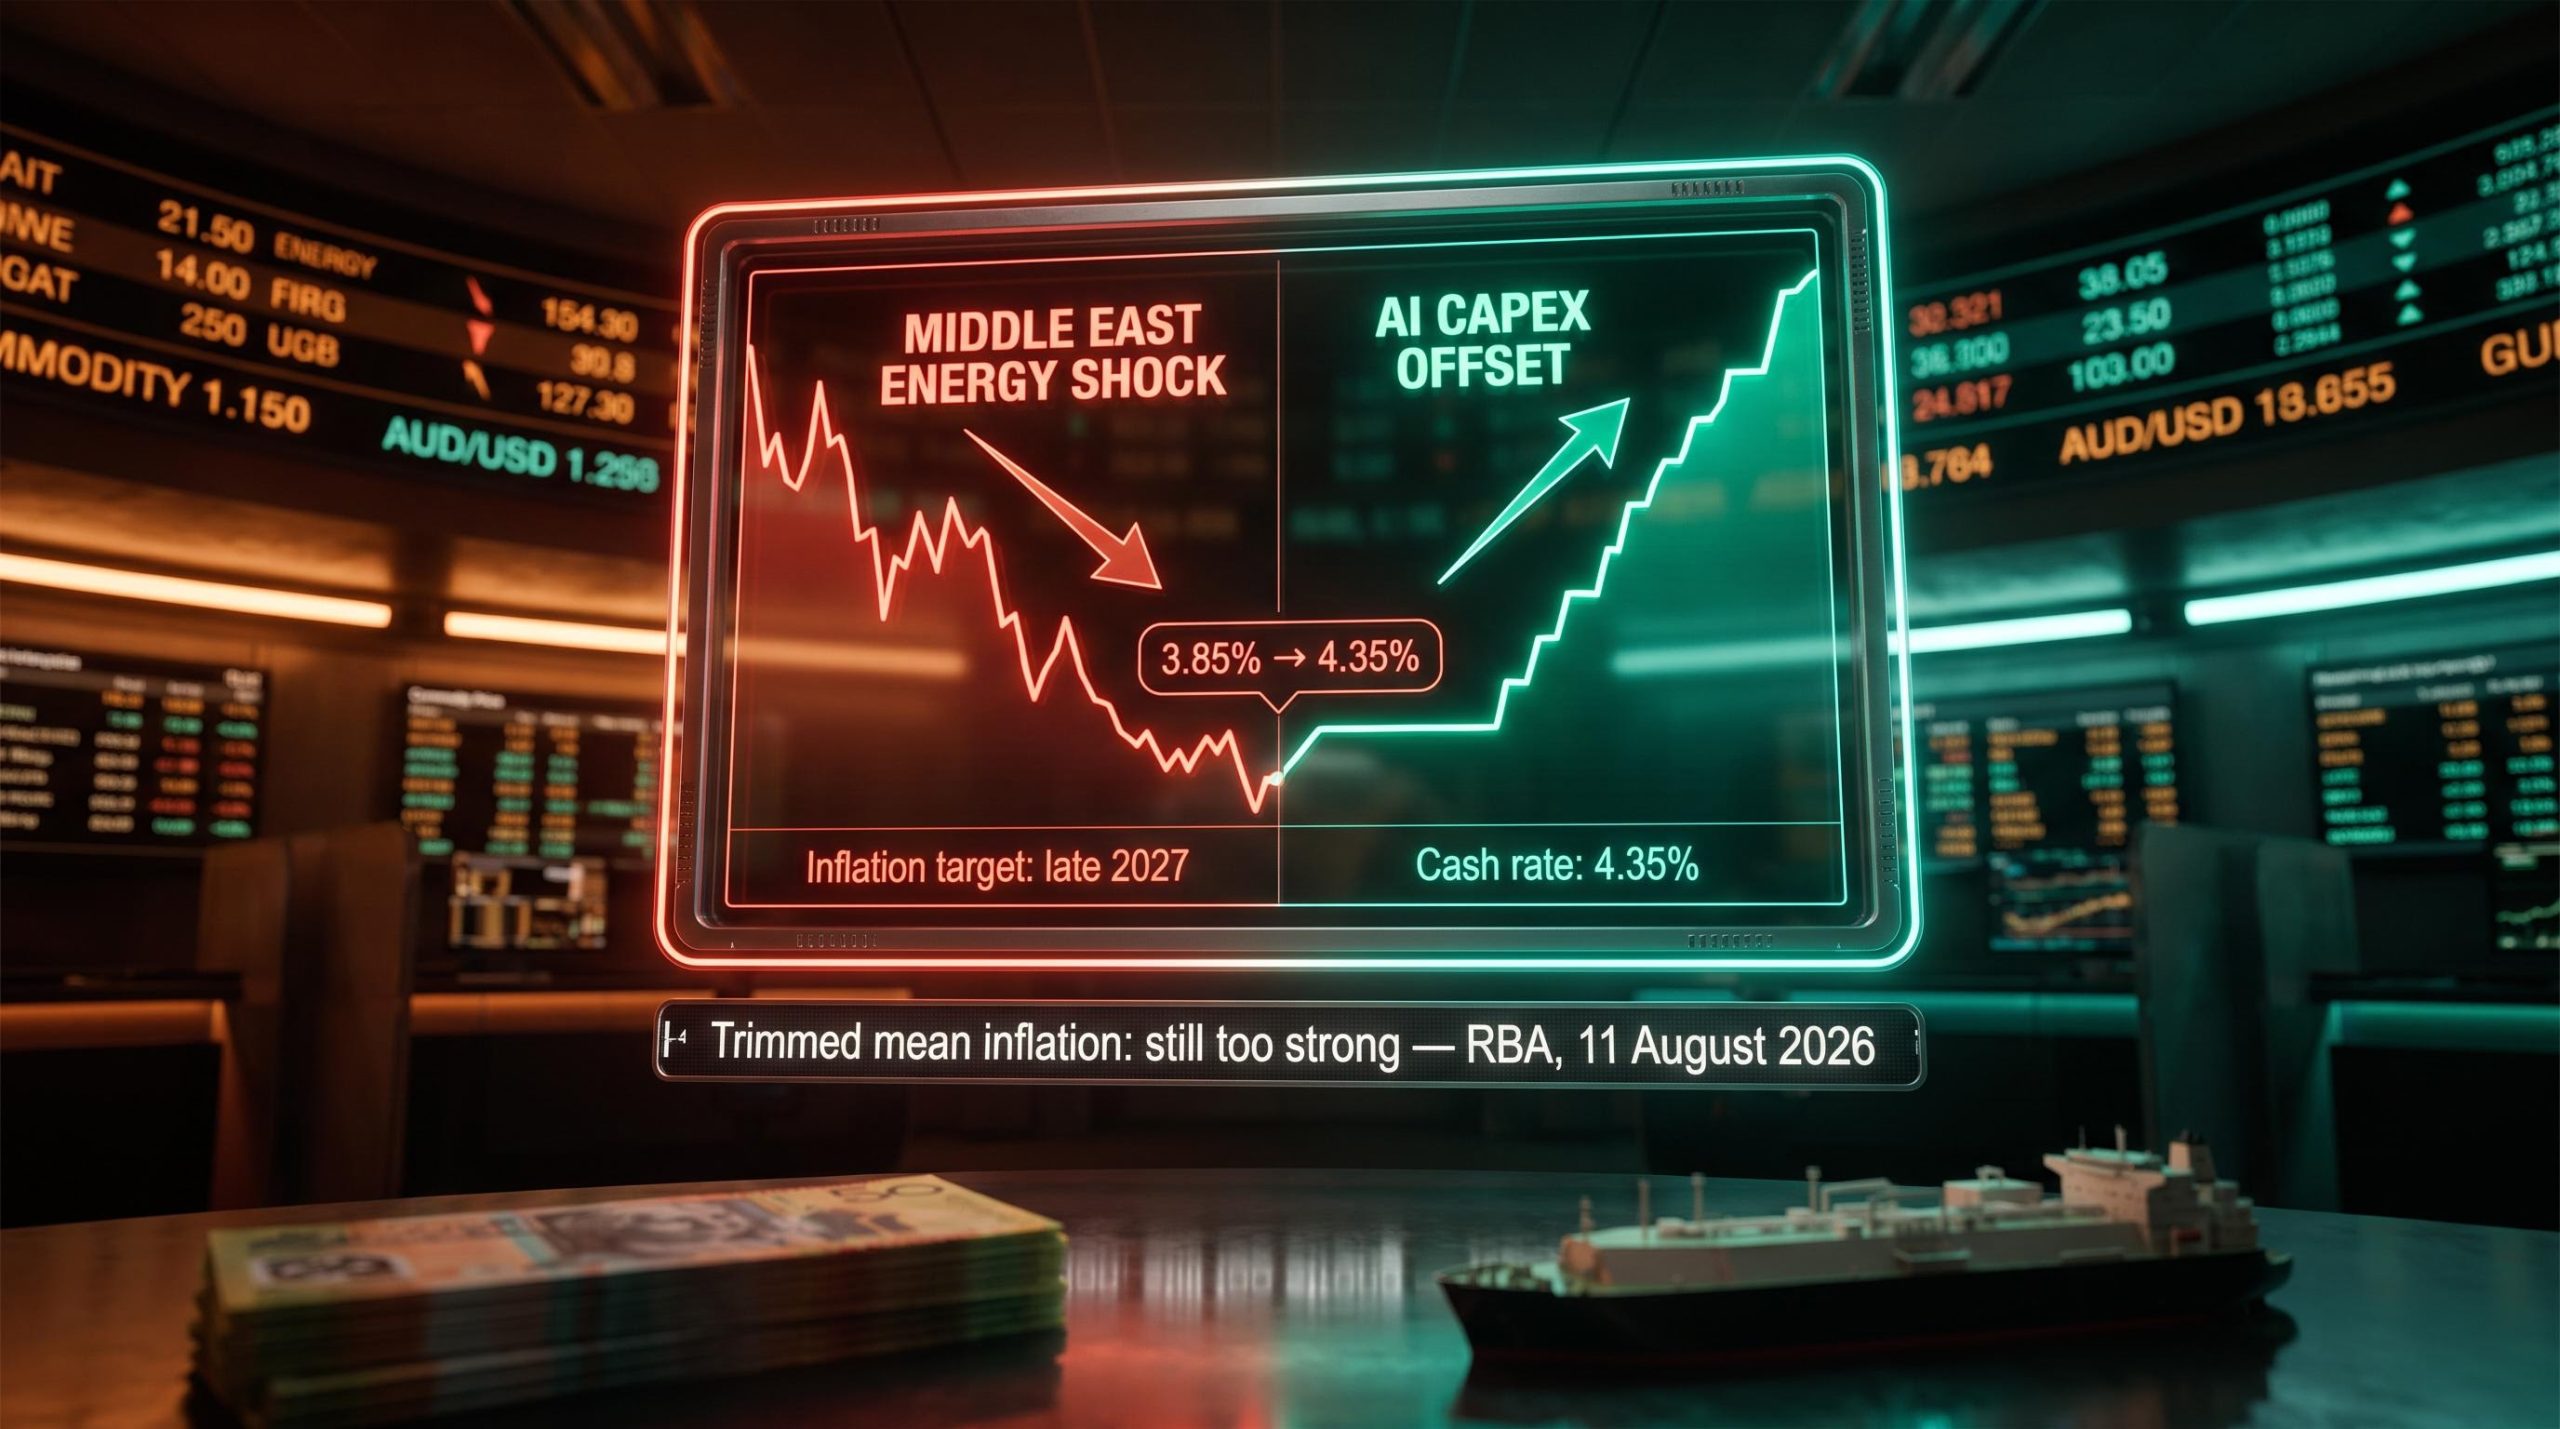
Two global forces are simultaneously pulling the Australian economic outlook in opposite directions, and the tension between them is exactly why the Reserve Bank of Australia’s (RBA) next move is harder to call than most commentary suggests.
On one side, the Middle East conflict is driving energy price shocks that compound domestic inflation pressures and push the RBA’s own projected return to the 2-3% target band out to late 2027. On the other, the surge in AI-driven capital expenditure across Australia’s major trading partners has generated sufficient external demand to counterbalance, by the RBA’s own reckoning, the growth headwinds created by that same energy shock. These forces are not coordinated, not symmetric, and not moving in the same direction for the same sectors.
Here is a clear macro framework for reading the current rate environment, assessing the risk profile for both inflation and growth, and identifying the four variables that will determine which force wins out over the next 12-18 months.
Why Australia’s inflation problem is not going away on its own
Start with the baseline. Trimmed mean inflation is still running hot, having barely shifted from where it stood in the March quarter, and the RBA’s own forecasts do not have it back at the target midpoint before late 2027. That timeline is the starting condition for everything that follows.
The RBA’s own language is precise about why.
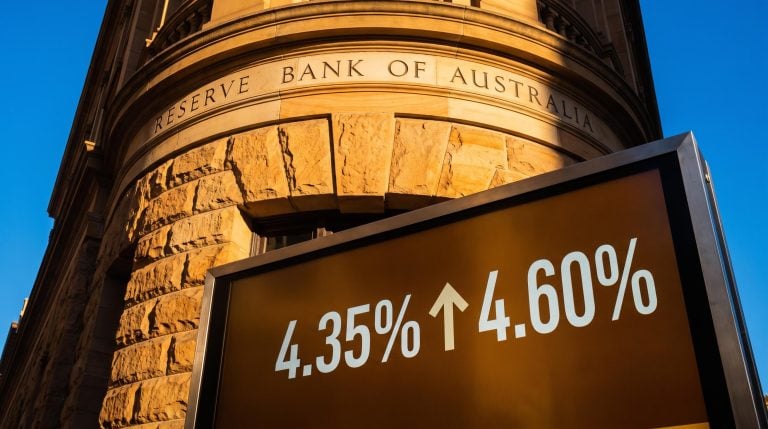
RBA Media Release No. 2026-19 confirms the Board held the cash rate at 4.35% while explicitly noting that inflation is not expected to return to the midpoint of the 2-3% target range until late 2027, underscoring that the current tightening cycle is far from a conventional single-hike sequence.
“The underlying pulse of inflation is too strong.” — RBA Media Release No. 2026-19, 11 August 2026
That phrasing matters. It distinguishes the current problem from a temporary spike in petrol or fresh food. The Board is saying that broad-based domestic price pressures, not just volatile components, are running too hot.
Three forces are compounding simultaneously:
- Domestic capacity pressures: demand for labour and services is still outpacing supply in key parts of the economy
- Global energy prices: the Middle East conflict has added an external inflation impulse on top of domestic pressures
- Second-round pass-through risk: businesses are absorbing higher input costs and passing them into final prices, creating the conditions for a wage-price feedback loop
Short-term inflation expectation measures have moderated somewhat but remain elevated relative to earlier in 2026. The late 2027 return-to-target projection tells you the RBA is not operating in a “one more hike and we’re done” environment. It is managing a sustained period of above-target inflation where any premature easing risks locking in the problem.
When big ASX news breaks, our subscribers know first
How Middle East conflict is transmitting into Australian prices
The connection between a disrupted oil supply in the Persian Gulf and a higher grocery bill in Melbourne runs through a two-step chain that the RBA is tracking closely.
- First-round effects: Higher petrol and utility prices feed directly into the Consumer Price Index (CPI), the broad measure of what households pay for goods and services. These are immediate and visible.
- Second-round effects: Higher energy and freight costs flow into business input costs, which firms then pass into final prices. If workers then push for higher wages to preserve real incomes, the one-off shock becomes embedded in the cost structure. This is the channel the RBA fears most.
Across energy and related commodity categories, prices had not returned to pre-conflict levels as of August 2026, according to the RBA’s March 2026 Financial Stability Review. The RBA’s assessment is that restoring global oil supply will be a slow process, with continued upward pressure on energy costs expected to carry through well beyond the current period. Across the business sector, firms confronting elevated input costs had begun passing those costs on to customers, with others indicating they intended to follow.
The energy price pass-through running through Australian construction and logistics chains is compounding what began as a petrol price shock into a broader cost structure problem, with new dwelling costs accelerating at more than triple February’s monthly rate as oil-derived materials and diesel-powered supply chains absorbed the global crude price surge.
The second-round pass-through risk, not the petrol price itself, is what determines whether this shock is temporary or permanently embedded in the cost structure of the Australian economy.
The stagflation risk: why this combination is uniquely difficult for the RBA
Higher energy costs and weaker real incomes operating simultaneously remove the central bank’s usual trade-off options. In a standard demand-driven inflation episode, the RBA can raise rates to cool spending and bring prices down. When inflation is being pushed up by supply shocks at the same time that real incomes and confidence are being dragged down, tightening addresses the inflation side but worsens the growth side.
BIS analysis of energy shock pass-through published in August 2026 found that structural conditions and initial inflation levels materially affect how quickly a supply-driven energy shock embeds into wages and services prices, with economies already running above-target inflation facing a substantially higher risk of persistent second-round effects.
The RBA’s own scenario analysis acknowledges how difficult this terrain is: the outcome of the Middle East conflict is still open-ended, and the Board has outlined plausible paths under which both inflation ends up higher and output ends up weaker than the central forecast. A prolonged period of geopolitical uncertainty compounds the growth downside beyond the direct income effect by weighing on household and business confidence.
What the AI investment boom is actually doing for Australia
The RBA’s February 2026 Statement on Monetary Policy identifies a specific mechanism that has kept Australia’s external environment from deteriorating as badly as the energy shock alone would suggest. According to the RBA’s own analysis, the expansion in AI-related capital spending across trading partner economies has been large enough to more than compensate for the growth damage those economies sustained from the Middle East conflict. That is a stronger statement than simply calling it a buffer.
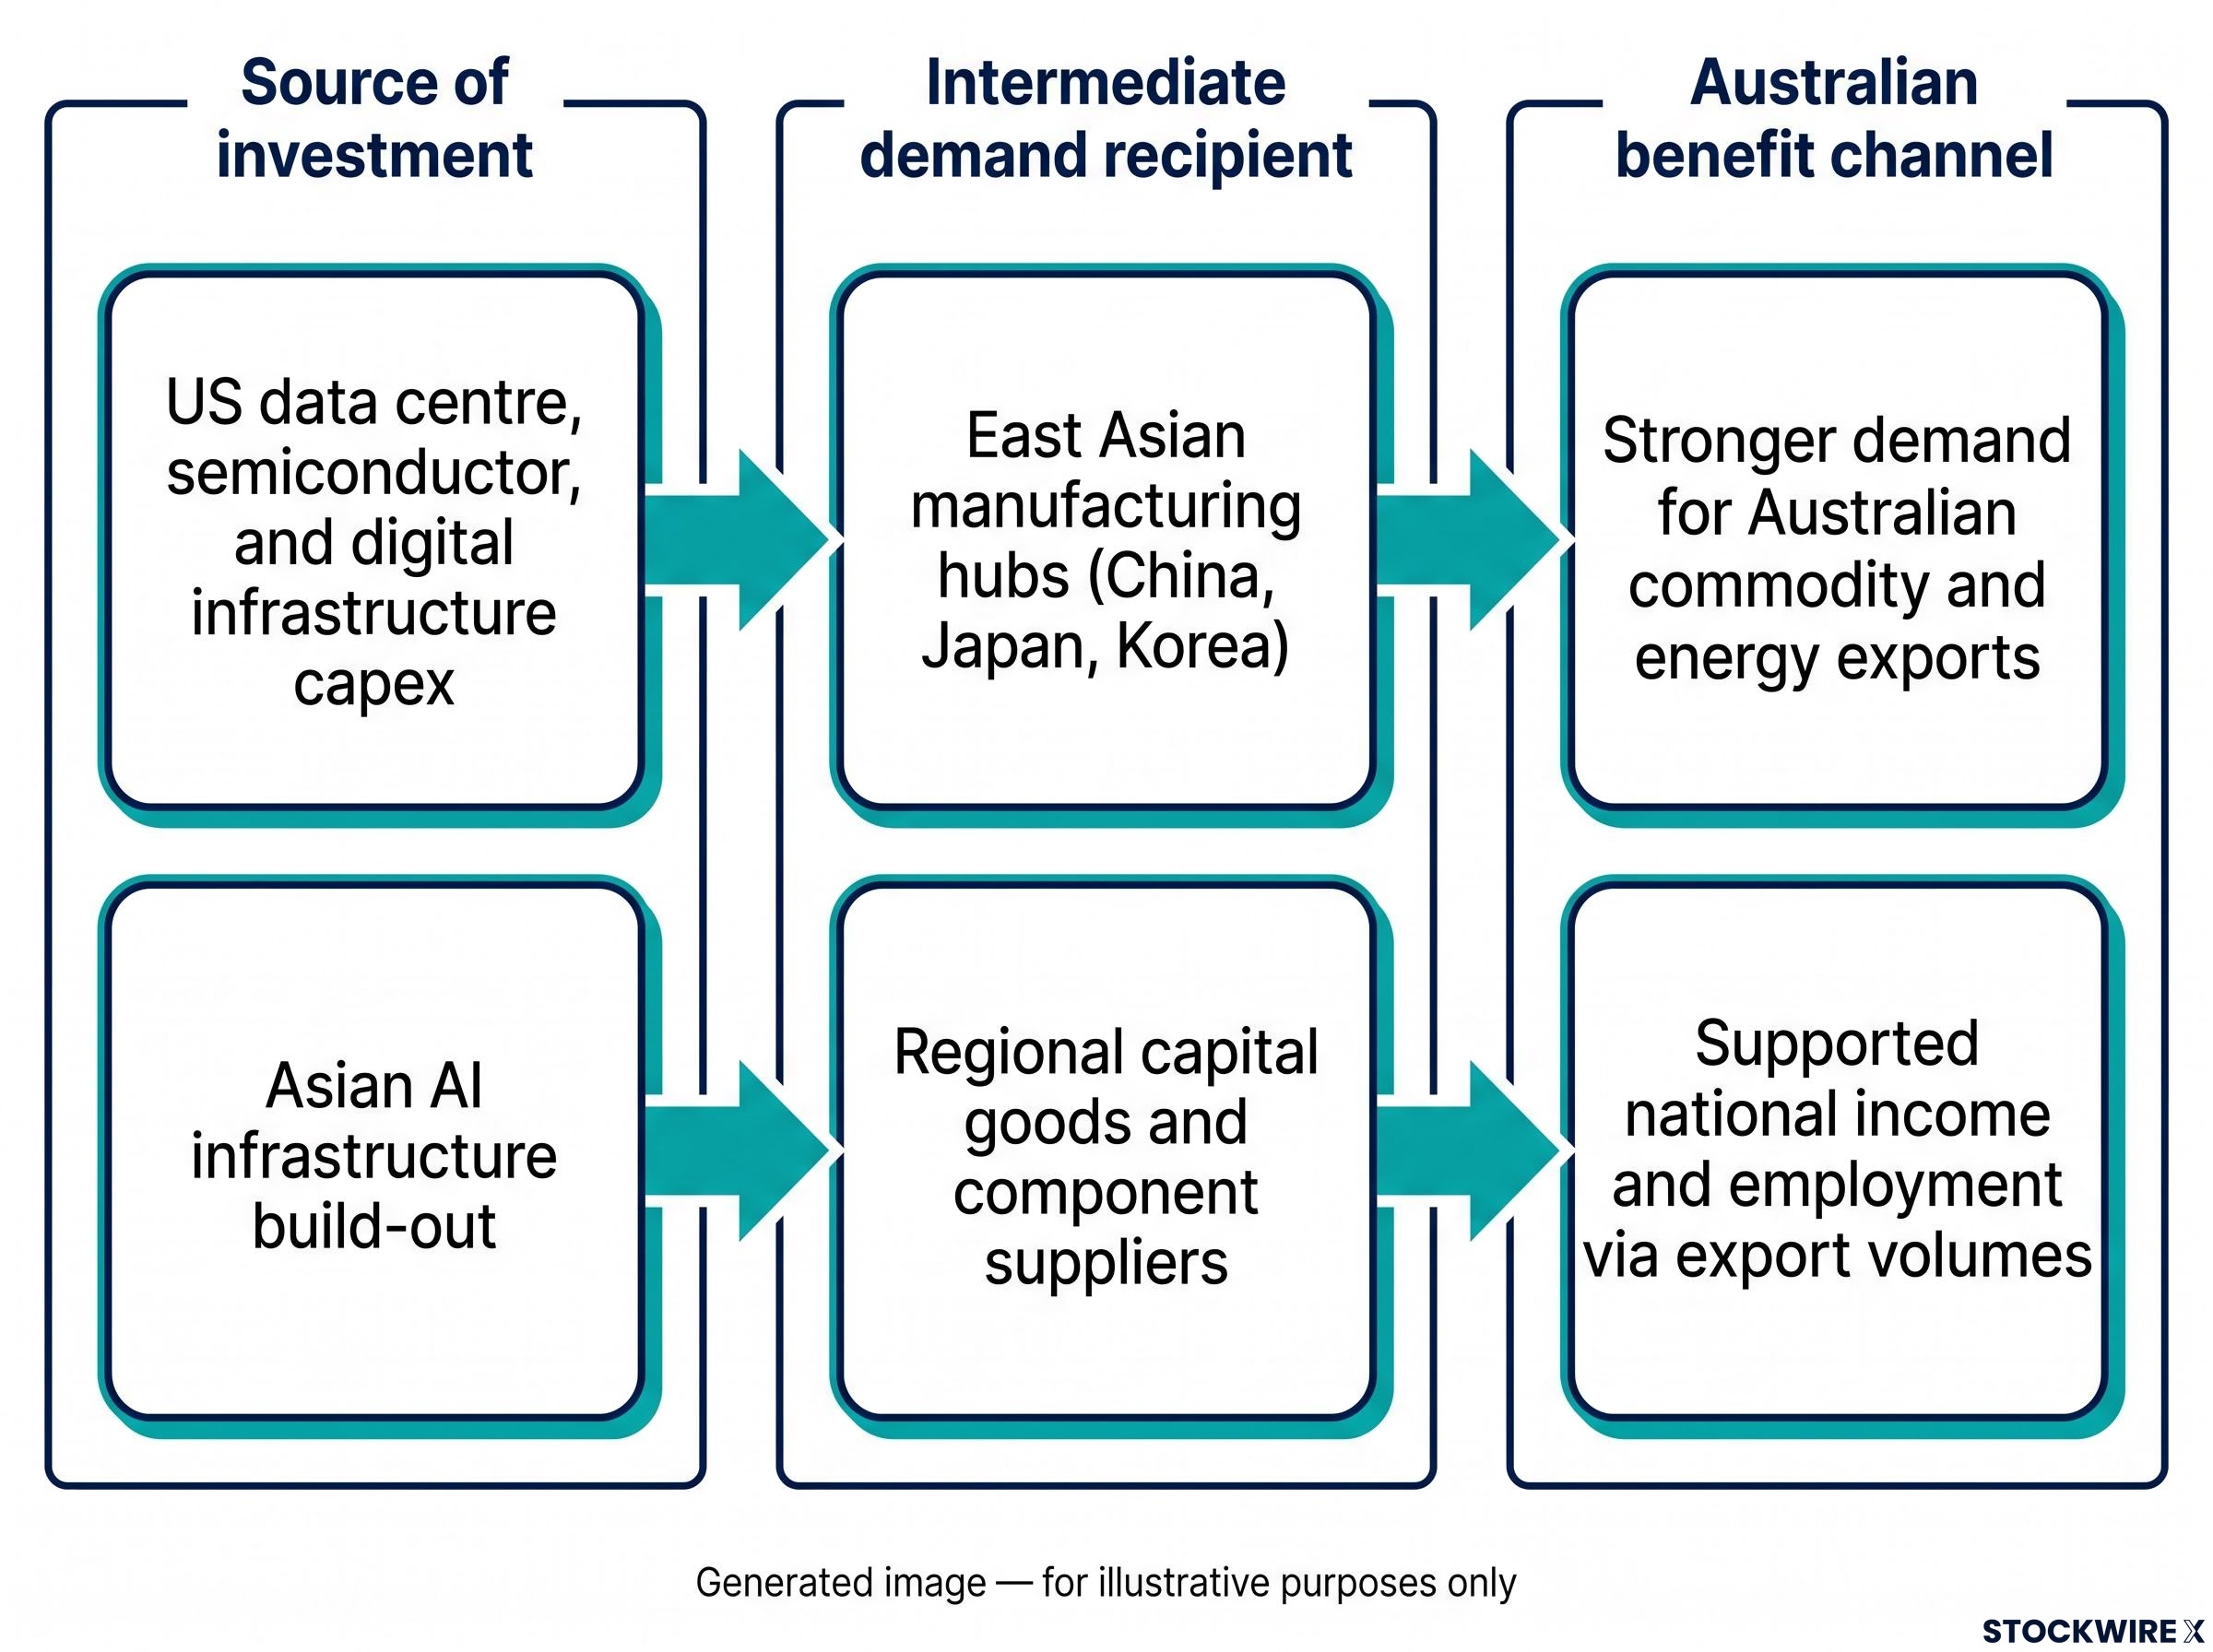
The transmission chain runs through three steps.
| Source of investment | Intermediate demand recipient | Australian benefit channel |
|---|---|---|
| US data centre, semiconductor, and digital infrastructure capex | East Asian manufacturing hubs (China, Japan, Korea) | Stronger demand for Australian commodity and energy exports |
| Asian AI infrastructure build-out | Regional capital goods and component suppliers | Supported national income and employment via export volumes |
The RBA noted that external support had helped the global economy “hold up better than we expected.”
In practice, large-scale data centre and semiconductor investment in the US and parts of Asia generates stronger demand for capital goods from East Asian manufacturing hubs. Those hubs are Australia’s key trading partners. Stronger growth in China, Japan, Korea, and East Asia more broadly supports demand for Australian exports, particularly commodities and energy, helping national income even while domestic conditions are softening.
Asian energy cost benchmarks diverged sharply from headline Brent crude in May 2026, with the Dubai crude benchmark reaching approximately $260 per barrel against Brent near $108, a spread that materially distorts any cost model or trade deficit projection built on Brent as a universal proxy for what Australia’s key trading partners are actually paying.
The fact that AI capex has more than offset the conflict drag on trading partner growth means Australia is currently benefiting from a cyclical shock absorber it did not generate and cannot control. That is both good news and a source of structural vulnerability.
Why AI-driven growth is a buffer, not a backstop
The AI capex story is genuinely supportive right now. The question is whether it stays that way.
Capex waves in new technologies can be volatile and may slow sharply if expected returns disappoint or tech valuations correct. Three conditions could cause a rapid deceleration:
- Returns disappoint: if AI infrastructure investment fails to generate the productivity gains or revenue growth that justified the spending, capital allocation shifts quickly
- Tech valuations correct: a broad repricing of technology equities could tighten financing conditions for AI-related capex programmes
- Infrastructure overbuild becomes apparent: if data centre and semiconductor capacity begins to exceed near-term demand, new investment commitments slow before the existing capacity is absorbed
The RBA’s own framing captures the stakes: an easing cycle would likely require either clear disinflation evidence or a sharp deterioration in activity, including a sudden stop in AI-related external demand.
What a sudden stop in AI capex would mean for Australian assets
The cascade would be specific. Weaker East Asian manufacturing demand would lower commodity prices and volumes. The Australian dollar, driven partly by the strength of Chinese and broader Asian demand, would depreciate through the demand channel. And the RBA would face a trade-off between above-target inflation and deteriorating activity that it is poorly positioned to resolve quickly.
This scenario is not the base case. But it is the key downside tail risk that consensus forecasts are currently underappreciating. A sudden deceleration in US or Asian AI capex spending would simultaneously remove the growth buffer for Australian exports, weaken the dollar, and hand the RBA a policy dilemma with no clean exit.
The asymmetric risk set the RBA is actually managing
The RBA’s choices are not between “easy” and “hard.” They are between two different types of costly error.
| Risk direction | Key drivers | RBA policy implication |
|---|---|---|
| Inflation risks (skewed upside) | Energy price pass-through, cost-wage spiral, still-elevated actual inflation | Hold or tighten further; premature easing risks entrenching above-target inflation |
| Growth risks (skewed downside) | High rates already restrictive, AI demand uncertainty, geopolitical confidence drag | Holding too long risks unnecessary output loss; but cost of this error is lower than letting inflation expectations drift |
When risks are shaped like this, central banks prioritise inflation-targeting credibility first. Allowing expectations to drift higher is costly and slow to reverse. That is consistent with the RBA holding at 4.35% in June 2026 with explicit guidance that further tightening remains possible.
The global central bank divergence visible in May 2026, when the RBA tightened while the Fed, ECB, and Bank of England all held, reflects the same asymmetric risk calculus the Board is still applying: Australian inflation dynamics have domestic supply-side characteristics that peer central banks are not managing at the same intensity.
The RBA stated it would act “if that is what is required to bring inflation down.”
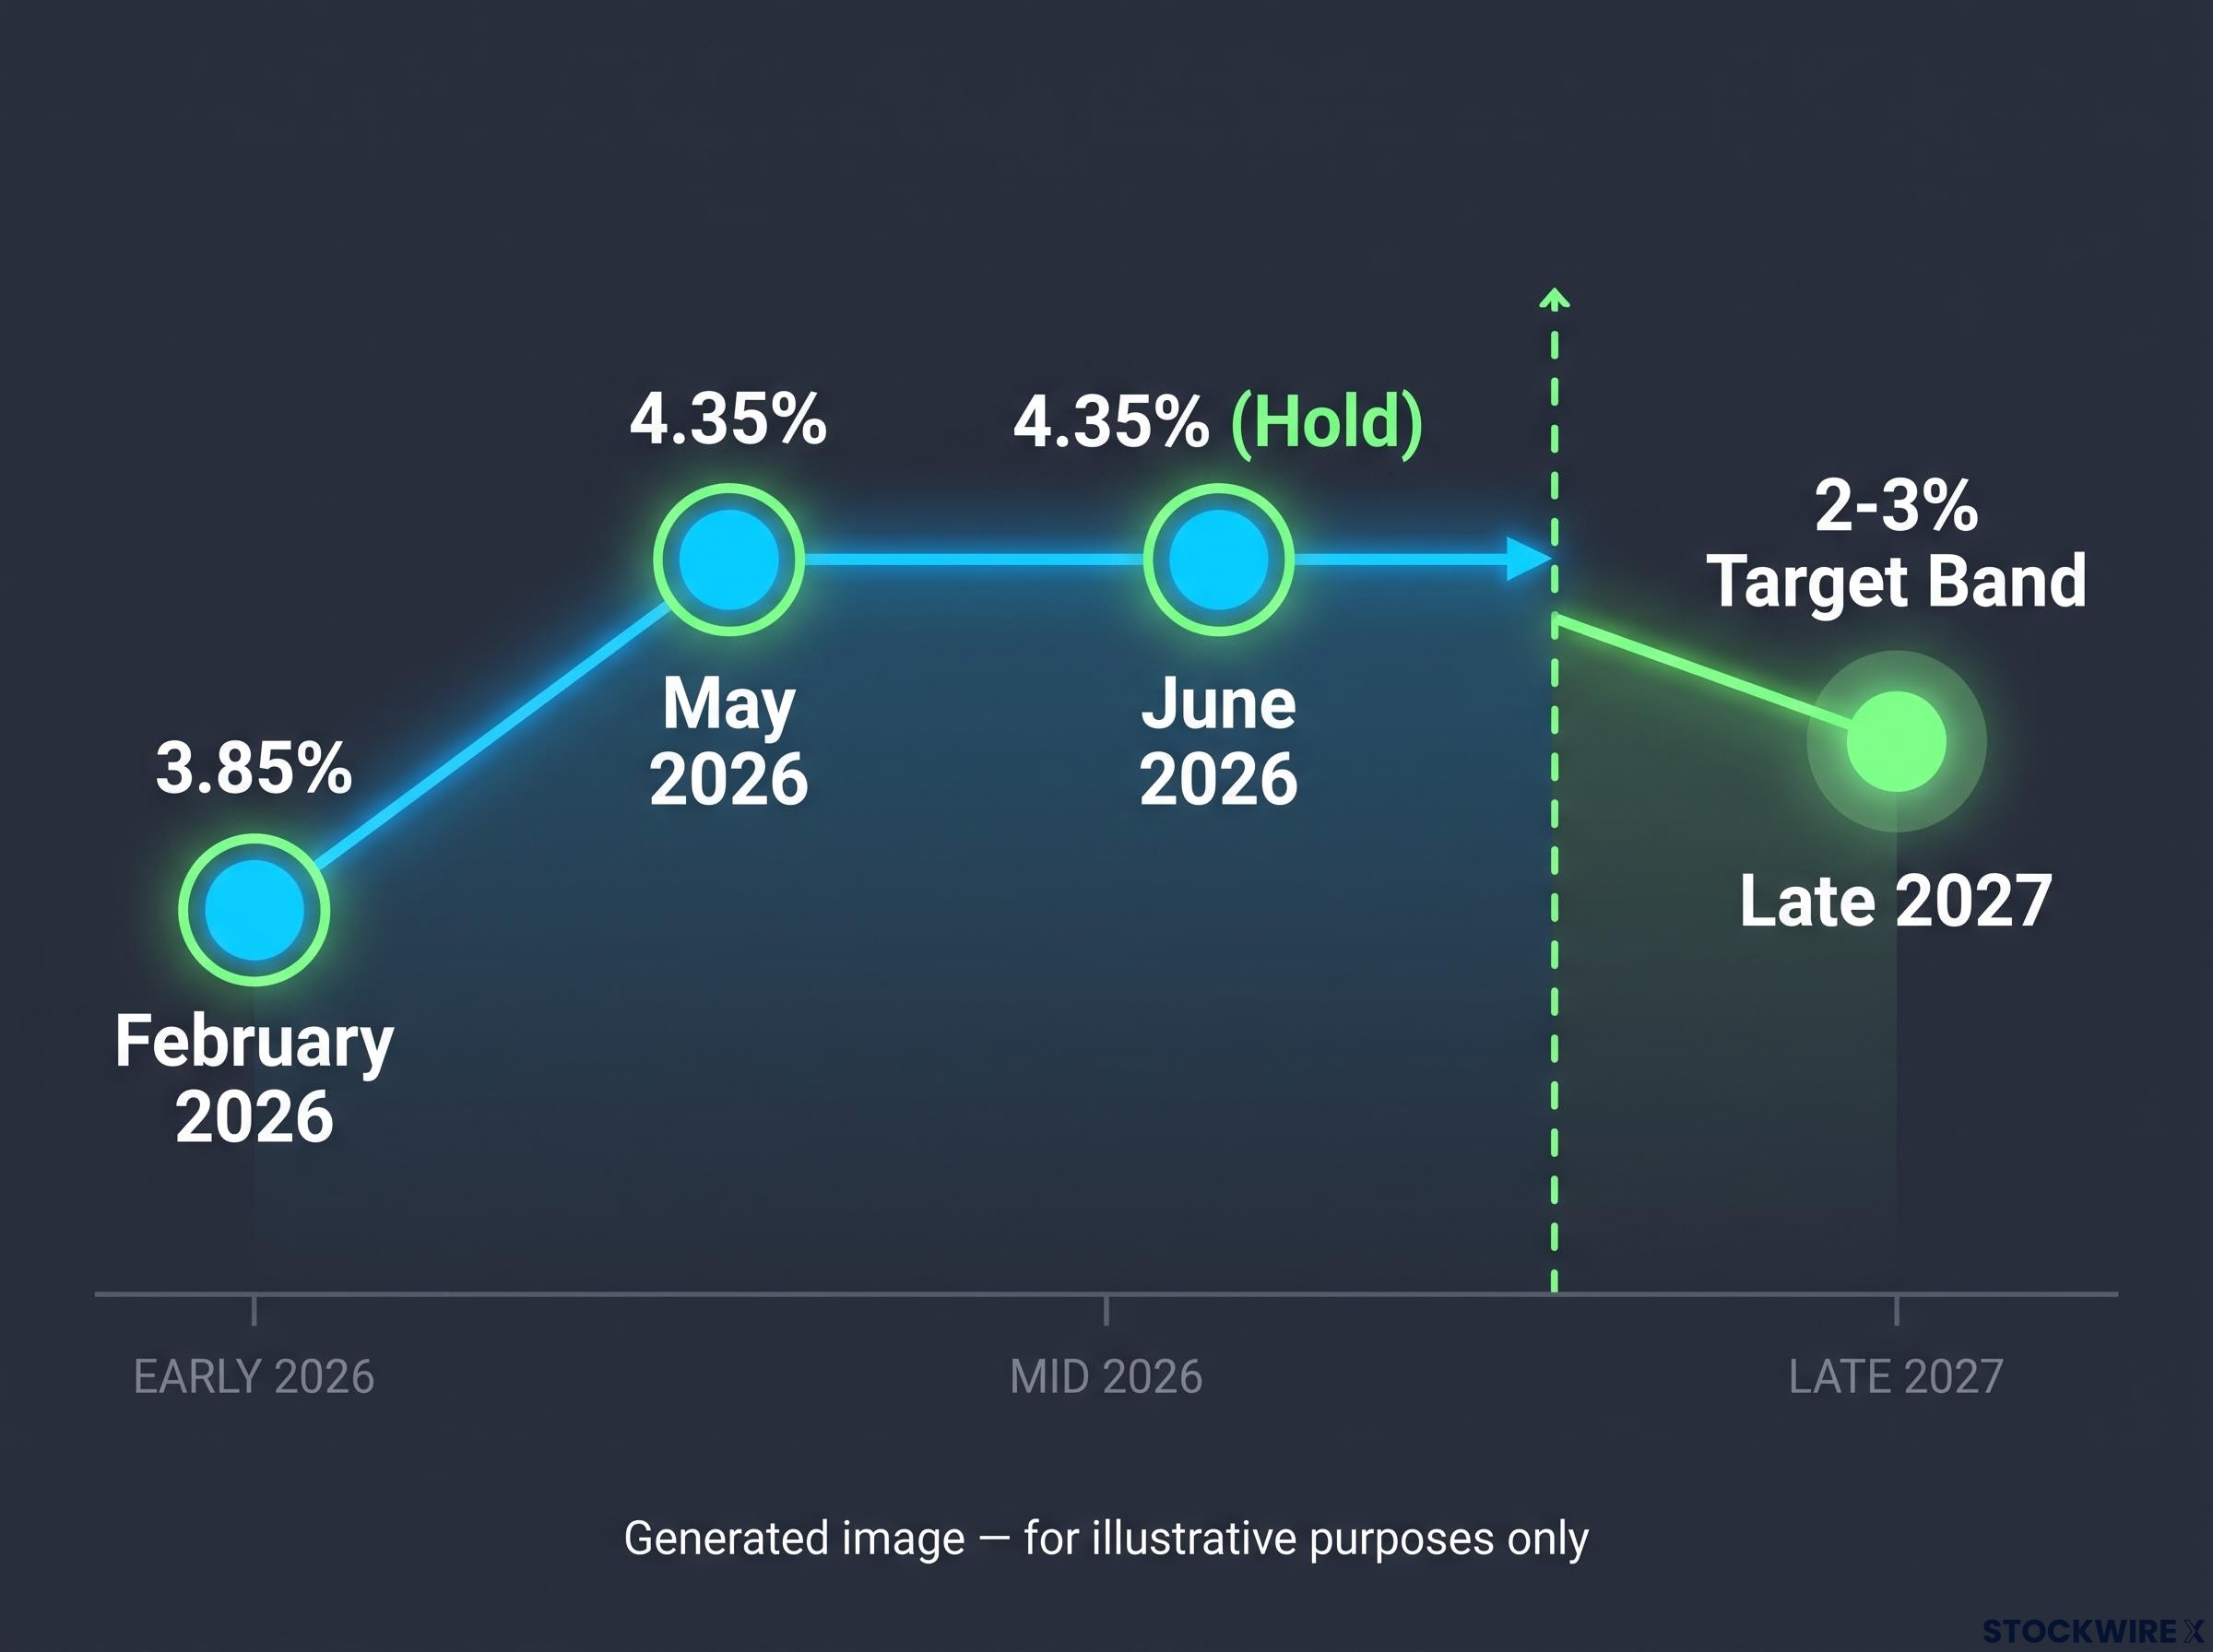
The cash rate path since February 2026 tells the story: 3.85% in February, 4.35% in May, held at 4.35% in June with the door open to more. The RBA is not waiting for one more data point to cut. It is managing a risk distribution where the cost of cutting too early exceeds the cost of holding too long, and that asymmetry will keep rates elevated even if individual monthly readings improve.
Four variables that will determine how the Australian rate story resolves
No single data point resolves the picture. The interaction between these four variables is what determines the rate path.
| Variable | What to watch | Implication for rate path |
|---|---|---|
| Global oil and gas prices | Middle East conflict escalation or de-escalation; supply recovery timeline | Sustained high prices keep upside inflation risk alive and delay any easing |
| AI capex durability | US and Asian tech investment commitments; data centre build-out pace; tech earnings guidance | A fade removes the growth buffer and could force the RBA into a growth-vs-inflation trade-off |
| Core inflation trend | Trimmed mean CPI; services inflation persistence; wage growth trajectory | Sustained decline toward target midpoint is the precondition for any easing signal |
| RBA rhetoric | Shift from “inflation still too strong” toward “confident disinflation is established” | The most direct leading indicator of a pivot; the Board will signal in language before it appears in data |
Watching RBA language for the phrase “confident disinflation” or equivalent is more informative than watching monthly CPI prints alone. The Board will signal a pivot in its rhetoric before it appears in the data. Prolonged restrictiveness remains the base case; cuts require either clear disinflation or sharp growth deterioration.
What this means for Australian investors navigating the split-force environment
The macro framework above translates into specific sector and asset class implications.
| Asset class | Current environment impact | Key watchpoint |
|---|---|---|
| Fixed income | Curve steepening risk as markets price “high for longer” | Short-to-intermediate duration more defensible until clearer disinflation signal |
| Equities (rate-sensitive) | Ongoing headwinds from prolonged restrictive rates | RBA rhetoric shift toward easing bias |
| Equities (resource-exposed) | Both macro forces currently supportive | AI capex durability and Asian demand trajectory |
| AUD | Pulled by RBA-Fed rate differentials and Asian demand strength | AI investment cycle durability is a currency variable as well as a growth variable |
The sectors facing the most direct pressure in a sustained high-rate environment include:
- REITs with high leverage and rate-sensitive valuations
- Utilities exposed to rising financing costs
- Consumer discretionary names where household spending is being squeezed by higher mortgage costs
Relatively better prospects sit with firms carrying pricing power, low leverage, and exposure to global AI and energy capex cycles. LNG and resource exporters are currently the one part of the Australian market where the two opposing macro forces are both working in the same direction, making that sector the clearest expression of the current macro environment rather than a hedge against it.
ASX concentration risk compounds the macro exposure described here: a portfolio weighted toward the big four banks and major resource names is simultaneously exposed to the rate-sensitive valuation headwinds and the AI capex cycle durability question, two variables that the current split-force environment is pulling in different directions.
Where the balance of forces points from here
The Middle East conflict and the AI investment boom are pulling Australia’s outlook in opposite directions, and the RBA is managing the consequences of both simultaneously, not sequentially. The most likely path from here is prolonged rate restrictiveness, not an imminent pivot.
The specific resolution depends on which of the four monitoring variables moves first and in which direction. AI capex durability, not oil prices alone, is the under-appreciated swing variable. A fade in AI-related external demand would both weaken growth and remove the offset that has so far kept the overall outlook from deteriorating faster.
The practical implication is not to wait for more clarity. It is to build portfolio positions that are robust to both the prolonged-restrictiveness scenario and the sudden AI-capex-fade scenario simultaneously. The forces pulling in opposite directions are not going to resolve neatly, and the investors who position for that ambiguity, rather than betting on one side of it, will be better placed when the resolution arrives.
This article is for informational purposes only and should not be considered financial advice. Investors should conduct their own research and consult with financial professionals before making investment decisions. Forward-looking statements regarding RBA policy, AI investment trends, and energy prices are subject to change based on market developments and geopolitical conditions.