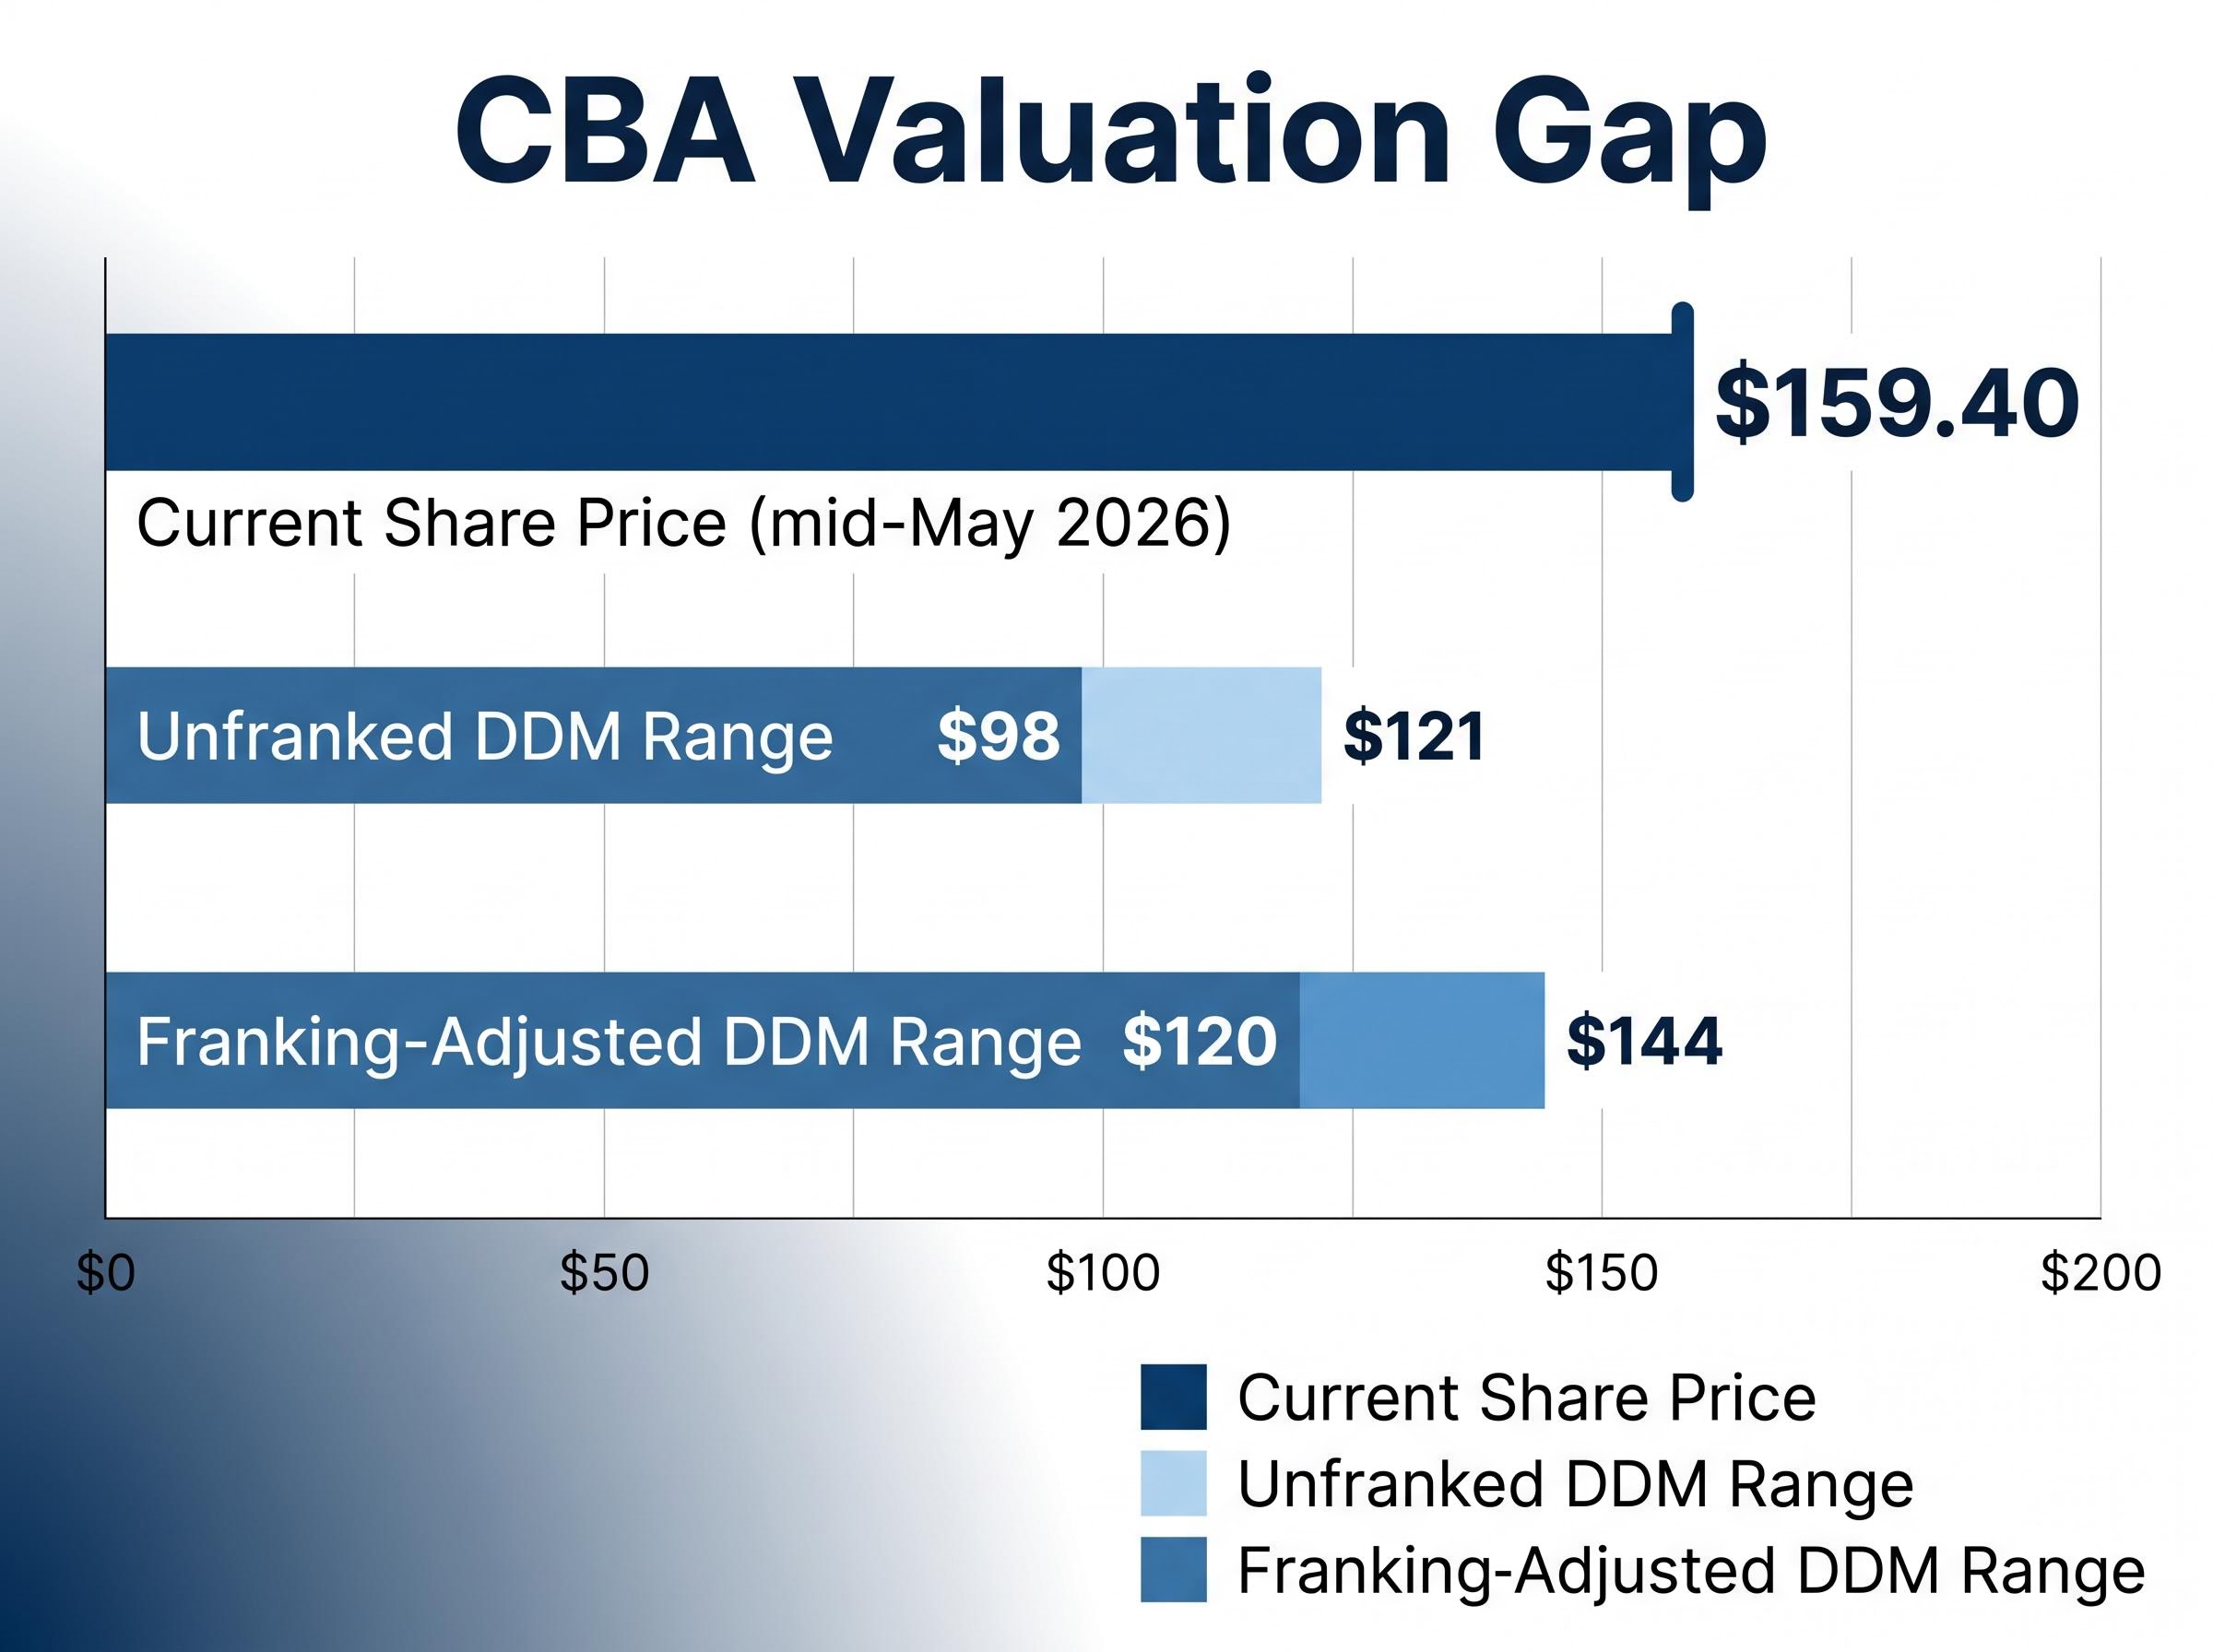
At roughly $159.40 per share in mid-May 2026, Commonwealth Bank of Australia sits at a level that even its most loyal institutional holders describe as “too rich for new money.” Run the latest confirmed dividend through a Dividend Discount Model and the gap between price and value becomes quantifiable: intrinsic value estimates range from approximately $98 to $144 depending on how franking credits are treated, implying a premium of 10% to 60% above fair value.
CBA is the most widely held stock on the ASX and a cornerstone of millions of Australian retirement portfolios. With the share price near all-time highs, the question of whether that price is justified by the underlying dividend stream is directly relevant to any investor reviewing their position or considering a new allocation.
What follows is a Dividend Discount Model valuation of CBA using its confirmed FY2025 dividend of $4.85 per share, an explanation of what the DDM does and does not capture, an adjustment for the grossing-up effect of full franking, and a comparison against broker views and peer multiples. The result is a rounded valuation picture built from confirmed data rather than assumptions.
What the dividend discount model actually measures
A share’s fair value, under the DDM framework, equals the present value of all future dividends an investor expects to receive. Rather than forecasting every payment into perpetuity, the Gordon Growth Model compresses that stream into a single formula:
Share Price = Annual Dividend / (Risk Rate – Dividend Growth Rate)
The formula relies on three inputs:
- Annual Dividend: the most recent full-year dividend per share, used as the base for future projections
- Risk Rate (required return): the minimum annual return an investor demands to hold the stock, reflecting opportunity cost and risk appetite
- Dividend Growth Rate: the expected annual rate at which dividends will grow over the long term
The DDM works best for mature, high-payout companies with stable earnings, and CBA fits that profile. The bank pays approximately 85% of income as dividends and has maintained a payout history stretching back decades. Its FY2025 total dividend was $4.85 per share, fully franked, comprising a $2.25 interim and a $2.60 final dividend, as confirmed in CBA’s FY2025 ASX profit announcement.
The dividend discount model for ASX income stocks works best when applied to companies with stable, mandated, or structurally predictable payout histories; Australian banks, listed infrastructure, and utilities all meet that threshold in ways that high-growth technology companies do not, which is precisely why the DDM is the dominant lens professional analysts apply to CBA.
Understanding the mechanics matters because the model’s output is only as reliable as its inputs. Retail investors who hold CBA primarily for income gain a framework for judging whether they are paying a fair price for that income stream, and the ability to stress-test any assumption rather than accept a single number.
When big ASX news breaks, our subscribers know first
CBA’s dividend base: what the numbers actually are
Before any modelling begins, the inputs need to be grounded in confirmed, primary-source data.
The foundational figure is CBA’s FY2025 total dividend per share of $4.85, fully franked:
- Interim dividend (half-year ended 31 December 2024): $2.25 per share, fully franked
- Final dividend (half-year ended 30 June 2025): $2.60 per share, fully franked
- Total FY2025 DPS: $4.85, fully franked
Earlier circulated figures of $4.65 should be disregarded. CBA does not provide formal forward dividend guidance; payout decisions are made each half-year by the board. Any forward estimates used in modelling are illustrative rather than company-endorsed.
The bank’s capital position provides context for dividend durability:
- CET1 ratio at 31 March 2026 (APRA Level 2): 11.6%
- CET1 ratio at 30 June 2025: 12.3%
- Both figures remain comfortably above APRA minimum requirements
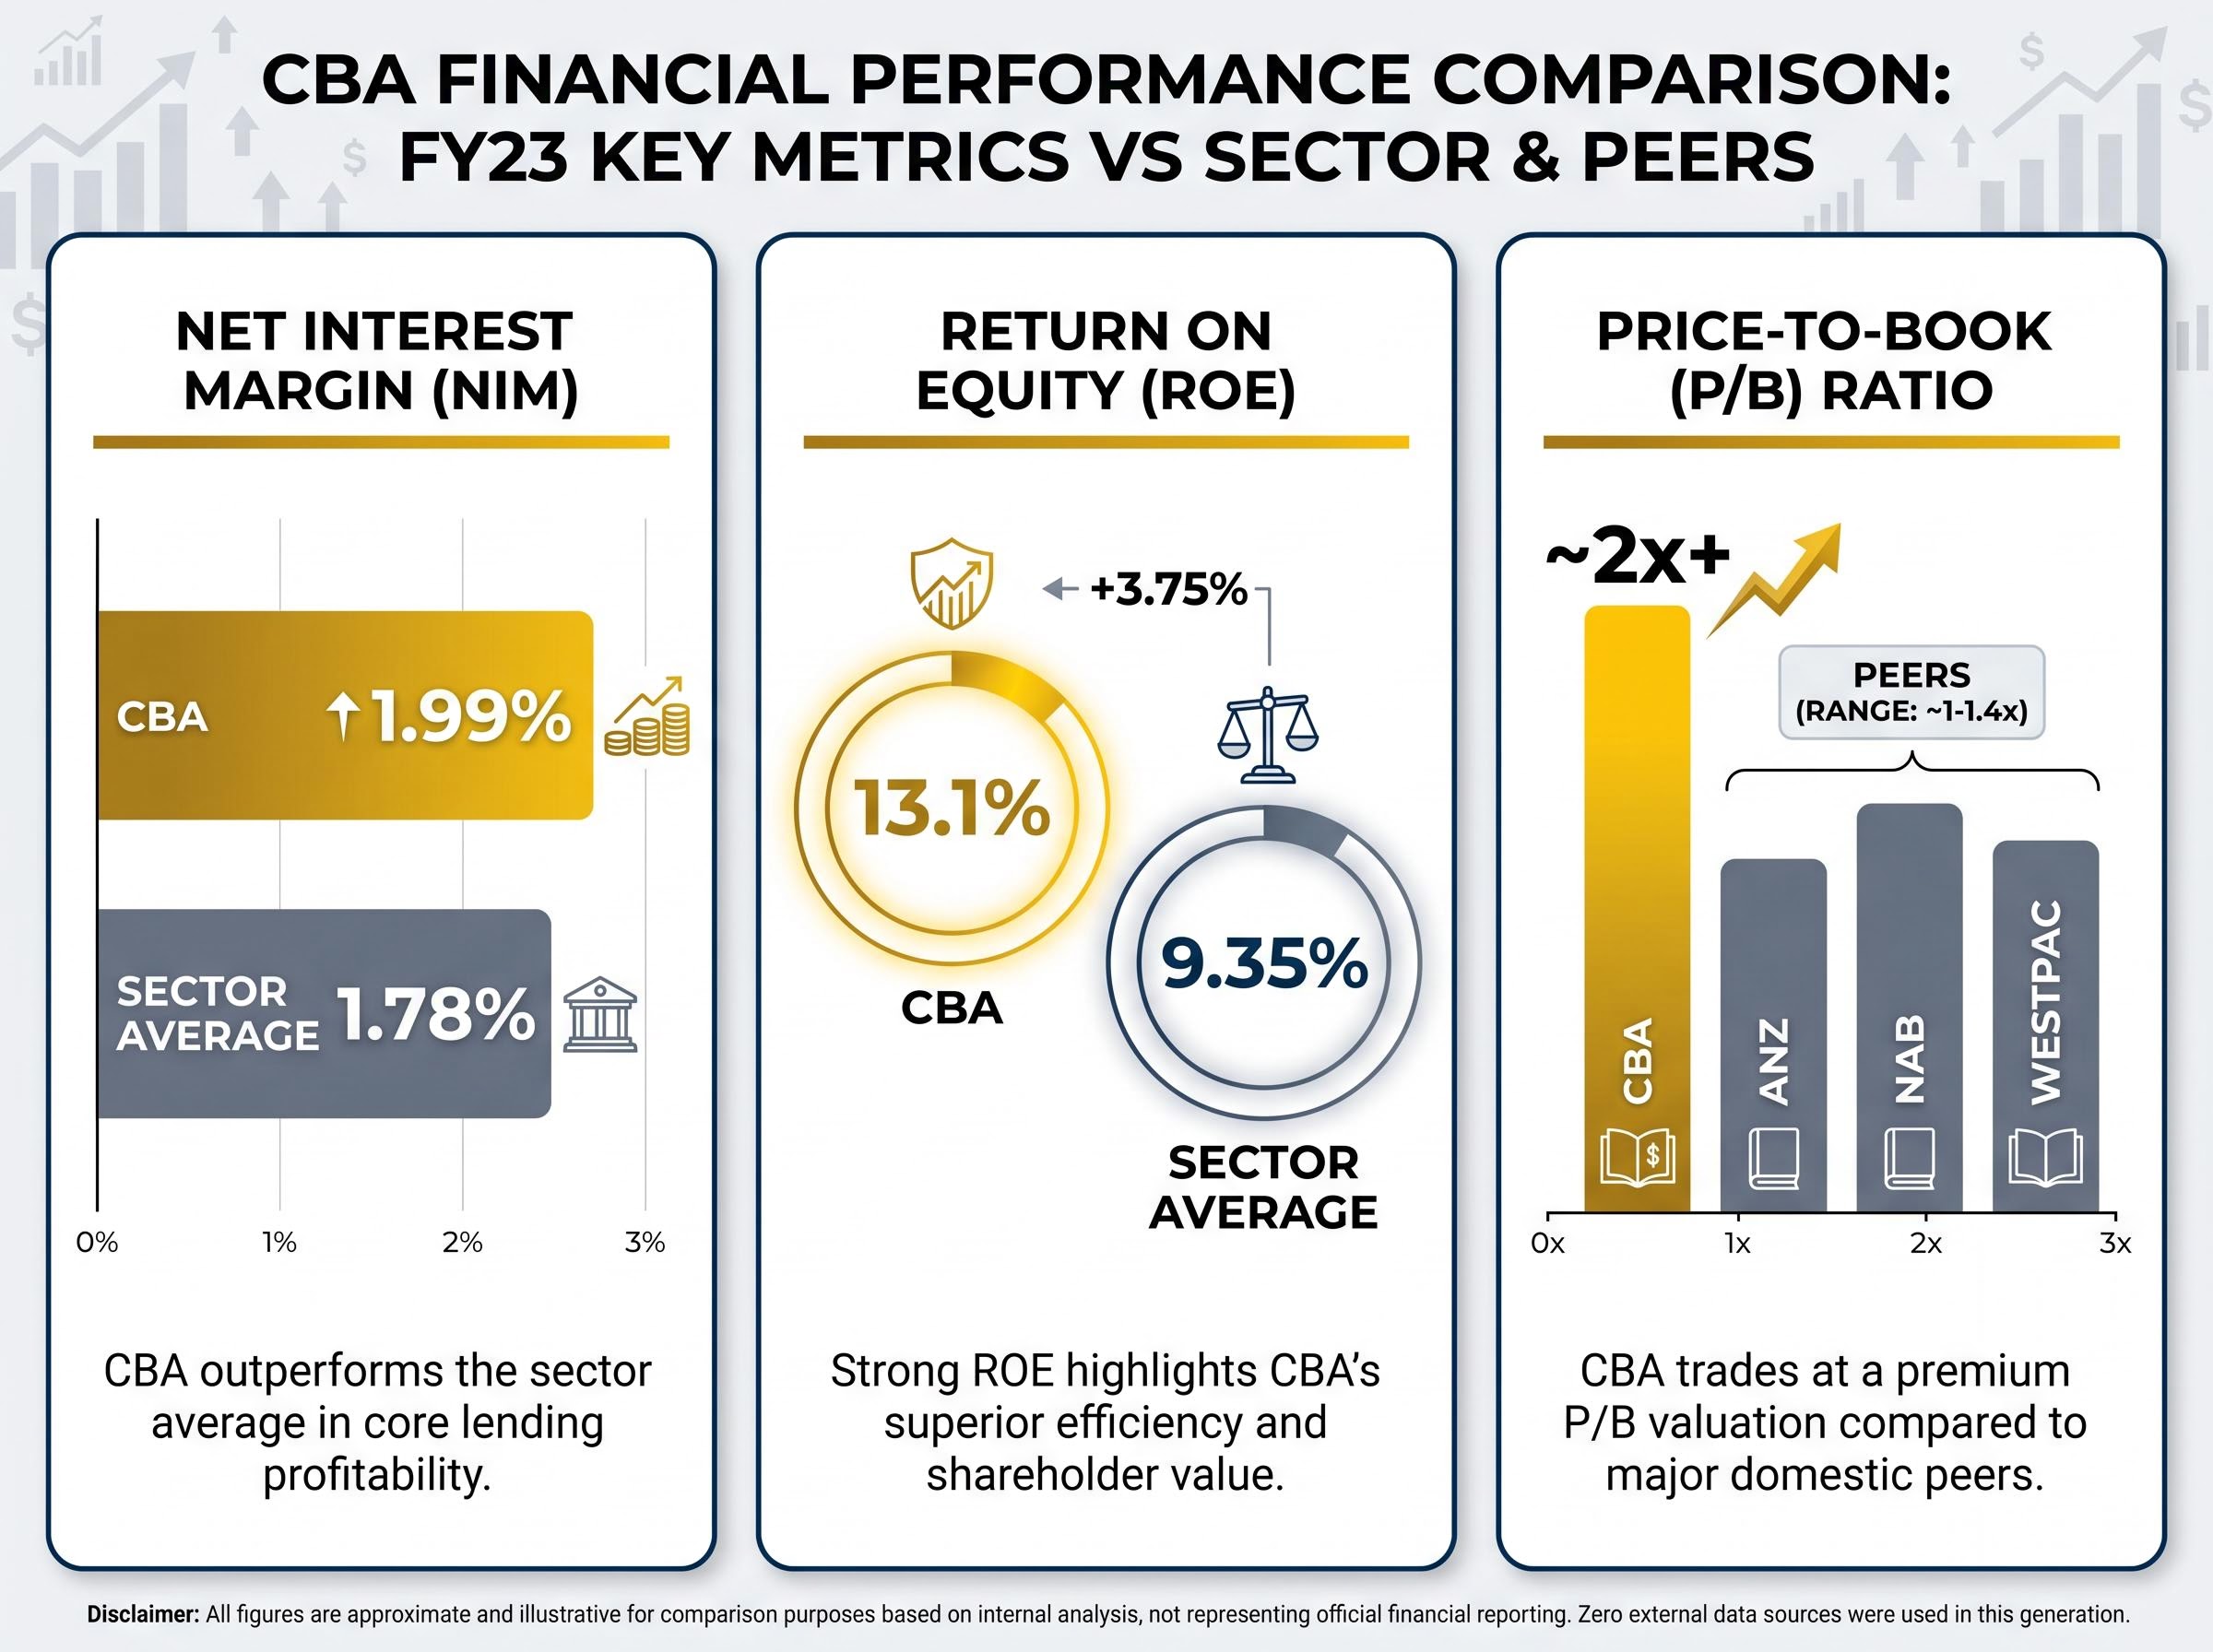
The decline from 12.3% to 11.6% does not signal distress, but it limits headroom for aggressive payout acceleration. APRA’s ongoing consultative work on its capital framework reinforces regulatory caution around dividend growth. CBA’s net interest margin (NIM) of 1.99% versus a sector average of 1.78%, and return on equity (ROE) of 13.1% versus 9.35% for the sector, explain why dividend capacity is currently strong. The question is whether that strength translates to growth.
CBA’s CET1 capital position tells a more nuanced story than the headline ratio alone suggests; total risk-weighted assets grew 2.4% to $517.5 billion during Q3 FY2026, driven by expansion in commercial lending and residential mortgages, and the completion of a $1.85 billion Tier 2 subordinated notes issuance reflects deliberate capital stack management rather than a passive response to balance sheet growth.
Running the model: what a range of assumptions produces
The DDM formula applied to CBA’s confirmed $4.85 DPS, across a matrix of growth and required return assumptions, generates the following intrinsic value estimates:
| Risk Rate | 2% Growth | 3% Growth | 4% Growth |
|---|---|---|---|
| 6% | $121.25 | $161.67 | $242.50 |
| 8% | $80.83 | $97.00 | $121.25 |
| 10% | $60.63 | $69.29 | $80.83 |
| 11% | $53.89 | $60.63 | $69.29 |
The spread is wide, which is the point. Under the most commonly used assumptions for a mature Australian bank (a required return of 6-8% and dividend growth of 2-3%), the DDM produces estimates in the range of approximately $97 to $162. The central cluster sits well below the current share price.
At a base-case required return of 8% and 3% dividend growth, the DDM estimates CBA’s intrinsic value at approximately $97, versus the current share price of $159.40. That is a premium of roughly 64%.
Even the most optimistic realistic combination (a 6% required return with 3% growth) yields $161.67, barely above the current price and requiring assumptions that leave no margin for error. Using an illustrative forward DPS of approximately $4.76 shifts the central estimate only marginally, to the $100-$101 range. The overvaluation signal is not dependent on a single input; it persists across the matrix.
How franking credits change the picture
Australia’s dividend imputation system means CBA’s fully franked dividends carry a tax credit equal to the corporate tax already paid on the underlying earnings. For eligible Australian investors, this credit is real economic value that a raw DDM misses entirely.
The gross-up calculation is straightforward:
- Start with the cash dividend: $4.85 per share
- Apply the gross-up formula: $4.85 / (1 – 0.30) where 0.30 is the 30% corporate tax rate
- Result: approximately $6.93 per share in grossed-up dividend value
Re-running the DDM on this grossed-up figure shifts the valuation range upward, to approximately $120 to $144 under the most commonly used assumptions (versus $98 to $121 unfranked).
Even at the top of the franking-adjusted range ($144), the current share price of $159.40 implies a premium of approximately 11%.
Franking narrows the gap. It does not close it.
Who gets the full franking benefit?
The value of the franking credit depends entirely on the investor’s tax position, which means two shareholders holding identical CBA parcels at identical prices are effectively receiving different returns.
Pension-phase superannuation members receive the full franking refund, making the grossed-up yield of approximately $6.93 per share the relevant figure for this cohort. For investors on higher marginal tax rates, the benefit is partial; the franking credit offsets some tax liability but does not generate a cash refund. This asymmetry has direct implications for how each investor type should value the stock. A retiree in pension phase may see CBA as closer to fair value than a high-income earner considering the same shares.
Australia’s dividend imputation system is unique among major markets, which means global valuation frameworks typically exclude the franking adjustment. For domestic investors, particularly retirees and self-managed super fund holders who form a large portion of CBA’s shareholder register, ignoring it would understate the true return.
What the broader valuation picture adds to the DDM finding
A DDM result in isolation could be dismissed as model-dependent. The analytical conclusion hardens when multiple independent frameworks point in the same direction.
Institutional and broker commentary corroborates the overvaluation signal:
- Morgan Stanley maintains an underweight rating on CBA, describing its premium as “significant” and “difficult to justify” given moderating mortgage growth and competitive margin pressure (AFR-summarised research, early February 2026)
- Morningstar rates CBA as trading above fair value despite awarding a wide moat rating, noting that shareholders are “paying a premium for safety and franchise quality”
- Large Australian fund managers have consistently described CBA as “too rich for new money” at current multiples across late-2025 and early-2026 commentary
Relative multiples reinforce the picture. CBA trades at approximately 2x price-to-book or above, compared to roughly 1-1.4x for ANZ, NAB, and Westpac.
The analyst consensus on CBA’s valuation is notably unified for a stock of its size: fourteen of sixteen analysts held sell or strong sell ratings as at April 2026, with a consensus price target of $129.85 implying roughly 25% downside from prevailing prices, a degree of professional agreement that is unusual for the ASX’s largest bank.
| Metric | CBA | Sector Average / Peer Range |
|---|---|---|
| Net Interest Margin | 1.99% | 1.78% |
| Return on Equity | 13.1% | 9.35% |
| Price-to-Book (approx.) | ~2x+ | ~1-1.4x |
CBA commands this premium because it has earned it: superior NIM, superior ROE, dominant market positions (over 20% of mortgages, over 25% of credit cards, 15 million customers), and a culture score above the sector average. The question is not whether CBA deserves a premium. It is whether the premium has expanded beyond what the underlying economics support.
The RBA’s March 2026 Financial Stability Review notes that major banks remain strongly capitalised, but arrears are rising from record lows and household debt remains elevated. The base case supports dividend continuity, not acceleration.
A quality stock at a steep price: what this means for investors right now
The DDM and the broader evidence converge on a clear finding: CBA is a high-quality franchise, but the current price embeds assumptions about growth and safety that leave minimal margin for error.
At $159.40, CBA trades at a 10% to 60% premium above DDM-derived estimates, depending on franking credit treatment ($144 at the top of the franking-adjusted range; approximately $98 at the base of the unfranked range).
The implications differ by investor type:
- Existing long-term holders with a low cost base and full franking benefit face a different calculus; the grossed-up yield on their original purchase price may still be attractive, and selling triggers capital gains tax
- Income-focused new buyers weighing the grossed-up yield against the entry price are paying a premium that compresses prospective returns, even after accounting for franking
- Growth-oriented investors seeking value relative to intrinsic worth find limited support at current levels across any reasonable set of DDM assumptions
CBA’s CET1 of 11.6% at March 2026 remains solid but has declined from 12.3% at June 2025, a directional shift worth monitoring. APRA’s capital framework consultation reinforces a regulatory environment that prioritises resilience over aggressive payout growth. The RBA’s March 2026 FSR base case supports dividend continuity but not acceleration, with arrears rising and household debt elevated.
The DDM is one analytical step, not a complete answer. Investors should review multiple years of annual reports, stress-test their own growth and risk rate assumptions against the RBA’s rate trajectory, and consider perspectives that challenge their conclusions before acting.
A CBA position rarely sits in isolation; for most Australian income investors, it forms part of a broader ASX dividend income portfolio where concentration risk, payout ratio sustainability, and the timing of ex-dividend dates interact in ways that a single-stock DDM analysis cannot capture on its own.
The verdict the numbers point to, and what investors should do next
CBA’s share price reflects a market willing to pay a significant premium for perceived safety, income reliability, and franchise quality. The DDM, across all reasonable assumptions and even after grossing up for franking credits, does not support the current price as fair value for new buyers seeking intrinsic value. The unfranked range of approximately $98 to $121 and the franking-adjusted range of approximately $120 to $144 both sit below $159.40.
That premium has been a persistent feature of CBA’s market pricing for several years, not a recent development. This has implications for mean-reversion expectations: the gap may narrow, or it may persist as long as investor appetite for high-quality, fully franked income stocks remains strong. That persistence is itself a legitimate market signal worth weighing.
Three steps constitute responsible follow-through from here:
- Review at least three years of CBA annual reports for dividend trend and payout ratio trajectory
- Stress-test the required return assumption against the RBA’s rate trajectory and personal risk appetite
- Consult a financial adviser before acting on any single valuation model
This article is for informational purposes only and should not be considered financial advice. Investors should conduct their own research and consult with financial professionals before making investment decisions. Past performance does not guarantee future results. Financial projections are subject to market conditions and various risk factors.