How Wesfarmers’ AI Strategy Is Built to Compound Returns
7 hrs ago

Commonwealth Bank of Australia shares closed last week at approximately $165.51, carrying a price-to-earnings ratio of 29.4x. The banking sector average sits at 18x. A sector-adjusted calculation puts fair value closer to $102. The gap is not small, and it is not new. So why do sophisticated fund managers still hold the stock?
The answer is not hiding inside a better spreadsheet. The distance between CBA’s market price and its model-derived valuations reflects qualitative factors that quantitative screens cannot measure: management credibility built over years of post-Royal Commission reform, technology leadership relative to peers, and a deposit franchise whose cost advantage compounds quietly beneath headline earnings. For any Australian investor researching the CBA share price today, understanding what sustains that premium, and what could erode it, matters as much as knowing the PE ratio itself.
This analysis explains the qualitative due diligence framework that should accompany any quantitative assessment of ASX bank stocks, using CBA as the primary case study and drawing comparative context from ANZ, Westpac, and Macquarie.
CBA reported FY24 earnings per share of $5.63. At the current share price of approximately $165.51, that produces a PE ratio of 29.4x, against a sector average of 18x. Applying the sector average multiple to CBA’s earnings yields a sector-adjusted fair value of roughly $102.67, some 38% below where the stock trades.
Dividend discount models tell a similar story, but with a wider spread. Using a cash dividend of $4.65 per share, the base DDM estimate lands at approximately $98.33. Factor in franking credits (gross dividend of $6.80) and that figure rises to approximately $143.80. Adjust the growth and discount rate assumptions more aggressively and the DDM range spans from $52.89 (at an 11% risk rate and 2% growth) to $238.00 (at 6% risk and 4% growth).
| Valuation Method | Key Input | Estimated Value | Current Price | Gap to Market |
|---|---|---|---|---|
| Sector PE | 18x sector avg PE | ~$102.67 | ~$165.51 | ~38% below |
| Cash DDM | $4.65 dividend | ~$98.33 | ~$165.51 | ~41% below |
| Gross DDM (incl. franking) | $6.80 gross dividend | ~$143.80 | ~$165.51 | ~13% below |
That spread is not a flaw in the models. It is the models showing their own limitations. The growth and risk-rate assumptions feeding each estimate are themselves qualitative judgments about CBA’s future. An investor who grasps this stops searching for a single correct number and starts asking better questions about the assumptions behind each one.
ASX bank share valuation models are only as reliable as the qualitative judgments embedded in their inputs: the same DDM formula applied to Bendigo and Adelaide Bank produces an output range of $7.22 to $32.50 per share depending solely on assumption choices, a spread that makes the model’s mechanical precision almost irrelevant compared to the analyst’s views on management, credit quality, and the rate cycle.

Nathan Zaia, equity analyst at Morningstar Australia, has noted that CBA’s share price implies “unrealistically high returns on equity persisting for longer than we forecast.”
Respected practitioners across Australian fund management argue explicitly that PE and yield screens are insufficient for evaluating CBA’s valuation. Wilsons Advisory has warned that “a rich multiple can be rational only if management continues to execute near flawlessly.” Perpetual’s Steve Johnson has cautioned that “screen-based value investors risk underestimating the qualitative gap in franchise strength and governance” between CBA and cheaper peers. Paul Moore of PM Capital, speaking via Livewire Markets, has noted that quantitative screens would push investors into cheaper banks “without understanding why the market’s been willing to pay up for CBA.”
The implication is direct. CBA’s premium is rational only under specific qualitative conditions: near-flawless management execution, sustained franchise strength, and continued technology leadership. If any of those conditions deteriorates, the premium compresses, and the downside is steeper precisely because the starting multiple is elevated.
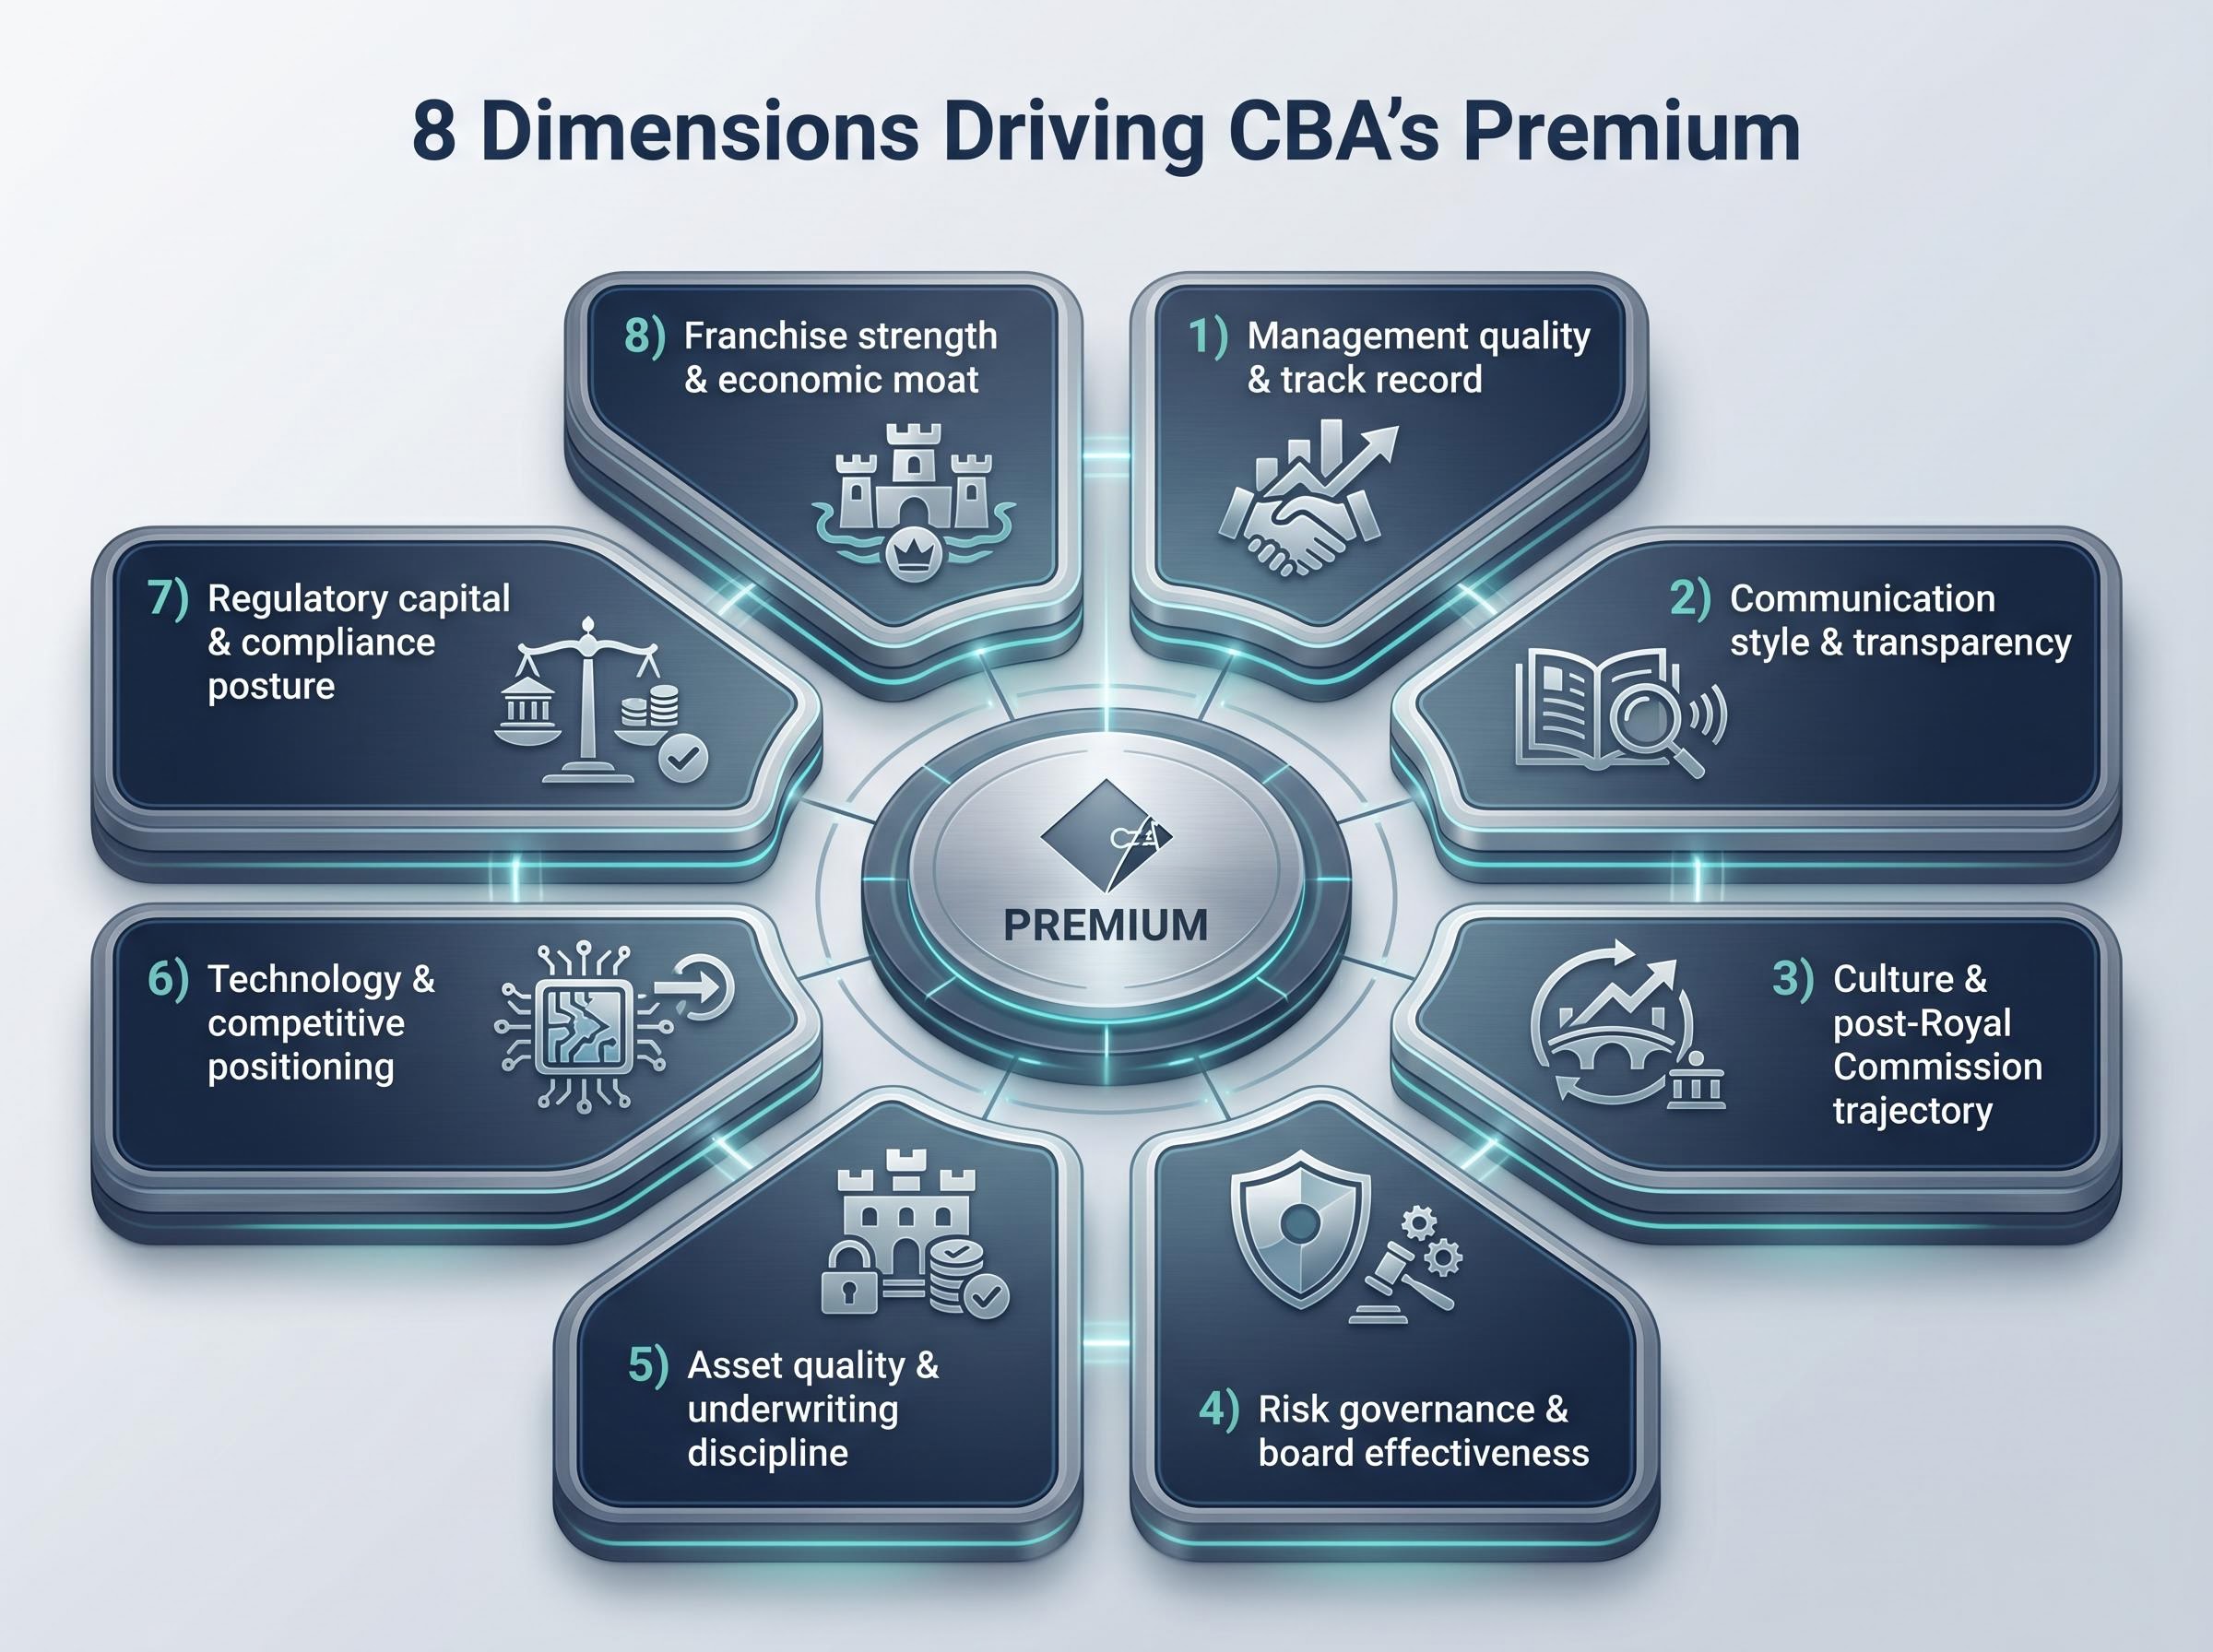
The following framework, drawn from analyst and regulatory sources, identifies the load-bearing qualitative factors:
Investors who understand which of these dimensions are load-bearing will also recognise the specific scenarios where the premium could compress.
Loan impairment expense trajectory sits at the intersection of asset quality and earnings sustainability: CBA’s impairment charges more than doubled from $511 million in FY23 to $1,154 million in FY24, a movement that standard PE multiples and DDM inputs lagged by several reporting periods and that a qualitative due diligence process reviewing Pillar 3 disclosures would have flagged earlier.
Matt Comyn’s leadership of CBA has been characterised by measured conservatism. James Eyers of the Australian Financial Review described his approach at the 1H FY24 results briefing as “cautious, incremental,” noting that Comyn deliberately sought to tamp down expectations for margin expansion while emphasising balanced outcomes for customers, staff, and shareholders.
Morgans Financial has credited this consistency directly to the premium. Its analysts observed that “under CEO Matt Comyn, CBA has maintained a clear, consistent strategic narrative: technology leadership, disciplined risk, and simplification of the portfolio,” arguing that management credibility and execution track record are central to the market’s willingness to sustain a premium multiple. Fund managers quoted by Charlotte Grieve in the Sydney Morning Herald described Comyn’s post-Royal Commission communication as “substantially more open and self-critical” than prior CBA leadership.
Citi Research has flagged the mirror risk: at CBA’s current multiple, “any mis-steps in strategy communication” carry an outsized downside, making management communication a continuous live input rather than a one-time assessment.
The practical implication is that management communication quality is observable, free, and structured. Investors can assess it directly using public documents:
The regulatory environment has shifted from background noise to a direct qualitative input. APRA’s Corporate Plan for 2023-2027 identifies “strengthening governance, culture, remuneration and accountability (GCRA)” as an explicit priority. Its 2024 policy workstreams included finalising updates to the CPS 220 credit risk management standard, issuing climate-related financial risk guidance, and overseeing implementation of the Financial Accountability Regime (FAR).
The FAR, which replaces the older Banking Executive Accountability Regime (BEAR), expands obligations for senior executives and directors. Banks must now maintain clear accountability statements and demonstrate that governance frameworks assign personal responsibility for risk outcomes. For investors, this means board composition and executive accountability mapping are no longer secondary to headline financial results; they carry regulatory enforcement teeth.
APRA’s Financial Accountability Regime commenced for authorised deposit-taking institutions in March 2024, replacing the older BEAR framework and extending personal accountability obligations to a broader class of senior executives and directors across all major Australian banks.
Westpac’s AUSTRAC case remains the clearest illustration. The governance failure translated into sustained operational and reputational cost, ongoing remediation, and board renewal, precisely the kind of damage that does not appear in PE ratios until well after the fact. APRA’s climate vulnerability assessment has separately concluded that boards must “materially enhance oversight of climate-related financial risk,” shifting climate from a disclosure issue to a board-level governance requirement.
Investors conducting governance due diligence should prioritise the following:
The strongest qualitative input available to a CBA investor is not the bullish thesis. It is the bearish one.
Richard Wiles at Morgan Stanley maintains an Underweight rating, describing CBA as “arguably the most expensive major bank in the world.” Jonathan Mott at UBS has characterised the valuation as “stretched” relative to CBA’s growth outlook, citing peaking net interest margins. Nathan Zaia at Morningstar has reiterated that the share price implies returns on equity persisting at levels his team considers unrealistic. Kerr Neilson at Platinum Asset Management has described CBA as “the highest-quality of the majors but priced as if it were a growth stock,” with limited margin of safety. Macquarie equities research has warned that ultra-low bad debt charges are unsustainably low and that credit cycle normalisation would hit premium-valued banks hardest.
Provisioning cycle normalisation is the mechanism most consistently cited across bearish research: Morgans forecasts total Big Four provisions rising from approximately $2.4 billion in FY25 to approximately $5.5 billion by FY27, a trajectory that would compress earnings most severely at the bank trading on the highest multiple because the market’s growth assumptions leave the least buffer.
| Analyst / House | View | Core Concern | Implication for Investors |
|---|---|---|---|
| Morgan Stanley (Wiles) | Underweight | Most expensive major bank globally | Franchise quality more than fully priced |
| UBS (Mott) | Neutral / Cautious | Stretched valuation vs growth outlook | Peaking margins limit earnings upside |
| Morningstar (Zaia) | Overvalued | Implies unrealistic ROE persistence | Fair value significantly below market |
| Platinum (Neilson) | Structural underweight | Priced as growth stock without growth | Limited margin of safety at current levels |
| Macquarie equities | Cautious | Credit cycle normalisation risk | Premium-valued banks most exposed to earnings surprise |
The common thread is instructive. None of these analysts argue CBA is a bad business. Every one argues the current price requires continued near-flawless execution across multiple dimensions simultaneously.
Steve Johnson of Perpetual has framed this directly: “At today’s multiples, investors must have a high-conviction, documented thesis on management quality and culture, otherwise you’re just paying up for the label on the bottle.”
An investor who has read the bearish case and still holds CBA has a stronger, more defensible thesis than one who has only read the bullish case.
The analytical layers above converge on a single practical output. Drawing on frameworks from Andrew Mitchell at Ophir Asset Management (via Livewire Markets), Vanguard Australia, Morningstar’s stewardship methodology, and ASIC MoneySmart, the following five-step qualitative checklist distils the most actionable dimensions for bank investors:
The discipline is not in completing the checklist once. It is in documenting the qualitative assessment at the time of the investment decision, recording the specific assumptions on which the thesis depends, and setting a calendar reminder to revisit after each results season.
A documented thesis allows investors to distinguish between price volatility, which is normal and does not invalidate a thesis, and genuine deterioration in the qualitative factors, which does. The specific signals that would cause a change of view should be written down before they occur, not rationalised after the fact.
Quantitative models, PE screens, and dividend discount calculations are indispensable starting points. They are also explicitly incomplete. Their outputs depend on qualitative assumptions about growth, risk, and management quality that the models themselves cannot validate.
Three qualitative actions carry the most weight. First, assess management communication across at least three years of disclosures, looking for consistency, candour, and how risk language evolves in difficult periods. Second, actively read bearish analyst research to stress-test the investment thesis against its strongest opposition. Third, document the specific qualitative assumptions on which the investment decision rests, and revisit them with discipline after each results season.
Whether CBA at its current price represents a sound investment depends less on any single valuation model and more on whether the investor can articulate, and defend, a documented thesis about the qualitative factors that justify paying a 63% premium to the sector average PE.
The tension between price momentum and valuation fundamentals across the Big Four reached a point in early 2026 where CBA held unanimous sell ratings from all 14 covering analysts while its share price continued to trade well above consensus price targets, a divergence that illustrates precisely why a documented qualitative thesis matters more than price action alone as a signal of whether a premium is still rational.
This article is for informational purposes only and should not be considered financial advice. Investors should conduct their own research and consult with financial professionals before making investment decisions.
CBA trades at a 29.4x PE ratio compared to a sector average of 18x because the market prices in qualitative factors including management credibility, technology leadership, and a low-cost deposit franchise that standard valuation models cannot fully capture.
A dividend discount model estimates a share's fair value based on expected future dividends discounted back to today; applied to CBA using a cash dividend of $4.65 per share, the base estimate lands around $98.33, rising to approximately $143.80 when franking credits are included.
Investors can review at least three years of CEO addresses and results presentations, compare stated strategic priorities year-on-year for consistency, and assess whether risk disclosures expand or contract during difficult periods, all of which are publicly available at no cost.
Pillar 3 risk disclosures, remuneration reports assessed through the APRA CPG 511 lens, board skills matrices, FAR accountability statements, and any public APRA correspondence all signal governance quality before issues typically surface in headline financial results.
The Financial Accountability Regime (FAR) replaced the older BEAR framework in March 2024 and requires senior bank executives and directors to hold documented personal accountability for risk outcomes, meaning board composition and governance quality now carry direct regulatory enforcement consequences for investors to monitor.