
A 5.24% yield on the US 10-year Treasury is supposed to be a problem for shares. Higher yields raise the rate used to value future profits, and that usually pulls stock prices down. Yet FactSet expects S&P 500 companies to report 29.6% earnings growth for Q3, so the 10-year yield outlook and the earnings outlook are pointing in different directions.
That tension is being tested from several sides at once. Brent crude is trading near US$105 a barrel after a run of tanker attacks in the Persian Gulf. The real yield on 10-year inflation-protected Treasuries, which is the return after inflation, sits around 2.9%.
The calendar adds pressure. JPMorgan reports on 13 October, and US consumer price data for September lands on 14 October.
Here is a way to judge whether today’s yields reflect economic strength or economic stress. You will also see which indicators should tell you which reading is winning this week.
Why are yields this high, and what does the 10-year yield outlook depend on?
The 10-year Treasury closed at 5.24% on 9 October, and market data feeds showed 5.262% on 11 October. On 19 August 2026, the WSJ market data page showed 4.645%, so yields have climbed sharply since late summer.
That single number on the screen bundles together several separate pressures. Four drivers are usually cited:
The 10-year figure is a market price rather than a fixed number, and how bond yields move depends on inflation data, central bank expectations and fiscal risk, which is why the cause of a rise matters more than its direction.
- Resilient growth: strong jobs data, firm consumer spending and solid earnings lift yields. This is the healthy version.
- Sticky inflation and a higher neutral rate: the neutral rate is the interest rate that neither speeds up nor slows down the economy. Firms such as BlackRock and Vanguard have argued that re-shoring, AI investment and fiscal spending keep it structurally higher. On this view, higher yields are a new baseline rather than a temporary spike.
- A higher term premium: the term premium is the extra return investors demand for locking money away for longer. Goldman Sachs, JPMorgan and others have pointed to a rising premium, which signals uncertainty rather than strength.
- Heavy fiscal issuance: large deficits and quantitative tightening, where the Fed lets its bond holdings run down, add long-dated supply. If demand does not match that supply, yields can rise for reasons unrelated to growth.
The first and last drivers carry very different messages for equities. Growth-led yields come with rising profits. Supply-led yields raise the cost of capital without that offsetting support.
The real-yield signal The 10-year TIPS real yield is about 2.9% (Bloomberg 2.89%, TradingEconomics 2.88%).
A real yield near 3% means low-risk government bonds now pay you a genuine return above inflation. Every risk asset in your portfolio has to clear that higher bar to justify the extra risk.
Nominal versus real: why both numbers matter
The nominal yield is the headline rate. The real yield strips out expected inflation. The gap between them is called breakeven inflation, which is the average inflation rate the bond market expects over the period.
The figures do not all line up, because they come from different moments and different markets:
| Measure | Figure | Source | Date |
|---|---|---|---|
| Nominal 10-year (secondary market) | 5.24% / 5.262% | Market data feeds | 9 Oct / 11 Oct 2026 |
| Real 10-year TIPS (secondary market) | 2.89% | Bloomberg | 10 Oct 2026 |
| Real yield at reopened TIPS auction | 2.653% (unverified) | Auction reports | Auction close |
| Nominal 10-year at auction | 4.95% | Tipswatch | Auction close |
Taking the auction figures together, breakeven inflation was roughly 2.30%. Treat that as a snapshot tied to auction timing. Auction and secondary-market numbers are separate measures and should not be mixed.
When big ASX news breaks, our subscribers know first
How does $105 oil feed into inflation, yields and sector leadership?
If sticky inflation is one of the forces holding yields up, oil is the variable most likely to feed it.
Current oil picture
Brent traded near US$105 on 11 October, with WTI at about US$91-92. More than a dozen tanker incidents have been reported across the Persian Gulf, the Strait of Hormuz and the Gulf of Oman since late September. Another round of attacks came over the weekend, even after President Trump said Russia and Ukraine would halt strikes on energy infrastructure.
Transmission
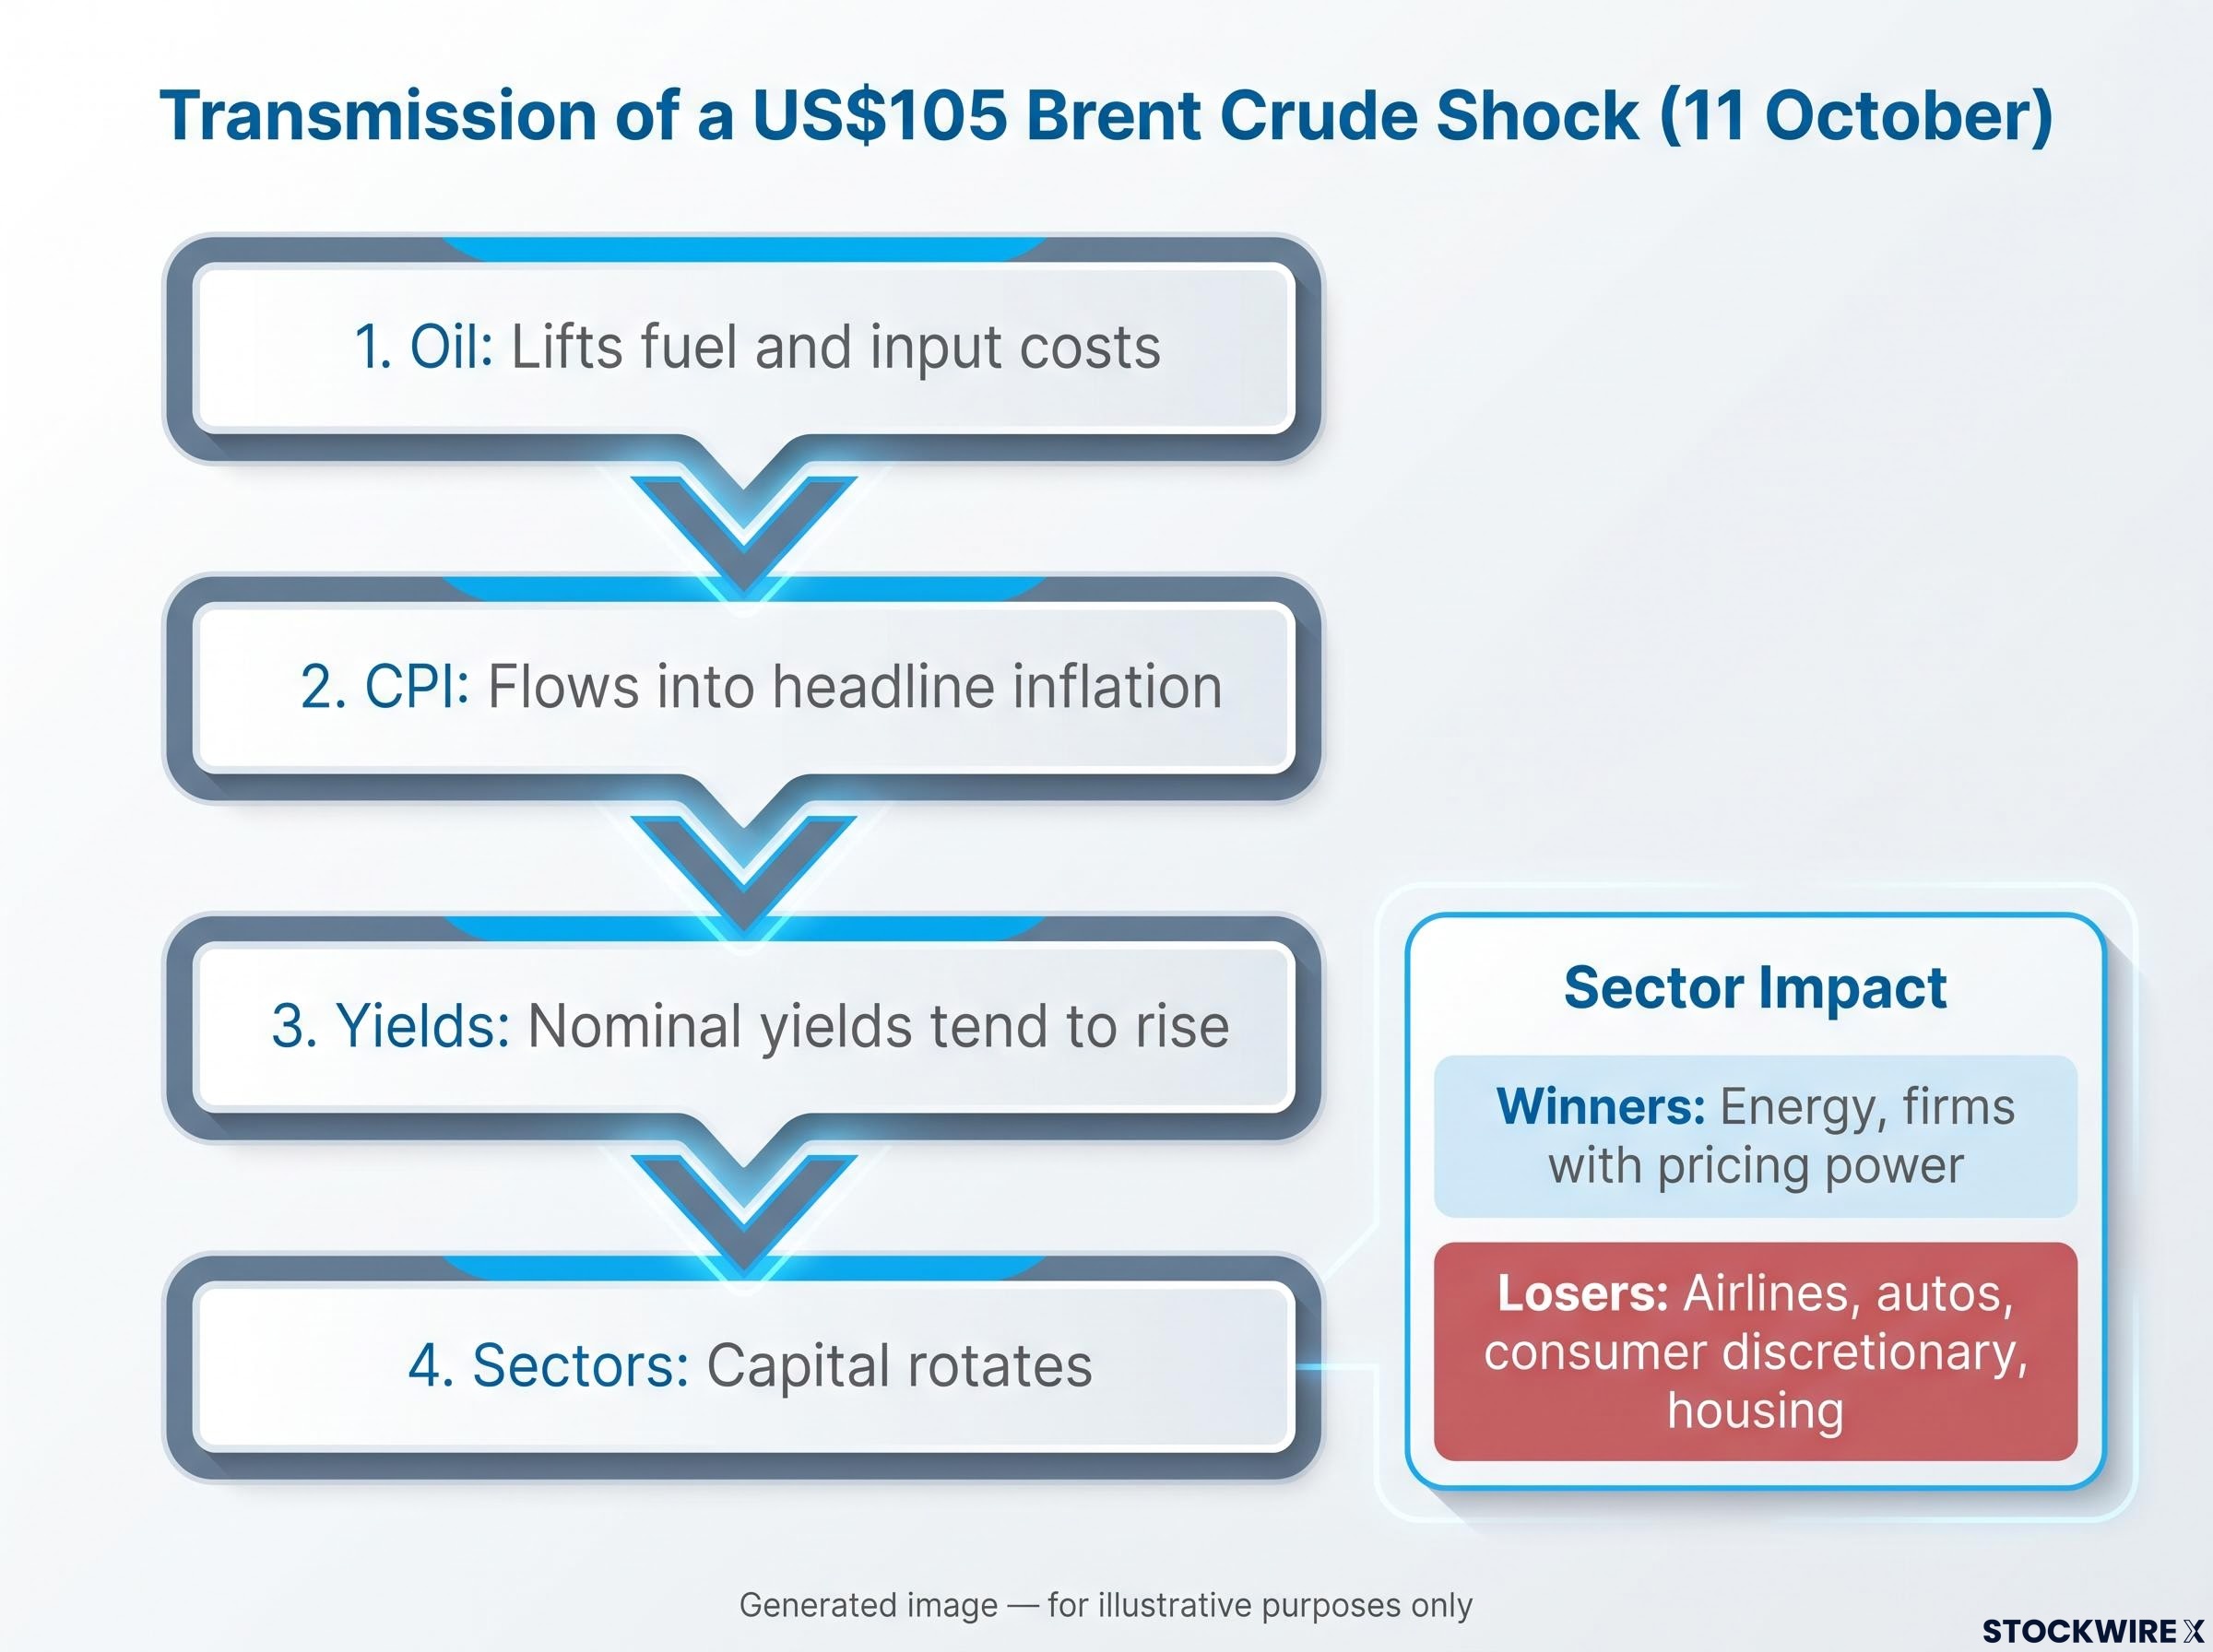
The shock moves through the economy in sequence:
- Oil: higher crude lifts fuel costs and input costs for transport-heavy industries.
- CPI: those costs flow into headline inflation and, if they persist, into inflation expectations.
- Yields: nominal yields tend to rise, especially at the long end. Policy uncertainty can also push up the term premium.
- Sectors: capital rotates towards businesses that can absorb or pass on the cost.
Commentators point to 1973-74, 1979-80, 1990, 2008 and 2022 as reference points. The pattern held across those episodes: the outcome depends on where inflation and policy started. With inflation above target and policy tight, an oil shock has usually weighed on risk assets.
| Group | Sectors | Reason |
|---|---|---|
| Winners | Energy, firms with pricing power | Revenue rises with prices, or costs pass through to customers |
| Losers | Airlines, autos, consumer discretionary, housing | Fuel costs and higher rates squeeze margins and demand |
| Defensives | Staples, healthcare | Demand holds up regardless of the cycle |
The September CPI release on 14 October is the first hard test. August headline inflation was 3.4%. Forecasts from Barclays and Morgan Stanley put September at roughly 3.3-3.7% year on year, with a monthly rise of about 0.58-0.62% driven by energy and core inflation near 0.24% month on month.
Inflation is already above target, so this oil shock makes rate relief less likely. This month, which sectors you hold matters more than how much index exposure you carry.
Corporate margin absorption helps explain why oil shocks first show up as earnings pressure in consumer discretionary names before they reach shelf prices, which is why sector holdings matter this month.
Can 29.6% earnings growth and a 19.1x forward P/E justify yields at 5.24%?
Against the pressure from yields and oil, the earnings data is the strongest counterweight.
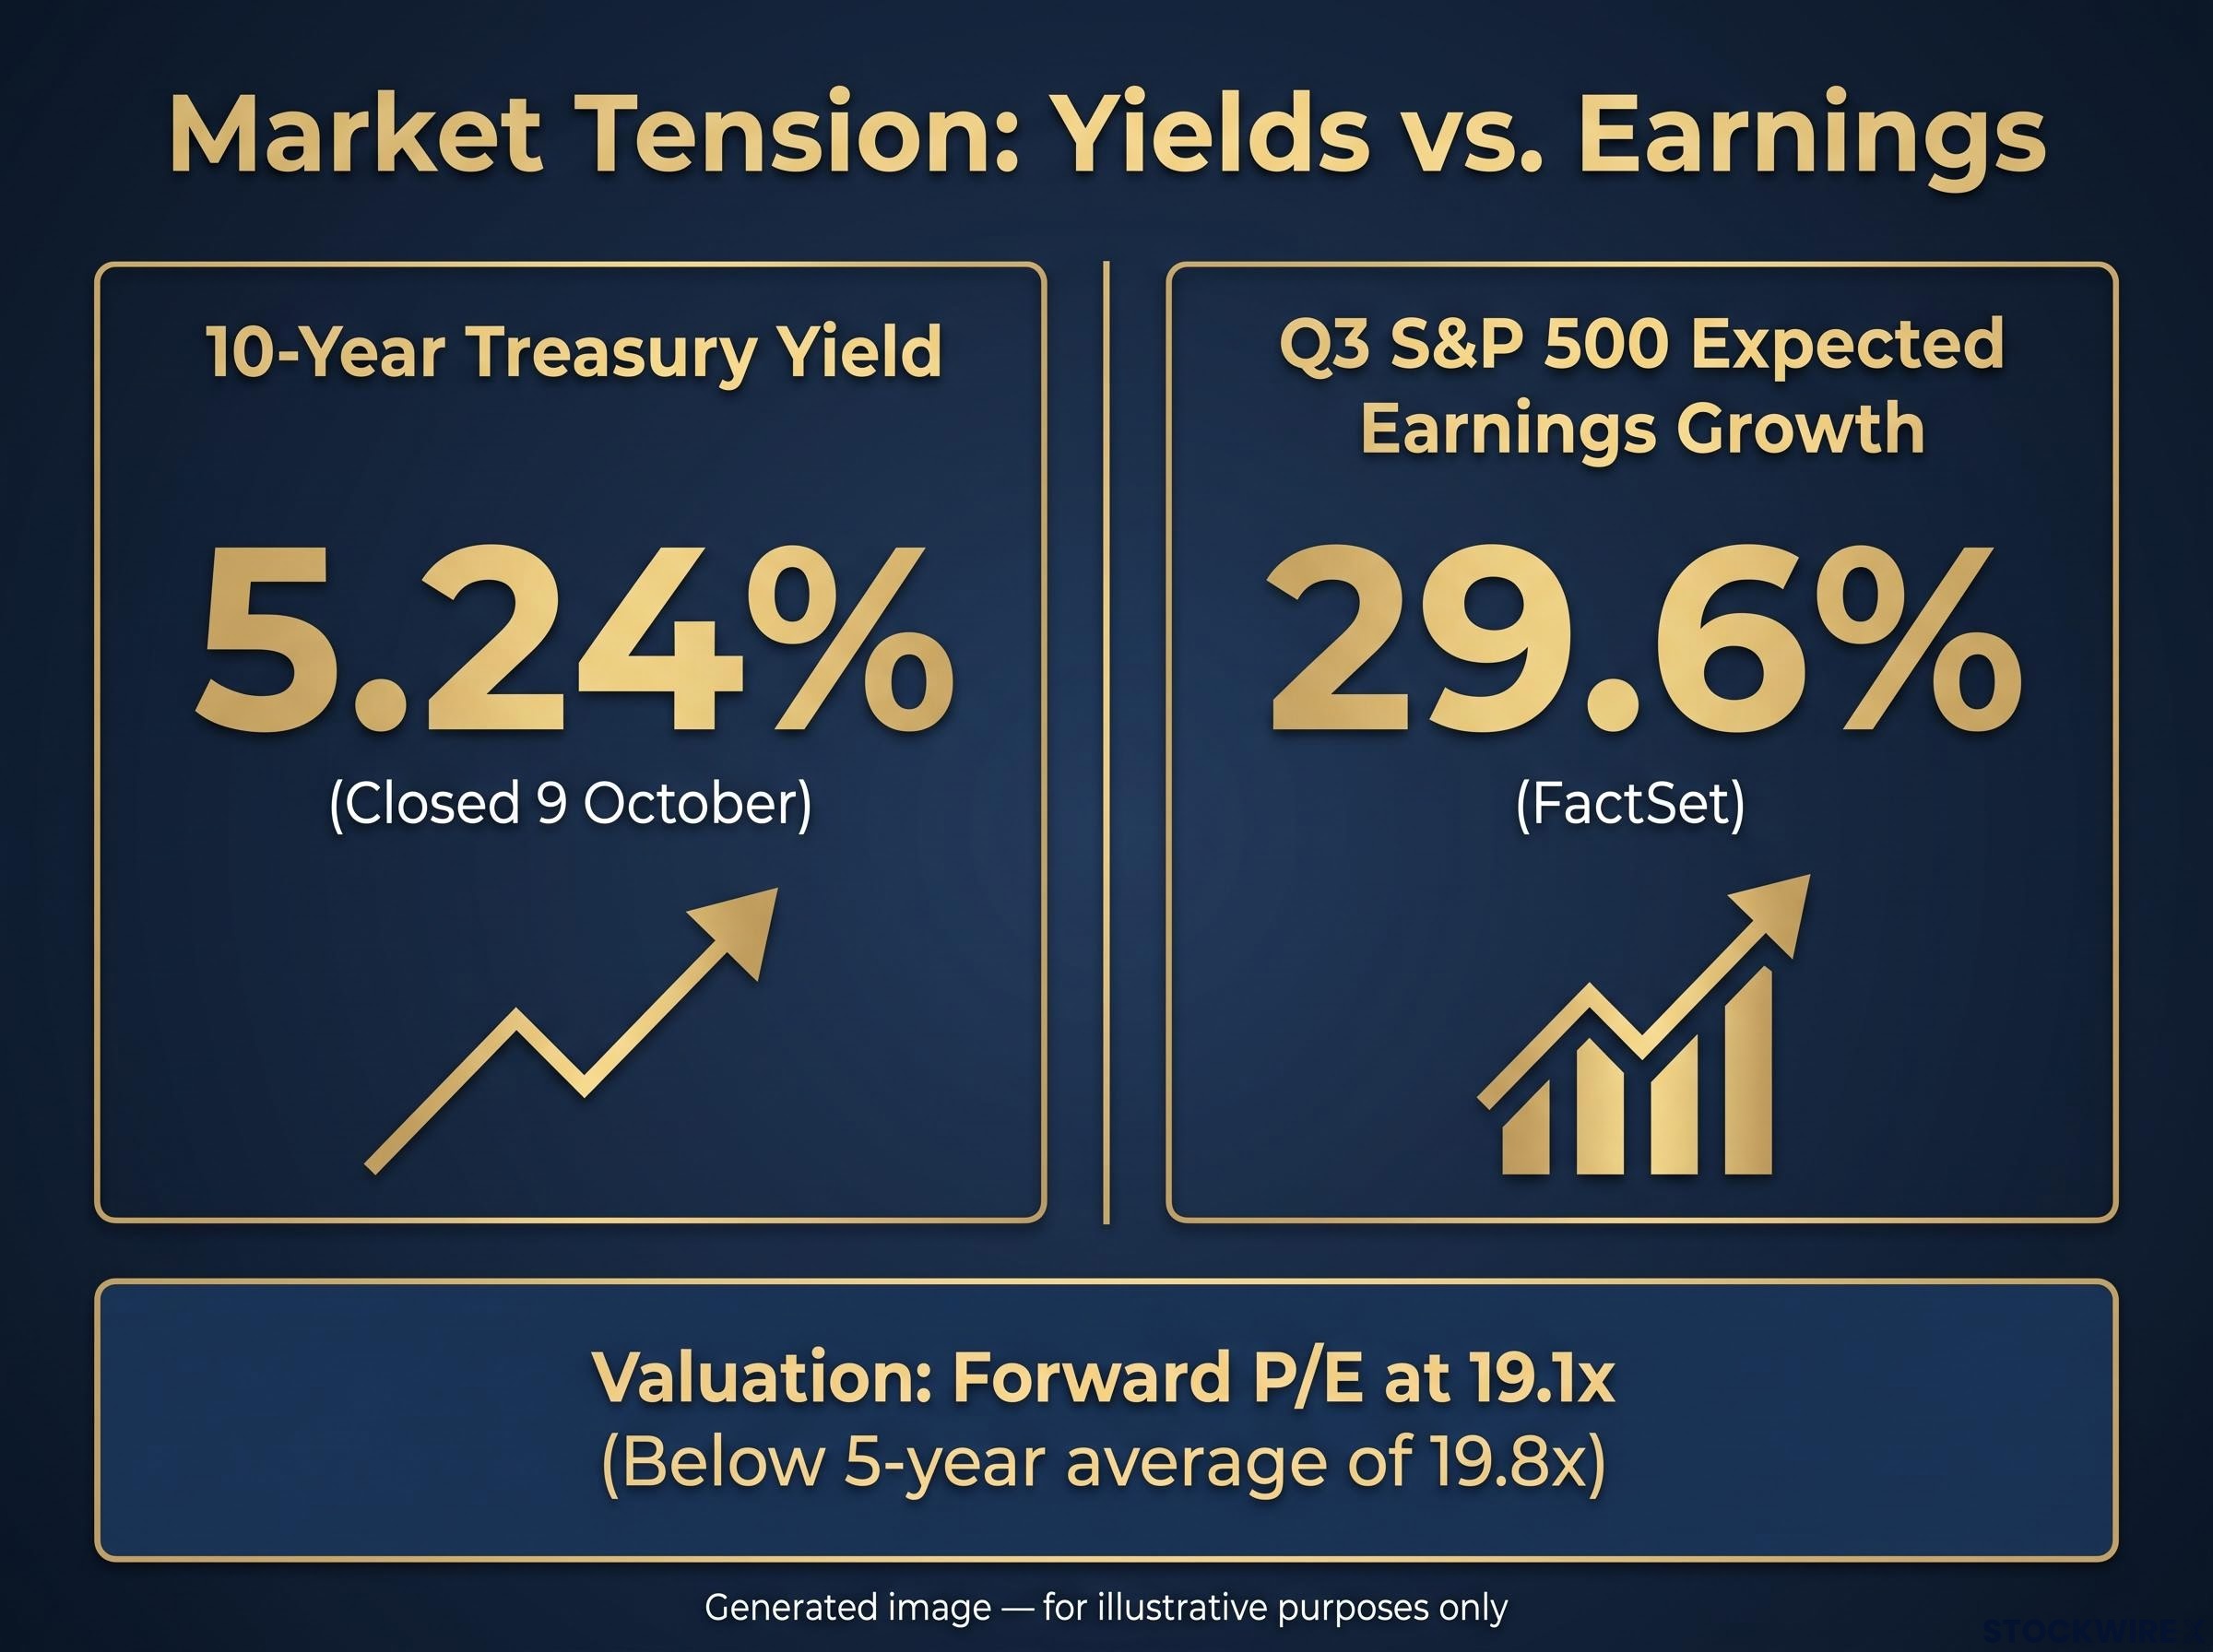
Earnings momentum FactSet expects Q3 S&P 500 earnings growth of 29.6% year on year, the third straight quarter above 25%.
The estimate has drifted higher, from 28.9% on 18 September to 29.1% on 26 September. FactSet noted on 9 October that actual growth may exceed 35%, because reported results typically beat estimates.
Valuations have not run away from that growth. The forward price-to-earnings (P/E) ratio, which is share price divided by expected earnings for the next 12 months, sits at 19.1x. That is below the five-year average of 19.8x and close to the 10-year average of 19.0-19.1x, depending on the source.
Last week’s tape reflected the mixed picture. The S&P 500 rose 1.2% and the Nasdaq 0.6%. Technology fell 1.1%, while healthcare gained 2% and consumer cyclicals 3%.
| Factor | Entry point view | Warning view |
|---|---|---|
| Argument | Yields reflect strong nominal growth; valuations are not extreme | A higher discount rate compresses valuations; late-cycle risk rises |
| Who benefits | Financials, insurers, energy, materials, quality balance sheets | Holders of cash and short-dated bonds |
| Who is vulnerable | Companies without earnings support | Mega-cap growth, AI spenders, leveraged real estate and credit |
The warning camp’s risks vary in how concrete they are. Refinancing pressure in real estate and leveraged credit is a known cost at today’s rates. Questions over the durability of AI capital spending and mega-cap concentration are real but speculative until earnings show strain.
JPMorgan’s result on 13 October gives an early read. Consensus EPS sits around US$5.90-6.04 on revenue of about US$51.0-51.5 billion. Watch these lines:
- Trading revenue: a gauge of market activity and volatility
- Loan loss provisions: money set aside for bad loans, an early stress signal
- Net interest margin: the gap between what banks earn on loans and pay on deposits
Where the discount-rate pressure bites hardest
Long-duration assets, whose value depends on profits far in the future, suffer most when yields rise. That covers high-growth tech, small caps and unprofitable companies. Financials, insurers and firms with strong balance sheets sit on the other side.
Strong earnings suggest yields are being paid for by real profit growth. That cushion thins quickly for companies without earnings, so quality screens matter more than usual.
What do copper, gold and the Glencore CDI listing add to a portfolio?
Copper and gold
On Friday, copper rose 2.2% and gold 1.5% to around 4,216, with oil near US$105. They moved together that day, but they do different jobs.
Copper is pro-cyclical. Demand rises with industrial activity, and electrification and data centres add longer-term demand. It adds volatility and offers no safe haven.
Gold pays no income. A real yield near 3% raises the cost of holding it, although gold has tended to hold up during stress episodes.
| Commodity | Role | Link to real yields | Key risk |
|---|---|---|---|
| Copper | Growth and electrification exposure | Indirect, through growth expectations | Industrial slowdown |
| Gold | Stress and inflation hedge | High real yields can weigh on it | Real yields staying elevated |
| Oil | Supply-shock and inflation exposure | Feeds inflation and nominal yields | De-escalation in the Gulf |
Copper adds growth sensitivity and gold adds stress protection. They answer different questions, so treating them as one “commodity” allocation can hide what you actually own.
For readers weighing the gold and real yield trade-off, our detailed coverage of TIPS versus gold explains why breakevens near 2.25% undercut the inflation case for bullion.
The Glencore CDI explained
Glencore announced on 24 September a foreign exempt secondary listing on the ASX under ticker GLC, with first trading expected on 14 October 2026. It uses CHESS Depositary Interests (CDIs). A CDI is a unit that gives Australian investors beneficial ownership of shares in a foreign company. Each CDI equals one ordinary share and settles through CHESS, the ASX settlement system, while Glencore remains governed by foreign corporate law.
According to the company announcement, the listing involves no new shares or capital raise. The stated aims are to broaden its Australian investor base and narrow the valuation gap to BHP and Rio Tinto.
- Benefit: diversified commodity exposure, including copper, through local brokerage and retirement accounts
- Risk: earnings and dividends swing with copper, coal and oil cycles
- Risk: voting and corporate actions run through cross-border governance
- Risk: returns depend on currency moves and jurisdictional factors
CDIs are often treated as satellite positions rather than core holdings. This is educational context, not a recommendation. The ASX 200 gained 0.6% on Friday and 0.4% for the week, with insurers up 3.9%.
Key dates this week:
- 13 October: US bank earnings, including JPMorgan
- 14 October: US CPI and Glencore’s first ASX trade
- 15 October: RBA minutes and Australian jobs data
What this backdrop does and does not tell you
Today’s yields reflect a mix of cyclical strength and structural change. On current evidence, earnings growth supports the fundamentals reading. Oil-driven inflation is the variable most able to flip it.
That narrows this week’s checklist to three signals:
- JPMorgan’s trading revenue and loan provisions
- How much of September’s CPI comes from energy
- Whether Gulf tanker attacks escalate or ease
If all three hold steady, the entry-point case strengthens. If inflation surprises higher, the warning case gains ground. How you rebalance depends on your own timeframe, income needs and risk tolerance.
Forecasts and consensus estimates cited here are speculative and subject to change based on market developments and company performance. Past performance does not guarantee future results.
This article is for informational purposes only and should not be considered financial advice. Investors should conduct their own research and consult with financial professionals before making investment decisions.