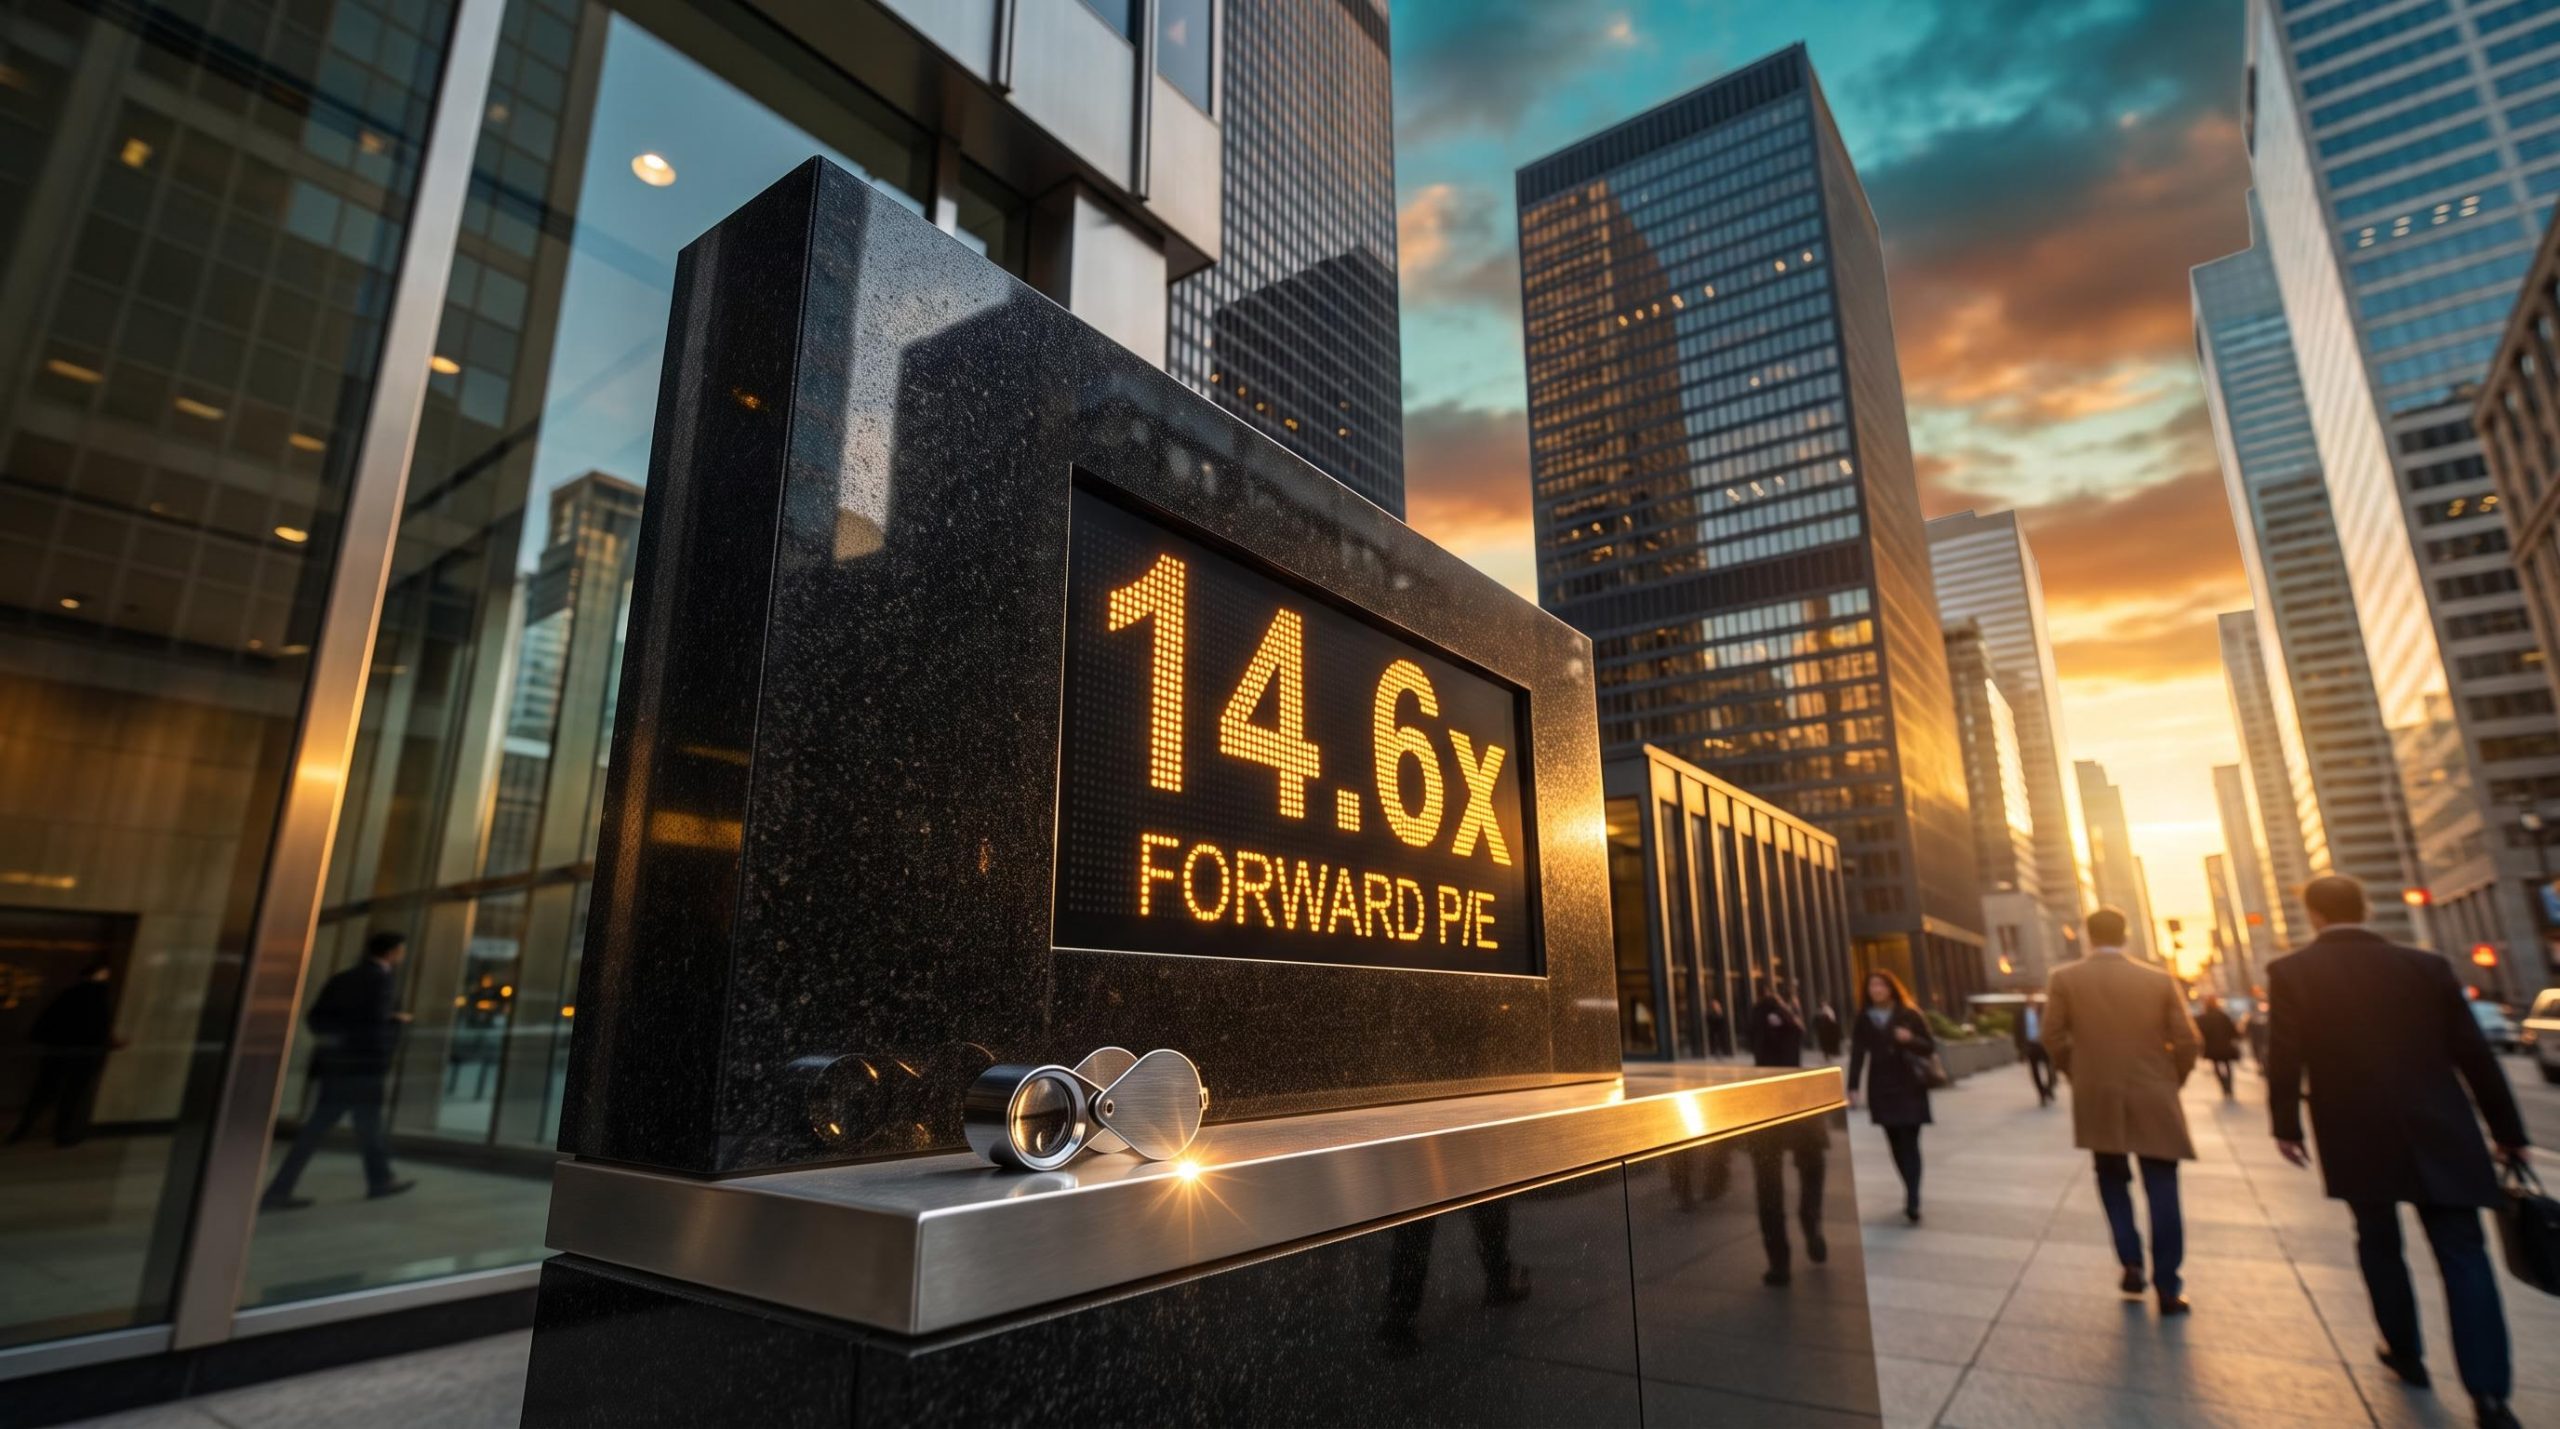
Canadian banks have beaten profit expectations for roughly six straight quarters, and their share prices have barely noticed. The earnings kept rising, but the multiple investors pay for those earnings did the shrinking. That gap matters because Canadian bank valuations started from an unusually high base: the sector’s forward price-to-earnings (P/E) ratio sits near 14.6x, against roughly 12.5x a year earlier.
The size of that number matters to anyone holding the Big Six (Royal Bank of Canada (RBC), TD, BMO, Scotiabank, CIBC and National Bank) or a bank-heavy fund. A one-point move in the multiple translates to about 7-8% in price.
The claim that today’s level is the highest in decades comes from Rob Wessle of Hamilton ETFs, citing Bloomberg data. Nobody, including Wessle, has pinned down why it happened.
Here is how to weigh the competing explanations, what the best and worst cases look like, and a test you can apply to any sector that looks stretched.
How stretched are Canadian bank valuations, really?
Where multiples sit now
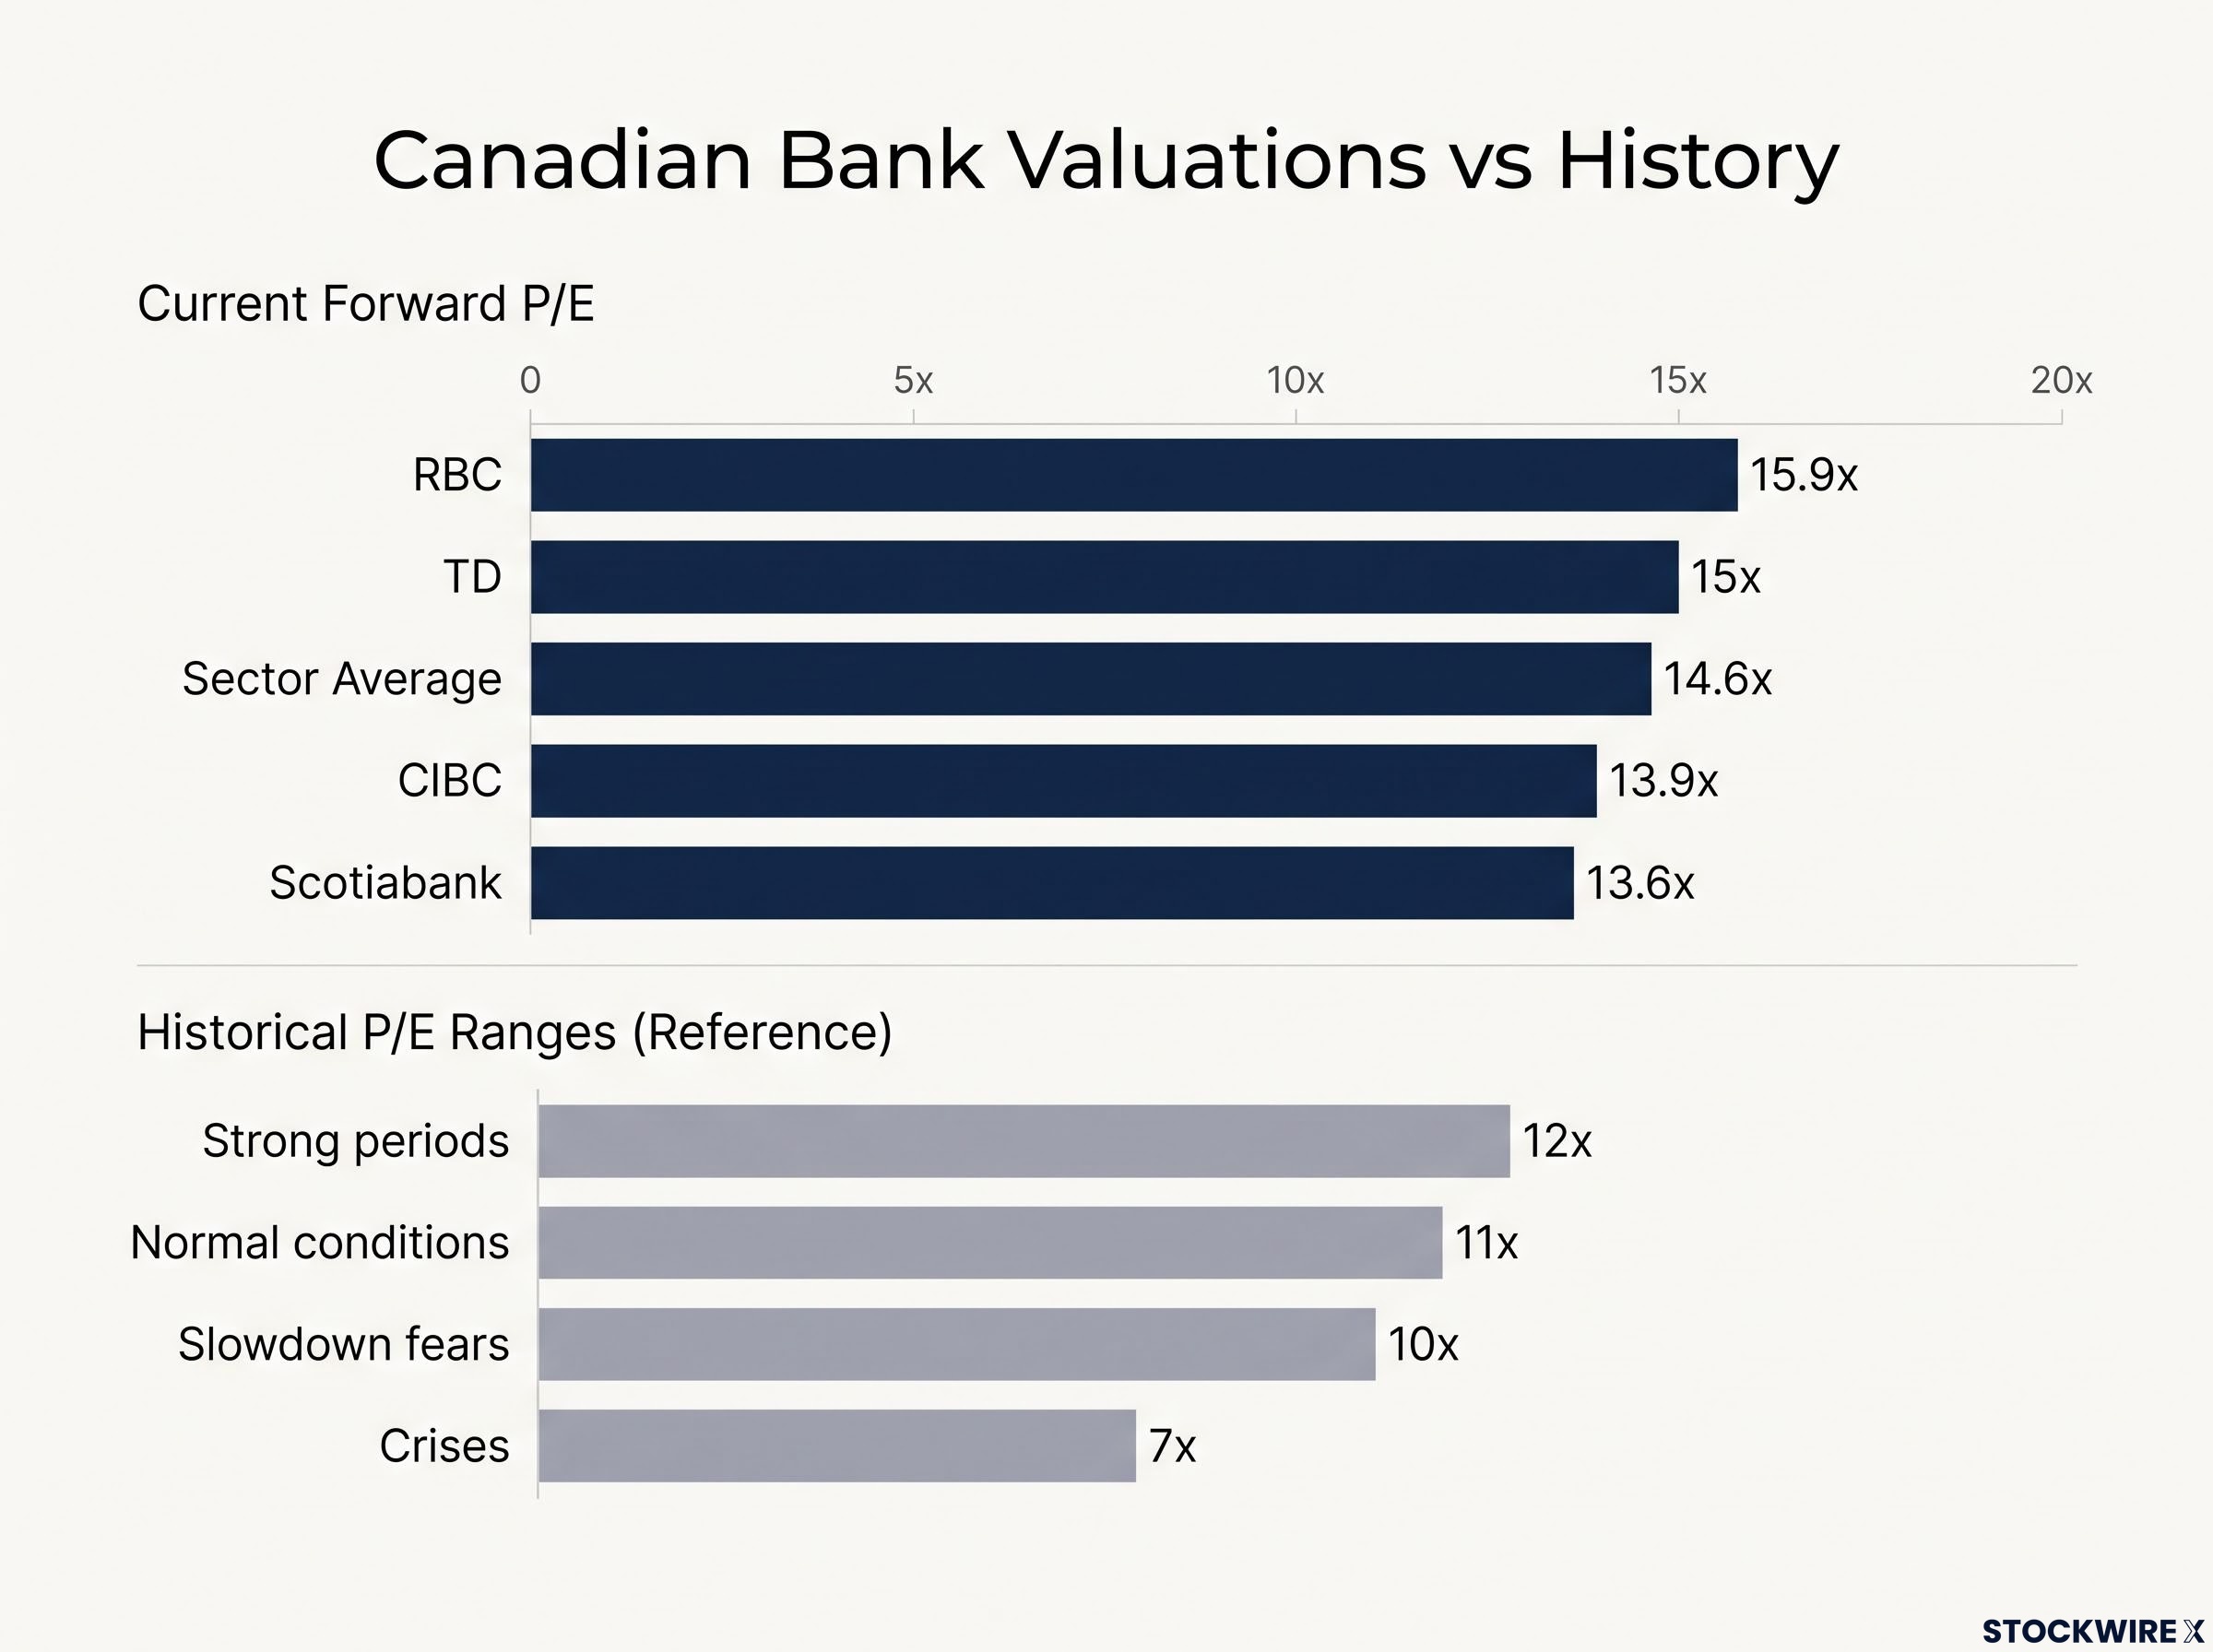
A forward P/E divides today’s share price by the earnings analysts expect over the next 12 months. On that measure, according to Wessle’s Bloomberg figures, RBC trades near 15.9x, TD near 15x, CIBC near 13.9x and Scotiabank near 13.6x. Trailing multiples, which use the past 12 months of earnings, run higher still.
| Bank | Forward P/E (next 12 months) | Trailing P/E (TTM) | CET1 ratio |
|---|---|---|---|
| RBC | ~15.9x | 17.87 | 13.5% |
| TD | ~15x | 17.77 | 14.3% |
| BMO | Not available | 19.45 | 13.0% |
| Scotiabank | ~13.6x | 16.83 | 13.1% |
| CIBC | ~13.9x | Not available | Not available |
Sources: Wessle/Bloomberg (forward); BestCanadianStocks.ca, 5 October 2026 (trailing, CET1). The CET1 ratio measures a bank’s highest-quality capital against its risk-weighted assets.
The Evolve Canadian Banks and Lifecos Enhanced Yield ETF (BANK) showed a P/E of 14.34 as of 7 October 2026, according to Investing.com. The gap between the most and least expensive banks is also new, since past differences were tiny.
Why the history matters
Wessle’s history gives the number its weight. In normal conditions, he says, banks traded around 11x forward earnings. Strong periods pushed them to about 12x, slowdown fears to about 10x, and crises such as COVID and the global financial crisis to around 7x.
A career high, on one source Wessle describes the current multiple as the highest he has seen in his career and believes it exceeds 1970s levels. Independent long-run data confirming this could not be obtained, so the claim rests on his reading of Bloomberg figures.
A slide back to 12x implies roughly 25% downside. What that gap tells you is that you are paying for growth and stability at a price history rarely supports, so your cushion against disappointment is thinner than the run of earnings beats suggests.
A stretched multiple erodes the margin of safety, because paying more for the same earnings leaves less room for error if growth or credit quality disappoints.
When big ASX news breaks, our subscribers know first
Why have multiples expanded? Five explanations, none proven
The re-rating happened in under a year, despite mediocre GDP growth and elevated unemployment. Wessle is candid that nobody knows the exact cause. Each theory has evidence, and each has a hole.
Flows and market structure
Exchange-traded funds (ETFs) are the best-evidenced driver. The Canadian ETF industry grew from about C$300B to over C$1T in roughly 25 years, and passive funds buy every day regardless of price. In earlier eras, active managers set prices and rotated out of expensive sectors.
Passive funds buy every day regardless of price, and that valuation-blind buying is mechanical: each inflow forces purchases of every constituent, which tends to push already expensive stocks higher still.
Wessle says Hamilton sees inflows on about 95% of trading days, and TradingView data show the BANK ETF drew cumulative flows of about C$396.07M over the year to 22 July 2026. Keep in mind that Hamilton sells bank ETFs, so its strategist has a commercial interest in the flow story.
Thin market breadth adds pressure. Wessle points to an “Australia effect”: with few IPOs and many foreign takeovers, Canadian investors have fewer alternatives, much as Australian banks have long commanded premium multiples. Momentum and quant funds, which ignore valuation and chase ROE and earnings growth, pile in alongside.
Earnings-side explanations
Buybacks provide steady demand. RBC alone returned C$4.0B in Q3, split between C$1.6B of buybacks and C$2.4B of dividends.
The AI argument is the most speculative. Wessle says bank CEOs have signalled potential AI expense savings of 10-20%, which would mean analysts’ estimates are too low, but no explicit CEO targets could be verified.
| Explanation | Supporting evidence | Main weakness | Reversible? |
|---|---|---|---|
| ETF and passive flows | Industry above C$1T; inflows on ~95% of days | Cited by an ETF provider | Yes, if flows turn |
| Thin market breadth | Few IPOs, foreign takeovers | Comparison not tested in detail | Slowly |
| Quant and momentum | Funds favour ROE and EPS growth | No flow data | Yes, quickly |
| Buybacks | RBC’s C$1.6B in Q3 | Only RBC figures verified | Yes, if capital tightens |
| AI savings | Reported CEO signals of 10-20% | Unverified | Depends on delivery |
No named strategist attributes the re-rating to any single driver. If flows carry much of the load, the multiple rests on demand rather than a fresh view of earnings, and it can unwind as mechanically as it built.
Do the fundamentals justify a higher multiple?
What the Q3 numbers show
The bull case has real evidence behind it. Every bank beat expectations in fiscal Q3 2026, the quarter ended 31 July 2026.
- RBC: net income C$6,024M, up 11%; ROE 17.9%; CET1 13.5%
- TD: adjusted EPS C$2.77 against C$2.45 consensus; CET1 14.3%
- BMO: adjusted EPS up 22% to C$3.96; credit loss provisions down to C$722M from C$797M
- CIBC: net income C$2.41B, up 15%
- National Bank: adjusted EPS C$3.39; CET1 13.51%; ROE reported as 16.1% or 16.8% depending on source
- Scotiabank: CET1 13.1%; provision ratio down to 52 bps
Return on equity (ROE) measures profit generated per dollar of shareholder capital, and mid-teens figures are strong for a bank. CET1 ranges from about 13.0% to 14.3%.
The watch-points sit inside the same results:
- TD’s impaired provisions in Canadian personal and commercial banking rose 19% to C$446M, with the bank citing consumer credit migration
- RBC’s provisions for credit losses (PCLs, money set aside for expected bad loans) rose 14%, though its loss ratio stayed low at 0.36%
Beats without a rally According to Wessle, banks have beaten expectations for about six consecutive quarters, yet the muted price reaction produced roughly one point of painless multiple compression.
That pairing tells you the market already expects the beats. More good news may not lift prices, while a miss could hurt them.
Structural or cyclical?
The structural case rests on an oligopolistic, regulated market, deep deposit franchises and capital well above minimums. Wessle believes these changes will keep multiples elevated.
The cyclical reading is less comforting: credit and rates look like a soft landing for now. Past re-ratings in the US and Australia often ended when credit losses surged, regulation cut returns or rates turned.
Best case, worst case: what holders must believe
The scenarios
Wessle’s best case is flat prices for 8-9 months while earnings grow into the multiple. He expects a staggered, orderly reversion rather than a fall to 12x, and says two more quarters like Q3 would largely resolve the concern.
| Scenario | What happens to earnings | What happens to the multiple | Approximate price result |
|---|---|---|---|
| Best case | Keep growing | Compresses gradually | Flat over 8-9 months |
| Orderly reversion | Hold up | Drifts lower in stages | Gradual weakness |
| Return to 12x | Intact | Falls to 12x | About 25% down |
| Worst case | Hit by macro shock or rising yields | Reverts toward 11-12x or lower | 20-30% or more down; banks lag the market |
Wessle frames these across three horizons: the past six quarters, the next 6-9 months and a five-year hold. He stresses his views are not financial advice. Past performance does not guarantee future results, and these projections are subject to market conditions and risk.
The beliefs behind holding
Holding at 14.6x makes sense only if you accept several assumptions at once:
- Earnings are resilient, and possibly underestimated if AI savings materialise
- Credit stays manageable through mortgage renewals at higher rates
- Capital stays high enough to fund continued buybacks
- Passive and quant demand persists
The triggers that could break them are concrete: rising impairments like TD’s 19% jump, bond yield spikes, trade and tariff shocks, a miss against a bar raised by six beats, and a reversal in ETF flows. The useful question is which belief you would abandon first if the data turned.
For investors tracking provisions, our deep-dive into credit stress signals explains how tightening lending standards precede wider losses.
A framework for stretched valuations, and why picking among the six is so hard
A five-step test for stretched valuations
A share’s return has two sources: earnings growth and change in the multiple. When the multiple rises, you gain now, but that gain is borrowed from future returns if it later reverts. This test separates the two.
- Compare to history. Set the forward P/E against long-run ranges, here 11x normal and 12x strong.
- Separate earnings from multiple. Ask how much of the past year’s gain came from profits versus re-rating.
- Identify the buyers. Price-insensitive passive flows can stop as abruptly as they started.
- Test credit and capital. Watch provisions and capital ratios, not just headline profit.
- Stress-test the downside. Calculate the price result if the multiple returns to its norm with earnings unchanged.
Why selection among the six is harder
Wessle argues that since the global financial crisis and the rise of algorithmic trading, macro factors and multiple changes dominate bank returns. He calls adding value by choosing a favourite three banks over 1-3 years very unlikely.
An interested view Wessle says consistently picking the best banks is now very hard, making an equal-weight ETF sensible for many investors. Hamilton sells equal-weight bank products, so weigh that recommendation accordingly.
Equal-weight funds such as ZEB (BMO), HEB/HB (Hamilton) and HBNK (Global X) track the Solactive Equal Weight Canada Banks Index. Hamilton’s weights on 24 September 2026 ranged from 17.2% (Scotiabank) to 15.9% (National Bank), and HB charges 19 bps. Cap-weighted funds lean toward the largest, most expensive names, at a time when forward multiples span 15.9x to 13.6x.
Some long-term holders with low cost bases may be locked in by tax. Whatever your situation, a concentrated bet on one or two banks is now a bet on multiples and macro rather than analysis, and you should size it that way.
The sector composition of the TSX, where financials make up roughly a third of the index, means bank multiples carry outsized weight in any Canadian equity portfolio.
What the multiple changes, and what it leaves untouched
The earnings are strong, and the price already reflects that. What remains open is whether passive flows and promised AI savings justify a premium history rarely granted. The multiple does not change the quality of the banks; it changes how much room you have if something goes wrong.
Four variables will shape the next phase:
- The next quarterly results against a raised bar
- Credit provisions at TD and RBC
- The direction of bond yields
- Whether ETF flows into bank products hold up
Run your own holdings through the five-step test, decide which beliefs you actually hold, and size positions to match.
This article is for informational purposes only and should not be considered financial advice. Investors should conduct their own research and consult with financial professionals before making investment decisions. These statements are speculative and subject to change based on market developments and company performance.