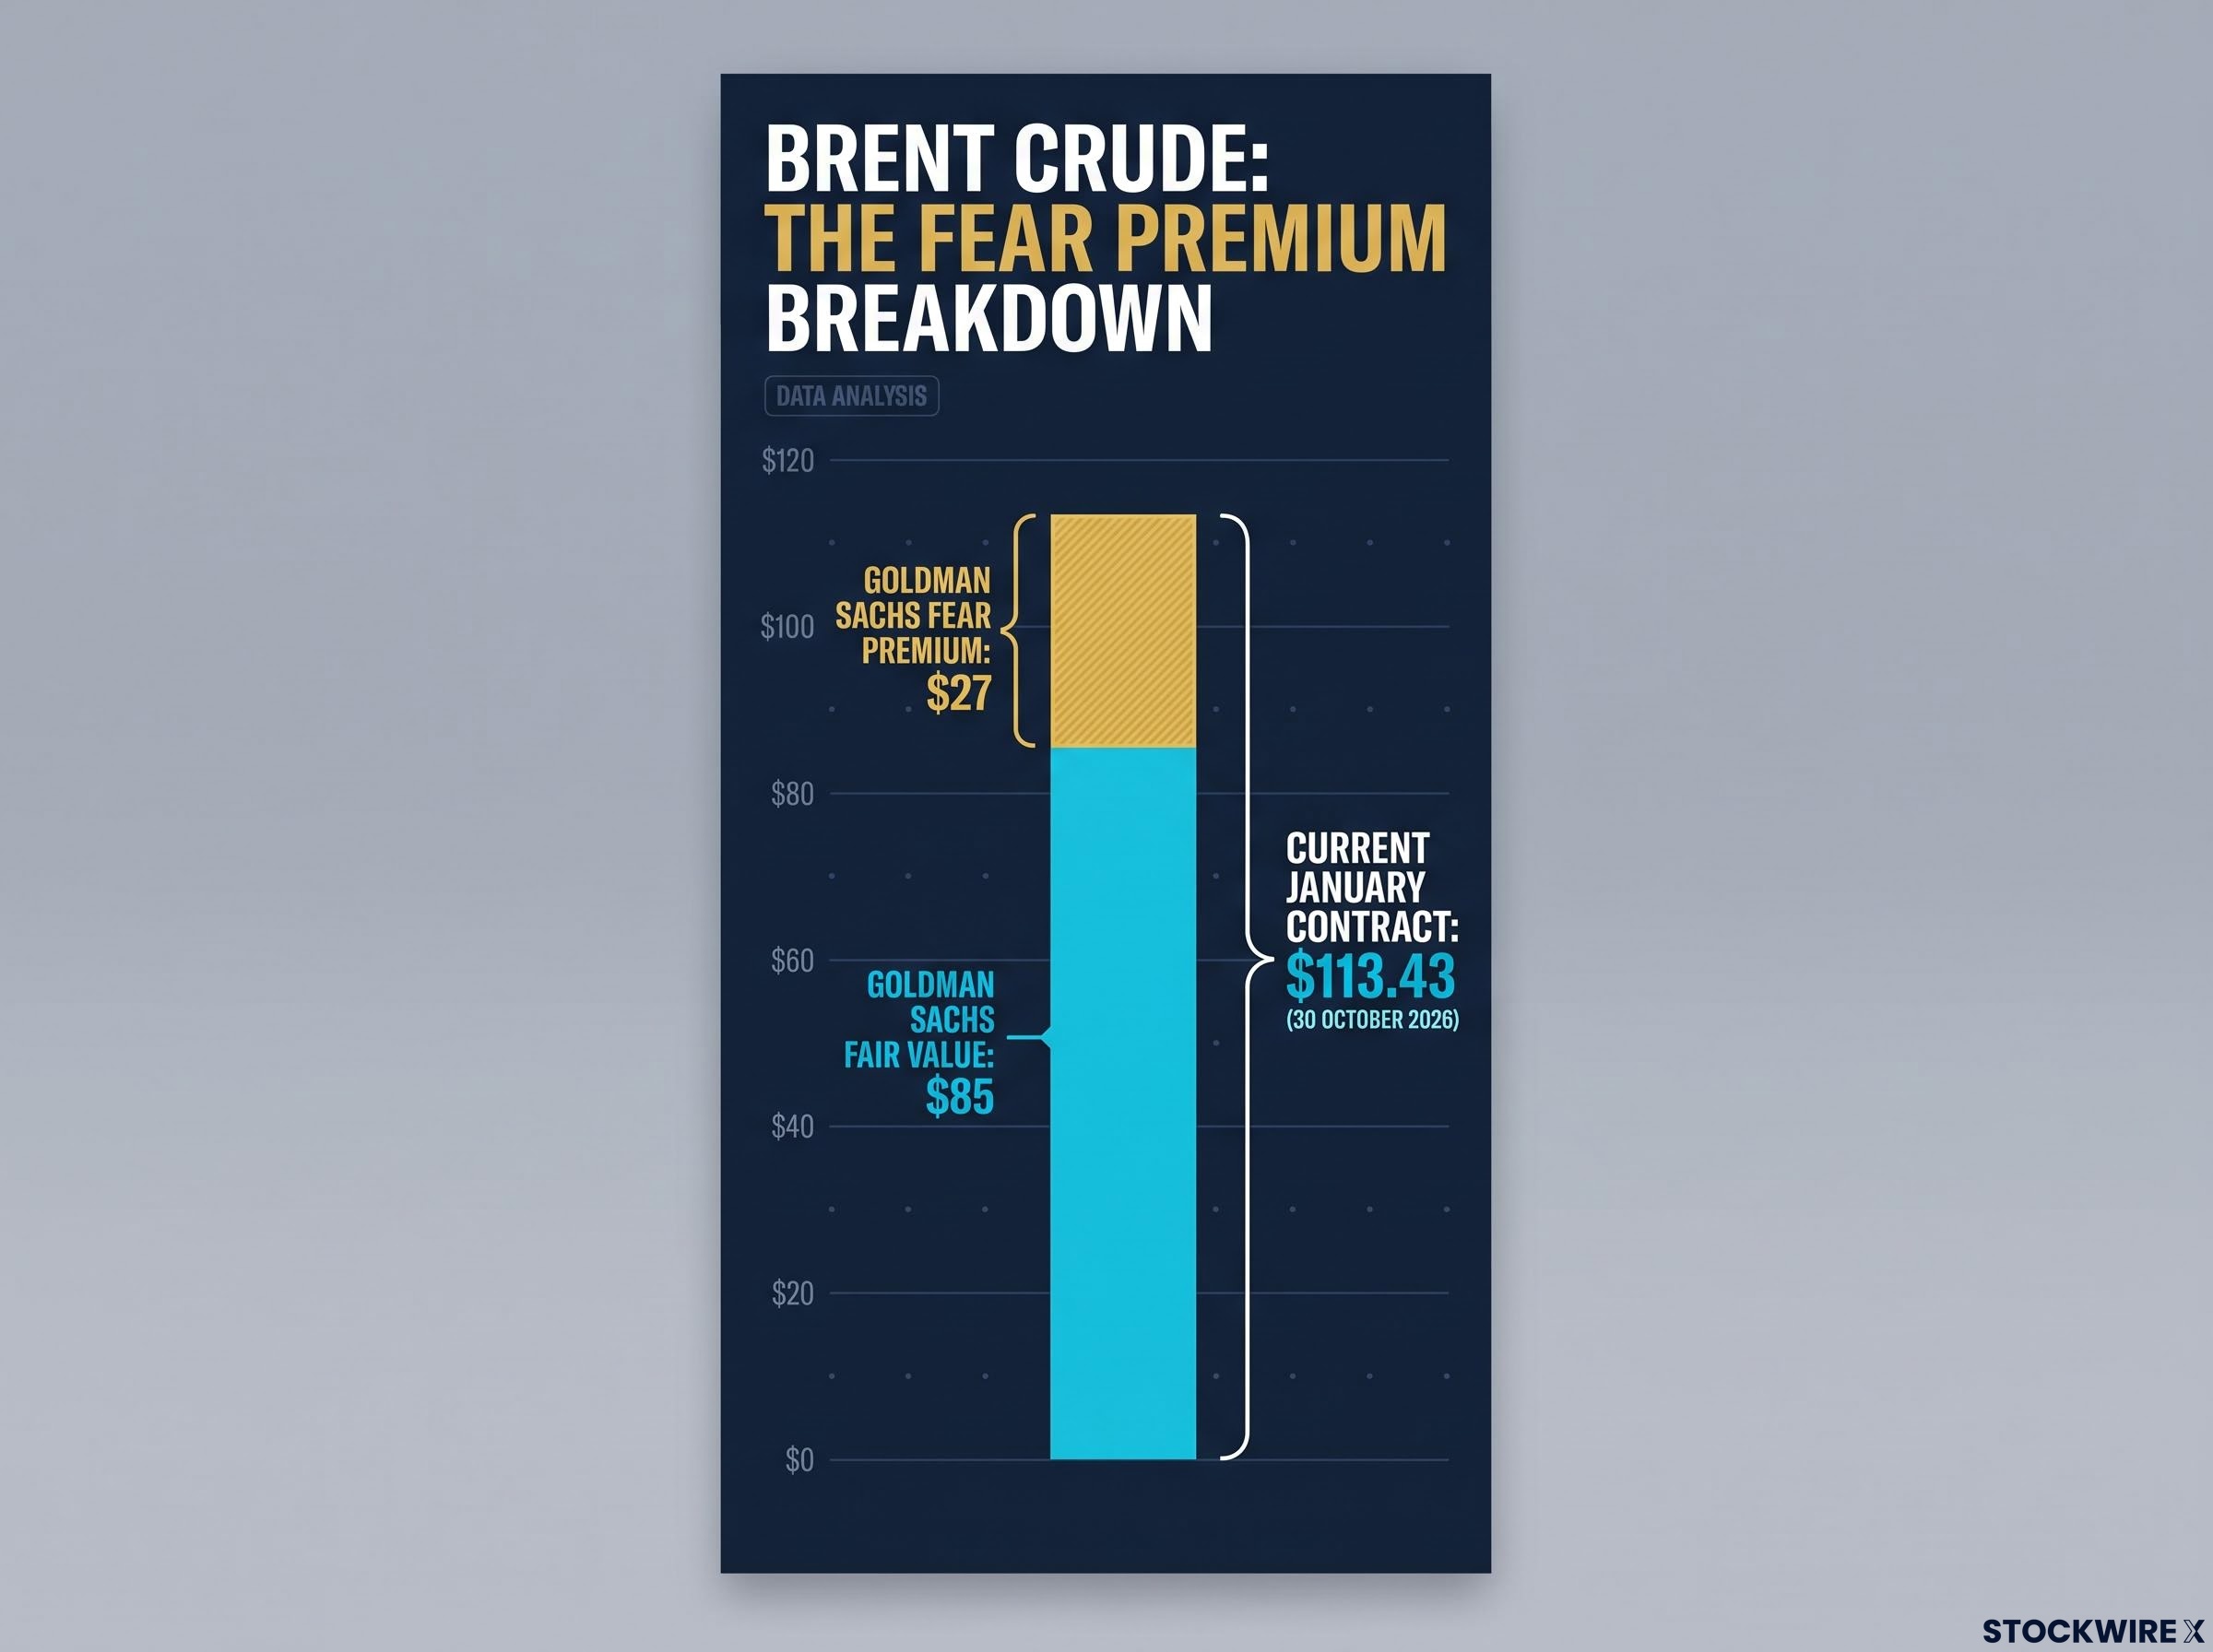
A $113 Brent crude price looks like a verdict: the world must be short of oil. Goldman Sachs reads the same number differently. Its analysts estimate that roughly $27 of every barrel is a “fear premium”, with fair value closer to $85.
If Goldman is right, much of what traders are paying for is anxiety, not missing barrels.
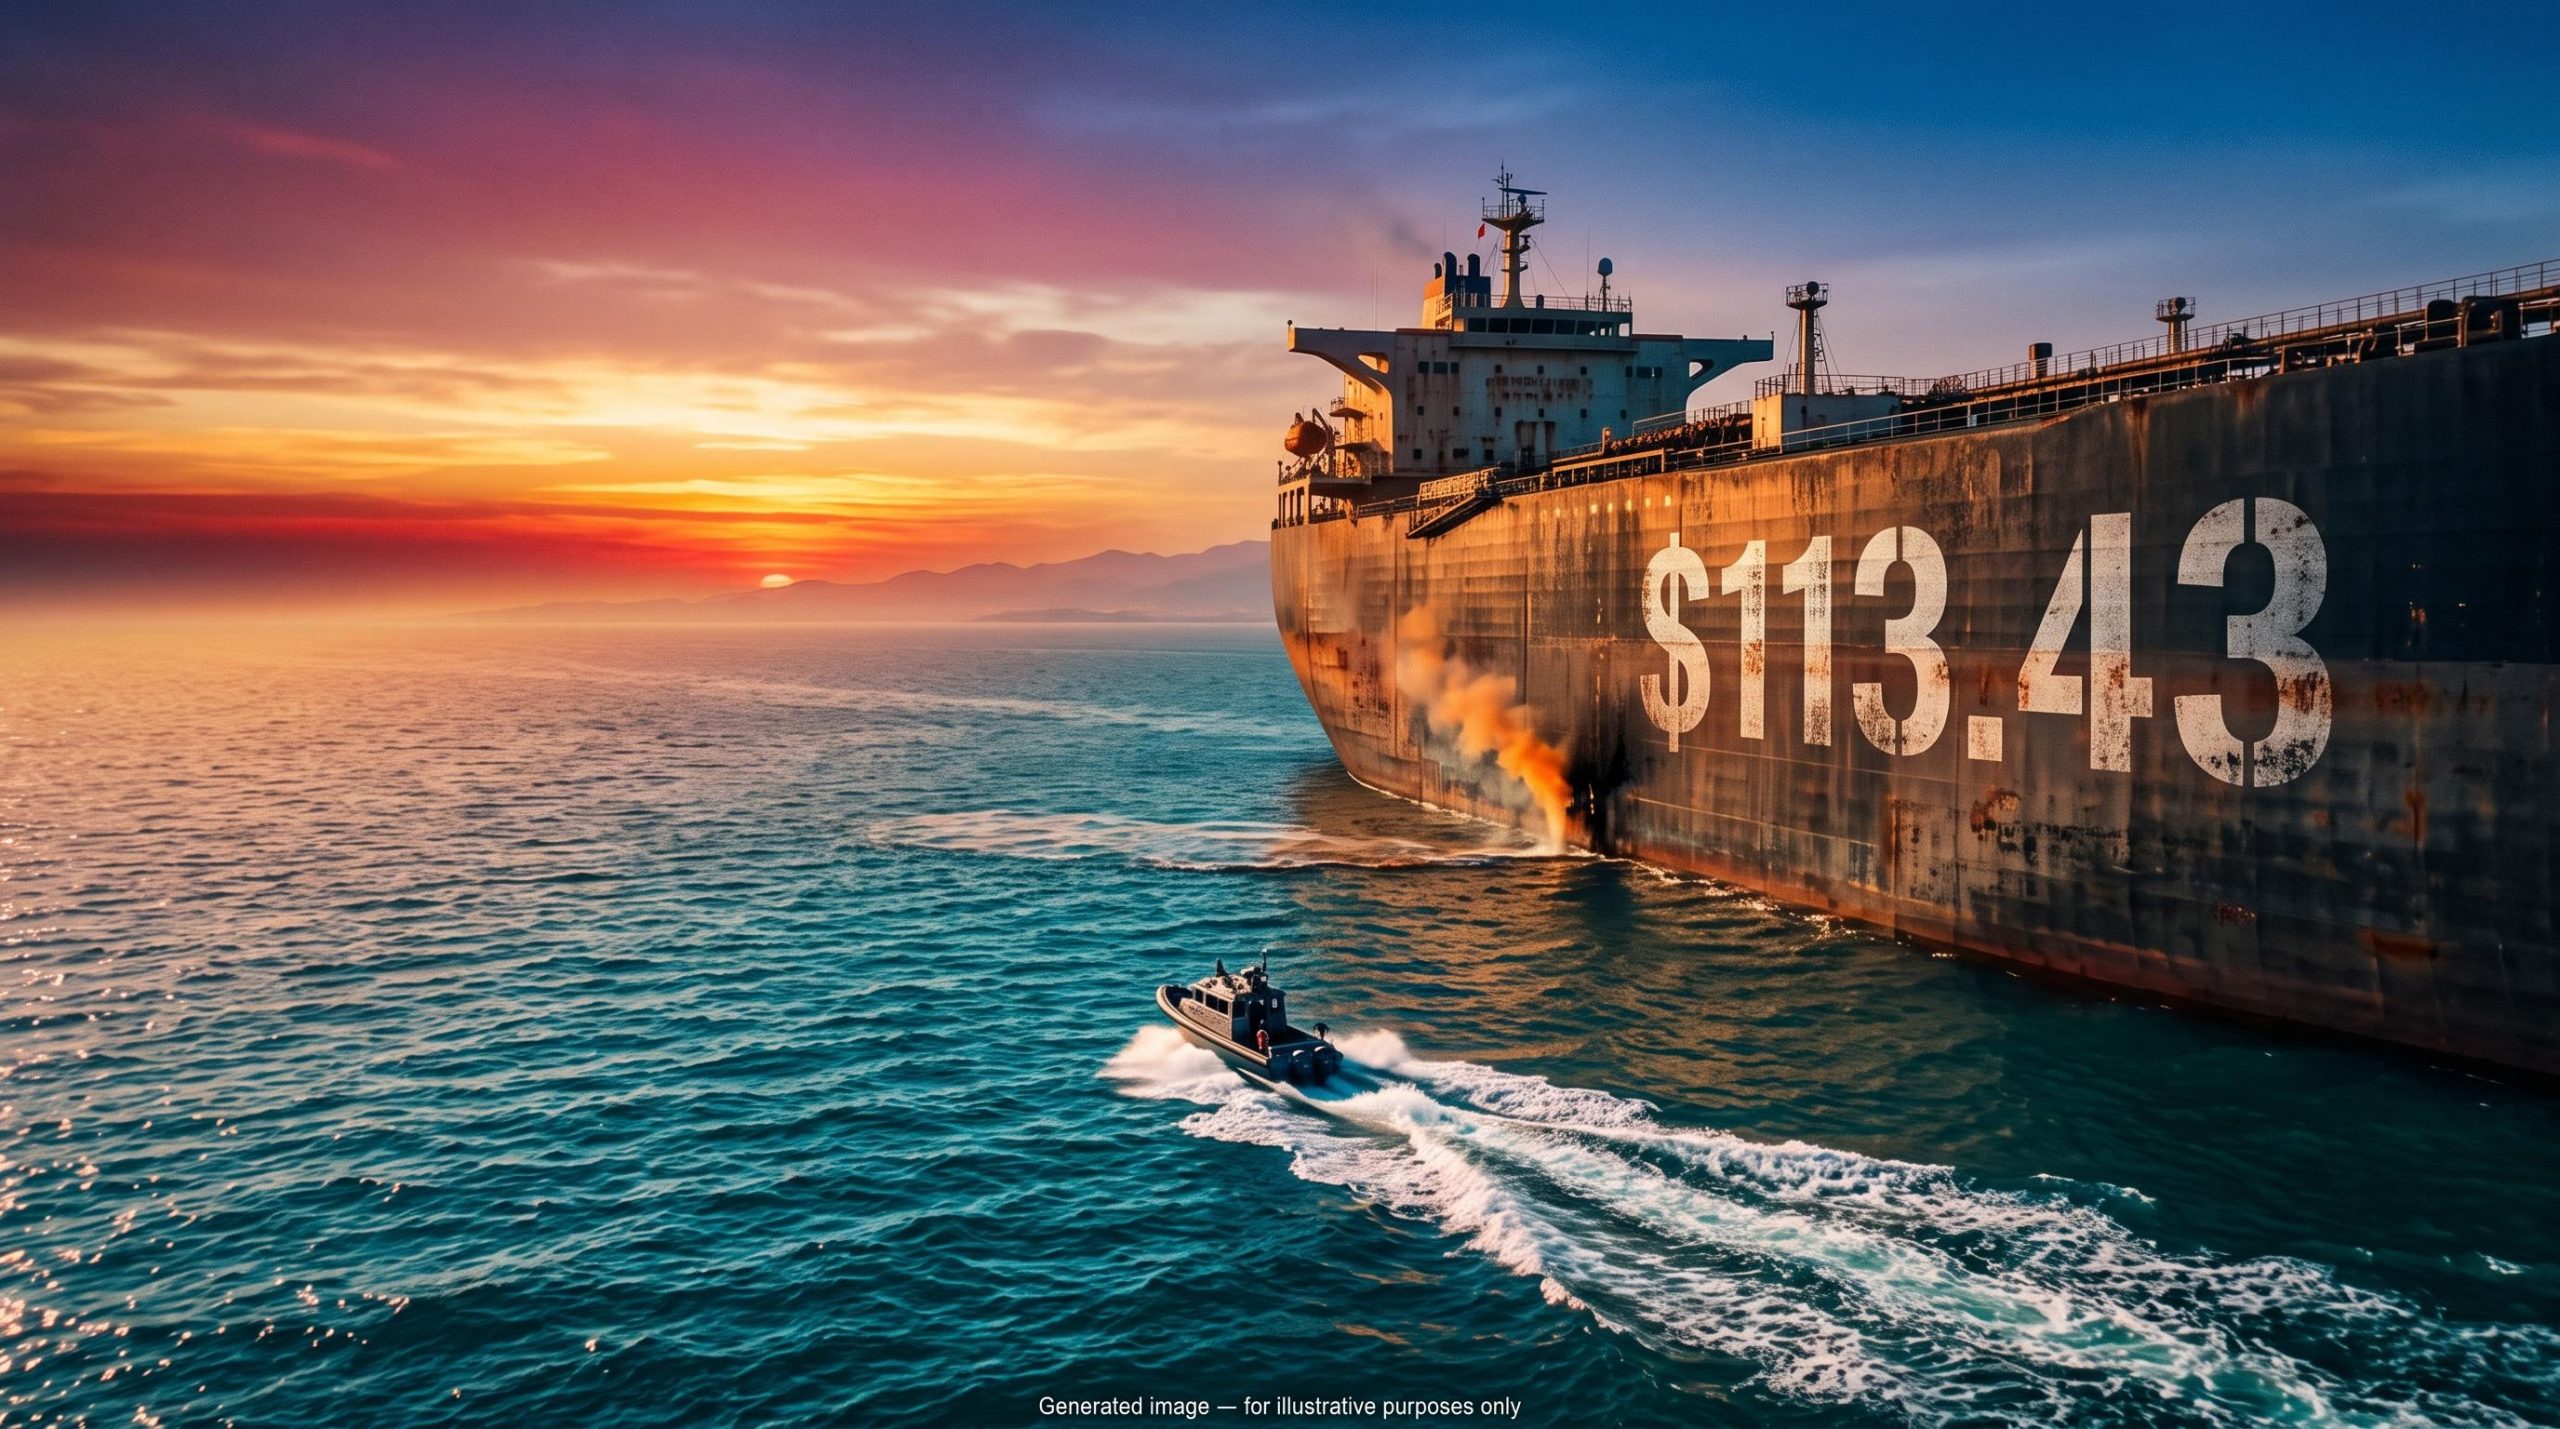
On Friday, 30 October 2026, the January Brent contract settled at $113.43 a barrel, up $2.63 or 2.37%. The move came as several risks arrived together: attacks on Gulf shipping, the prospect of renewed US-Iran conflict and Ukrainian strikes on Russian refineries. All of it landed days before the 3 November US midterm elections.
The useful question is not whether oil is expensive. It is how much of that price rests on real supply loss, and how much could disappear quickly. This analysis gives you a working method for separating the two, and for judging whether the premium holds or fades once the election passes.
What actually moved Brent on 30 October, and which contract are you reading?
Start with the headline number, because even that needs checking. Reuters reported the January contract at $113.43. It also reported the expiring December contract settling at $117.64, up $2.76, a figure that has been less firmly confirmed by other sources.
That gap of more than $4 is not a market signal. It comes from contract selection: an expiring front-month contract often trades away from the more active one behind it. When you read a Brent headline, check which contract it quotes, because a December print can look like a sharper rally than the market actually delivered.
A reliable named-source weekly percentage change was not available, so the daily settlement is the cleanest anchor.
ING analysts Warren Patterson and Ewa Manthey, alongside Reuters coverage, identified three drivers: Gulf security risk, a possible renewed US-Iran conflict and strikes on Russian refineries. The Gulf thread has been building for weeks.
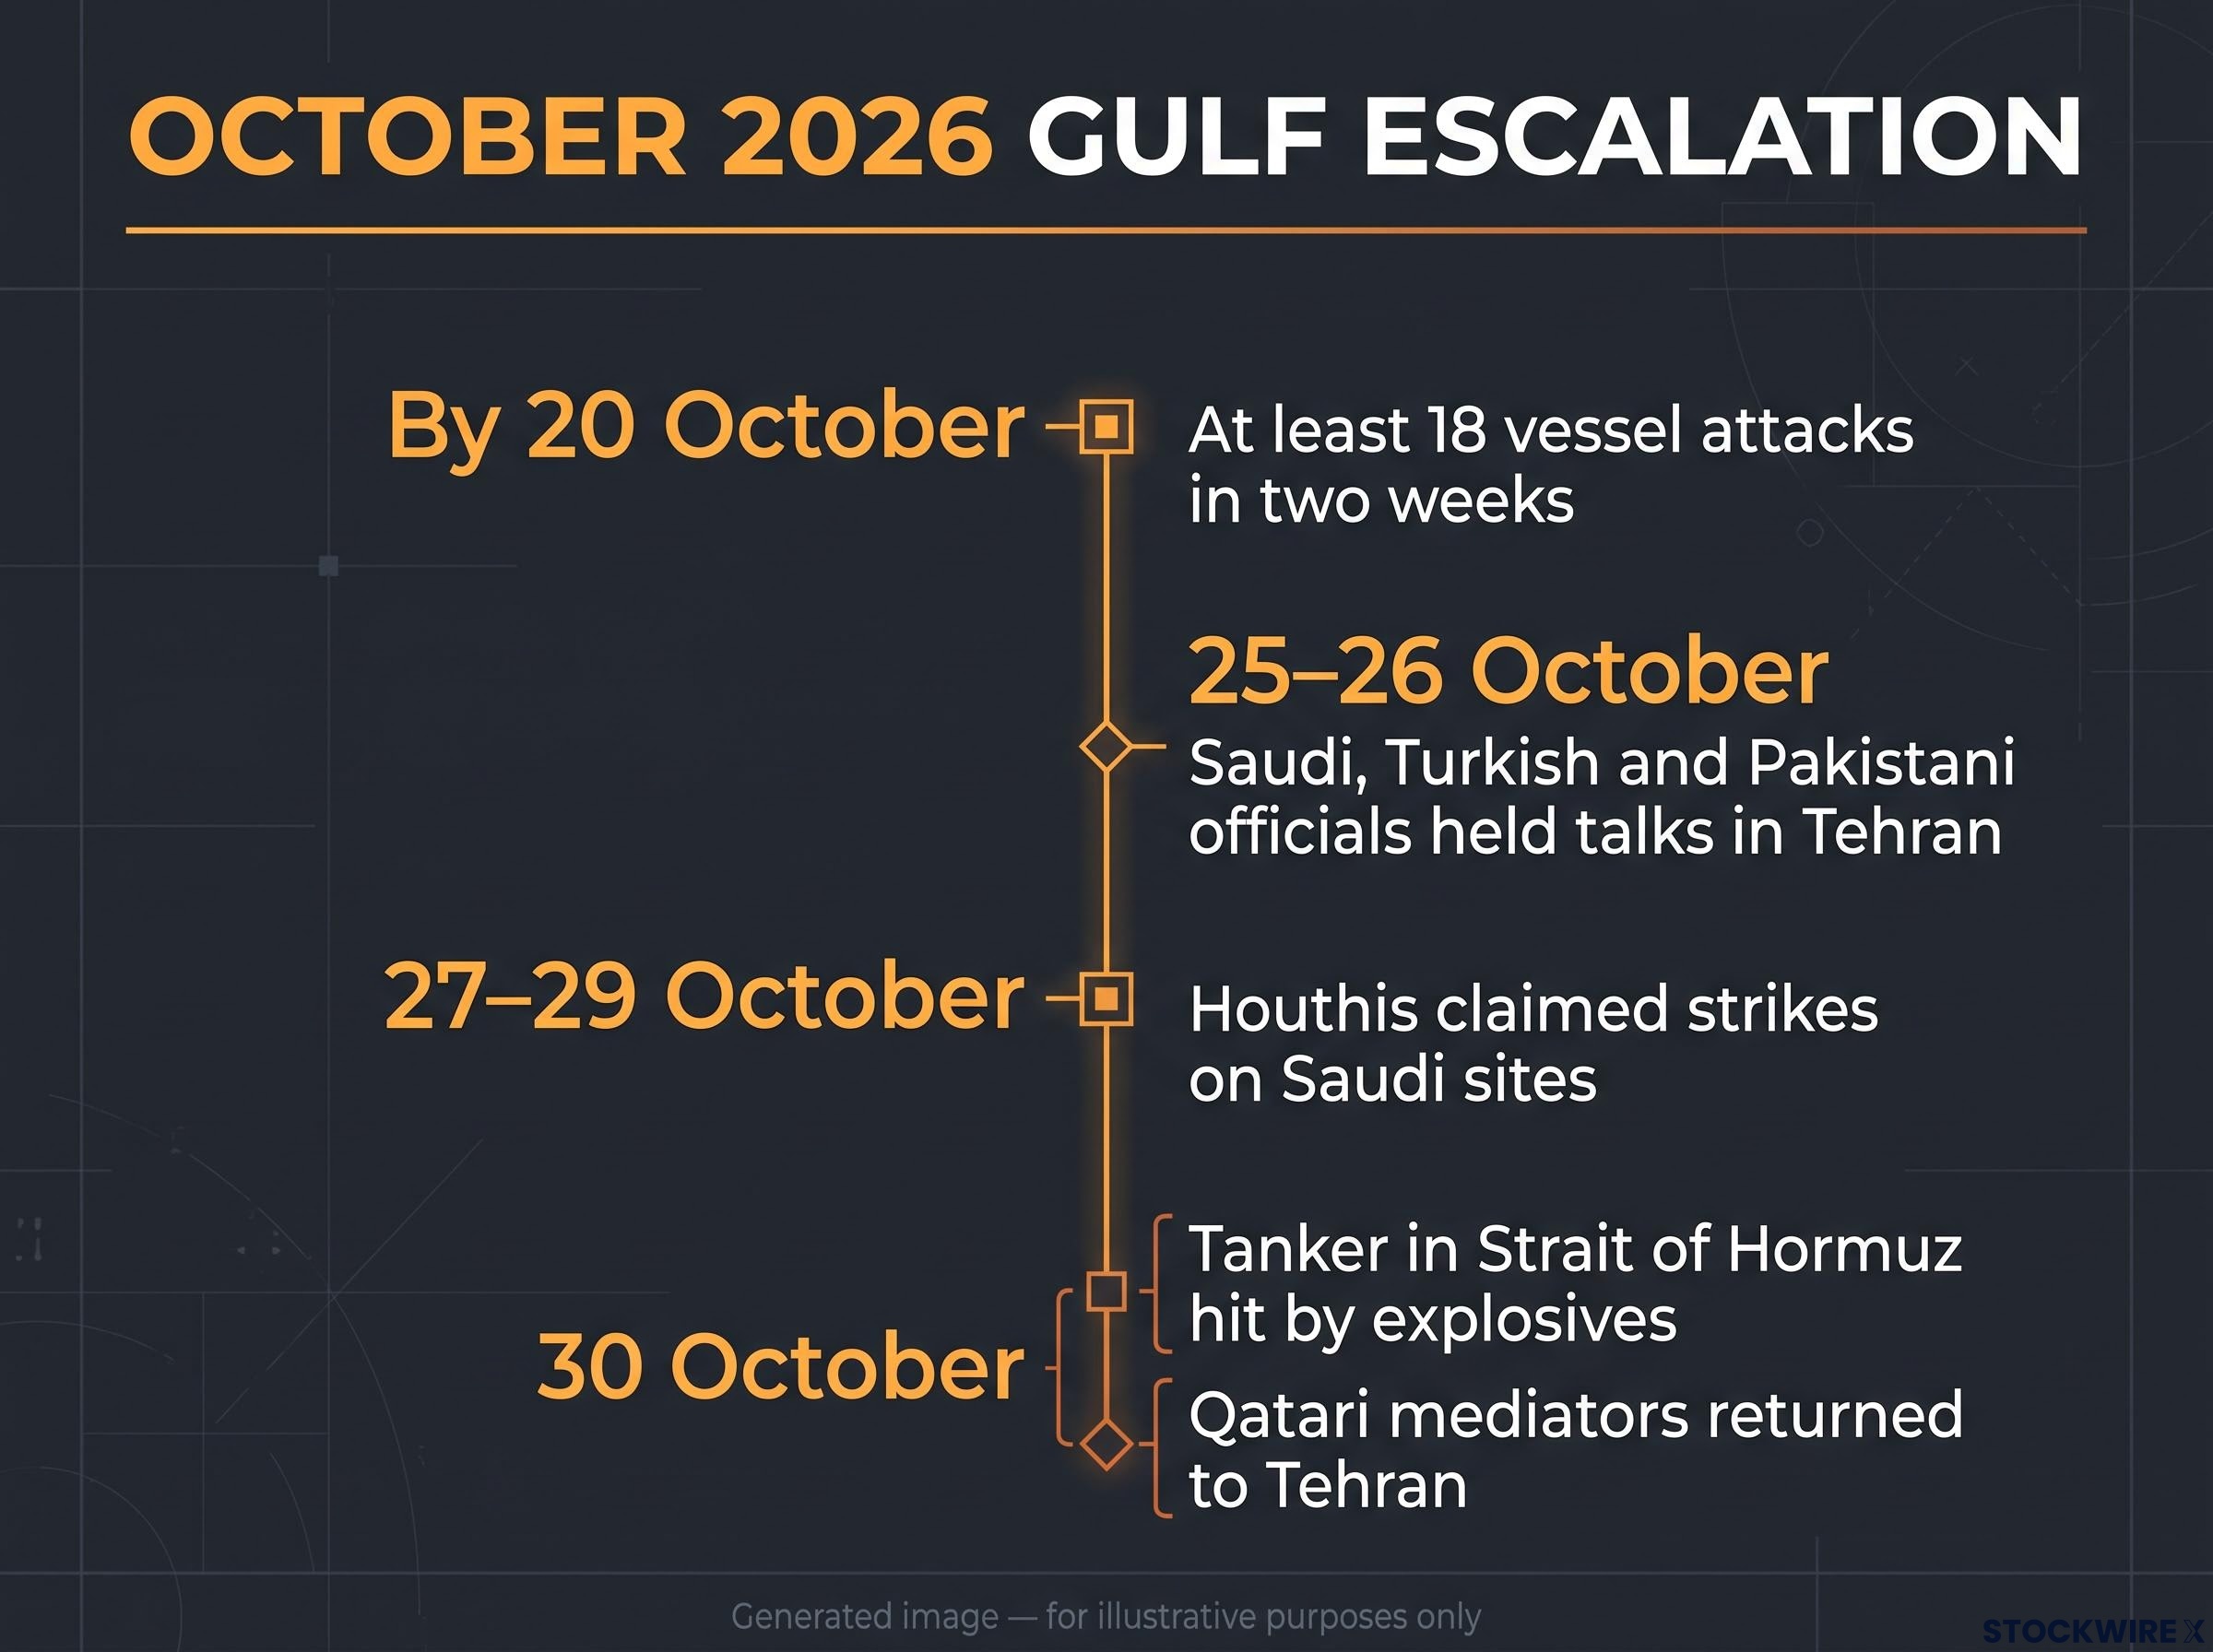
| Date | Development | Source |
|---|---|---|
| By 20 October | At least 18 vessel attacks in two weeks; LSEG said Iranian targeting had extended into the Gulf of Oman | Reuters, 21 Oct |
| 25-26 October | Saudi, Turkish and Pakistani officials held talks in Tehran | Reuters |
| 27-29 October | Houthis claimed strikes on Saudi sites including Ras Tanura (claims, not confirmed) | Reuters |
| 30 October | Tanker in the Strait of Hormuz hit by explosives attached from a small boat | Reuters / UKMTO |
| 30 October | Qatari mediators returned to Tehran seeking a US-Iran agreement | Reuters |
The Friday incident is the one that matters most.
The sharpest escalation: According to UK Maritime Trade Operations (UKMTO) and Reuters, the 30 October attack was the first known successful limpet-mine strike in the Strait of Hormuz since the US-Israeli war with Iran began.
Claimed strikes on Saudi infrastructure generate headlines. A successful mine in the main exit route for Gulf crude carries far more supply-chain weight.
When big ASX news breaks, our subscribers know first
How do refinery strikes and the gasoil crack feed into crude prices?
On a trader’s screen, one number told a different story from crude. ING’s Patterson and Manthey reported on 28 October that the ICE gasoil crack had fallen toward or below $70 a barrel, its lowest since early October.
The gasoil crack is the difference between gasoil futures prices on the Intercontinental Exchange (ICE) and the Brent price. It measures how profitable it is to turn crude into diesel.
The chain linking Russian refineries to that number runs like this:
- Drone strikes knock out or threaten Russian refining capacity, cutting crude runs and diesel output.
- Traders bid up gasoil, and replacement cargoes travel further, lifting diesel prices.
- The crack widens, signalling diesel scarcity.
- When strikes pause, Russian refineries ramp up again.
- Diesel supply returns, anxiety eases and the crack narrows.
Step five is what October delivered. Reuters reported on 27 October that Russian refineries raised crude processing by 25% in the second half of the month after attacks stopped, with diesel output up at least 50,000 tonnes a day to about 225,000 tonnes (roughly 1.7 million barrels a day).
That tells you the diesel market is easing on recovering supply. A crude rally that ignores this is leaning on geopolitics, not on product scarcity.
Crude and products can diverge sharply: Hormuz crude flows have recovered to roughly 85% of baseline by one estimate, yet refined-product shortages keep diesel costly, which is why the gasoil crack is worth watching separately from Brent.
Why the strike timeline is still unclear
The pause had already been broken once: Ukraine hit the Ryazan refinery on 15 October after a short energy ceasefire. What happened next depends on whom you read.
ING says attacks resumed late in the week ending 30 October after a pause of about two weeks. Reuters, citing the Wall Street Journal, reported that strikes had been paused again after pressure from President Trump, possibly until after the midterms. No crack level after any confirmed resumption has been published, so treat strike status as a live variable rather than a settled fact.
What do speculative net-long positions tell you about the rally?
A net-long position is the number of contracts speculators hold betting on higher prices, minus those betting on lower prices. When it grows, more money is leaning one way, which can amplify a move in either direction.
Two sources give slightly different readings for the week to 20 October:
- ING: net long up 3,576 lots to 245,457 lots, against a year-to-date high of about 430,000 lots in March (an ING figure not independently confirmed).
- Engine, citing ICE Futures Europe (28 October): more than 241,000 net-long lots, with just under 9,000 lots bought and gross longs up more than 13,000.
The figures may reflect different measures, so neither should be treated as definitive. One caution: US Commodity Futures Trading Commission (CFTC) reports cover specified futures categories and are not a substitute for the full ICE Brent series.
At first glance, roughly 240,000 lots looks large. Set against March, it looks modest, barely more than half the peak. The detail beneath it is what matters.
Fresh buying, not short covering: Engine’s ICE data showed the rise came mainly from new bets on higher prices rather than traders closing out positions against the market.
Short covering ends once the shorts are gone. Fresh longs are discretionary money that can leave whenever the reason for entering fades. Reuters’ review of 2022 shows how that plays out: hedge funds built large crude positions after Russia’s invasion of Ukraine, then exited swiftly.
For you, the reading cuts both ways. There is room for more buying on a catalyst, but if the catalyst fails, expect that money to exit just as fast.
Is the geopolitical premium fair value? What Goldman, Morgan Stanley and the IEA imply
The big institutions do not agree on whether barrels are actually being lost, and their forecasts show it:
- Goldman Sachs (Daan Struyven): about a $27 fear premium, fair value near $85, and about $90 by year-end if supply normalises.
- Morgan Stanley: Q4 2026 forecast raised to $105 from $100, Q1 2027 to $100 from $95, citing costly freight and disrupted flows.
- ING (28 October): Brent near $114 as traders awaited clarity on Trump’s Iran policy after the midterms, with weaker middle-distillate fundamentals as an offset.
Past performance does not guarantee future results. Financial projections are subject to market conditions and various risk factors.
Even Morgan Stanley’s more bullish call sits below Friday’s price. The counterweights help explain why. Reuters reported Saudi crude exports rose in October despite the attacks, according to two of three ship trackers. Russian product supply is recovering, US and Chinese demand has been weak, and OPEC+ is unwinding its production cuts.
The International Energy Agency (IEA) adds a longer view: non-OPEC supply growth plus the OPEC+ unwind could more than cover demand growth through 2030. History shows how premiums built on fear tend to behave.
| Episode | What happened | Lesson |
|---|---|---|
| Abqaiq, September 2019 | Brent jumped from about $60 to nearly $70, then faded | Dramatic attacks decay once output is restored |
| Russia-Ukraine, 2022 | Large speculative positions built, then unwound quickly | Liquidation can match the original buying |
| Israel-Iran, June 2025 | Brent hit about $74 on Hormuz fears with Iranian flows unaffected (IEA) | A ceasefire can restore fundamentals fast |
The pattern is uncomfortable for anyone treating $113 as a fundamental price. If you are weighing oil exposure, the precedents say a premium survives only while barrels or shipping lanes stay genuinely threatened, so watch flows rather than headlines.
The IEA has projected a two-year supply chain recovery even under a best-case resolution, which suggests the Hormuz risk premium tends to decompress slowly, a point worth weighing against the fast unwind that history seems to imply.
Educational primer: how to read oil signals around a geopolitical event
Each signal covered so far can mislead you on its own. Used together, they form a quick checklist for the next oil headline:
- Price level: Brent at $113.43 shows how much risk traders are paying for, not why.
- Contract choice: confirms whether a headline quotes the expiring or the active month.
- Gasoil crack: near $70, it shows whether refined products are actually scarce.
- Positioning: above 241,000 net-long lots, it shows how much speculative money could leave.
- Physical flows: export and tanker data show whether barrels are really missing.
- Diplomacy: Reuters reported that oil fell on 27 October when diplomatic hopes outweighed escalation fears.
Then compare the total against an anchor such as Goldman’s $85 fair value.
Timing matters too. Reuters has observed that many major conflict developments in this crisis have occurred on weekends, which keeps traders cautious into Friday sessions.
Reading the premium after 3 November: what to watch before you decide
Friday’s price blends three things: genuine shipping risk, fear and fresh speculative money. Each fades at a different speed. The midterms have not yet happened, and no outcome is assumed here. The vote may bring clarity on US-Iran policy, but it does not guarantee a resolution.
Persistence would look like escalation, more Hormuz attacks or a mining campaign, which could support Morgan Stanley’s $105 case. An unwind would look like a credible ceasefire, normal tanker traffic and recovering Russian output, which would move prices toward Goldman’s $85-$90 range.
Even a credible ceasefire may not mean quick supply normalisation, with Saudi Aramco’s chief having warned that a return to normal flows could stretch into 2027, which tempers how fast any unwind might run.
- Tanker incidents: repeats point to persistence.
- Qatari mediation: progress points to unwind.
- Gasoil crack: widening signals real product stress.
- Net longs: sharp falls signal fresh money leaving.
- Ukrainian strikes: resumption tightens diesel supply.
These statements are speculative and subject to change based on market developments.
This article is for informational purposes only and should not be considered financial advice. Investors should conduct their own research and consult with financial professionals before making investment decisions.