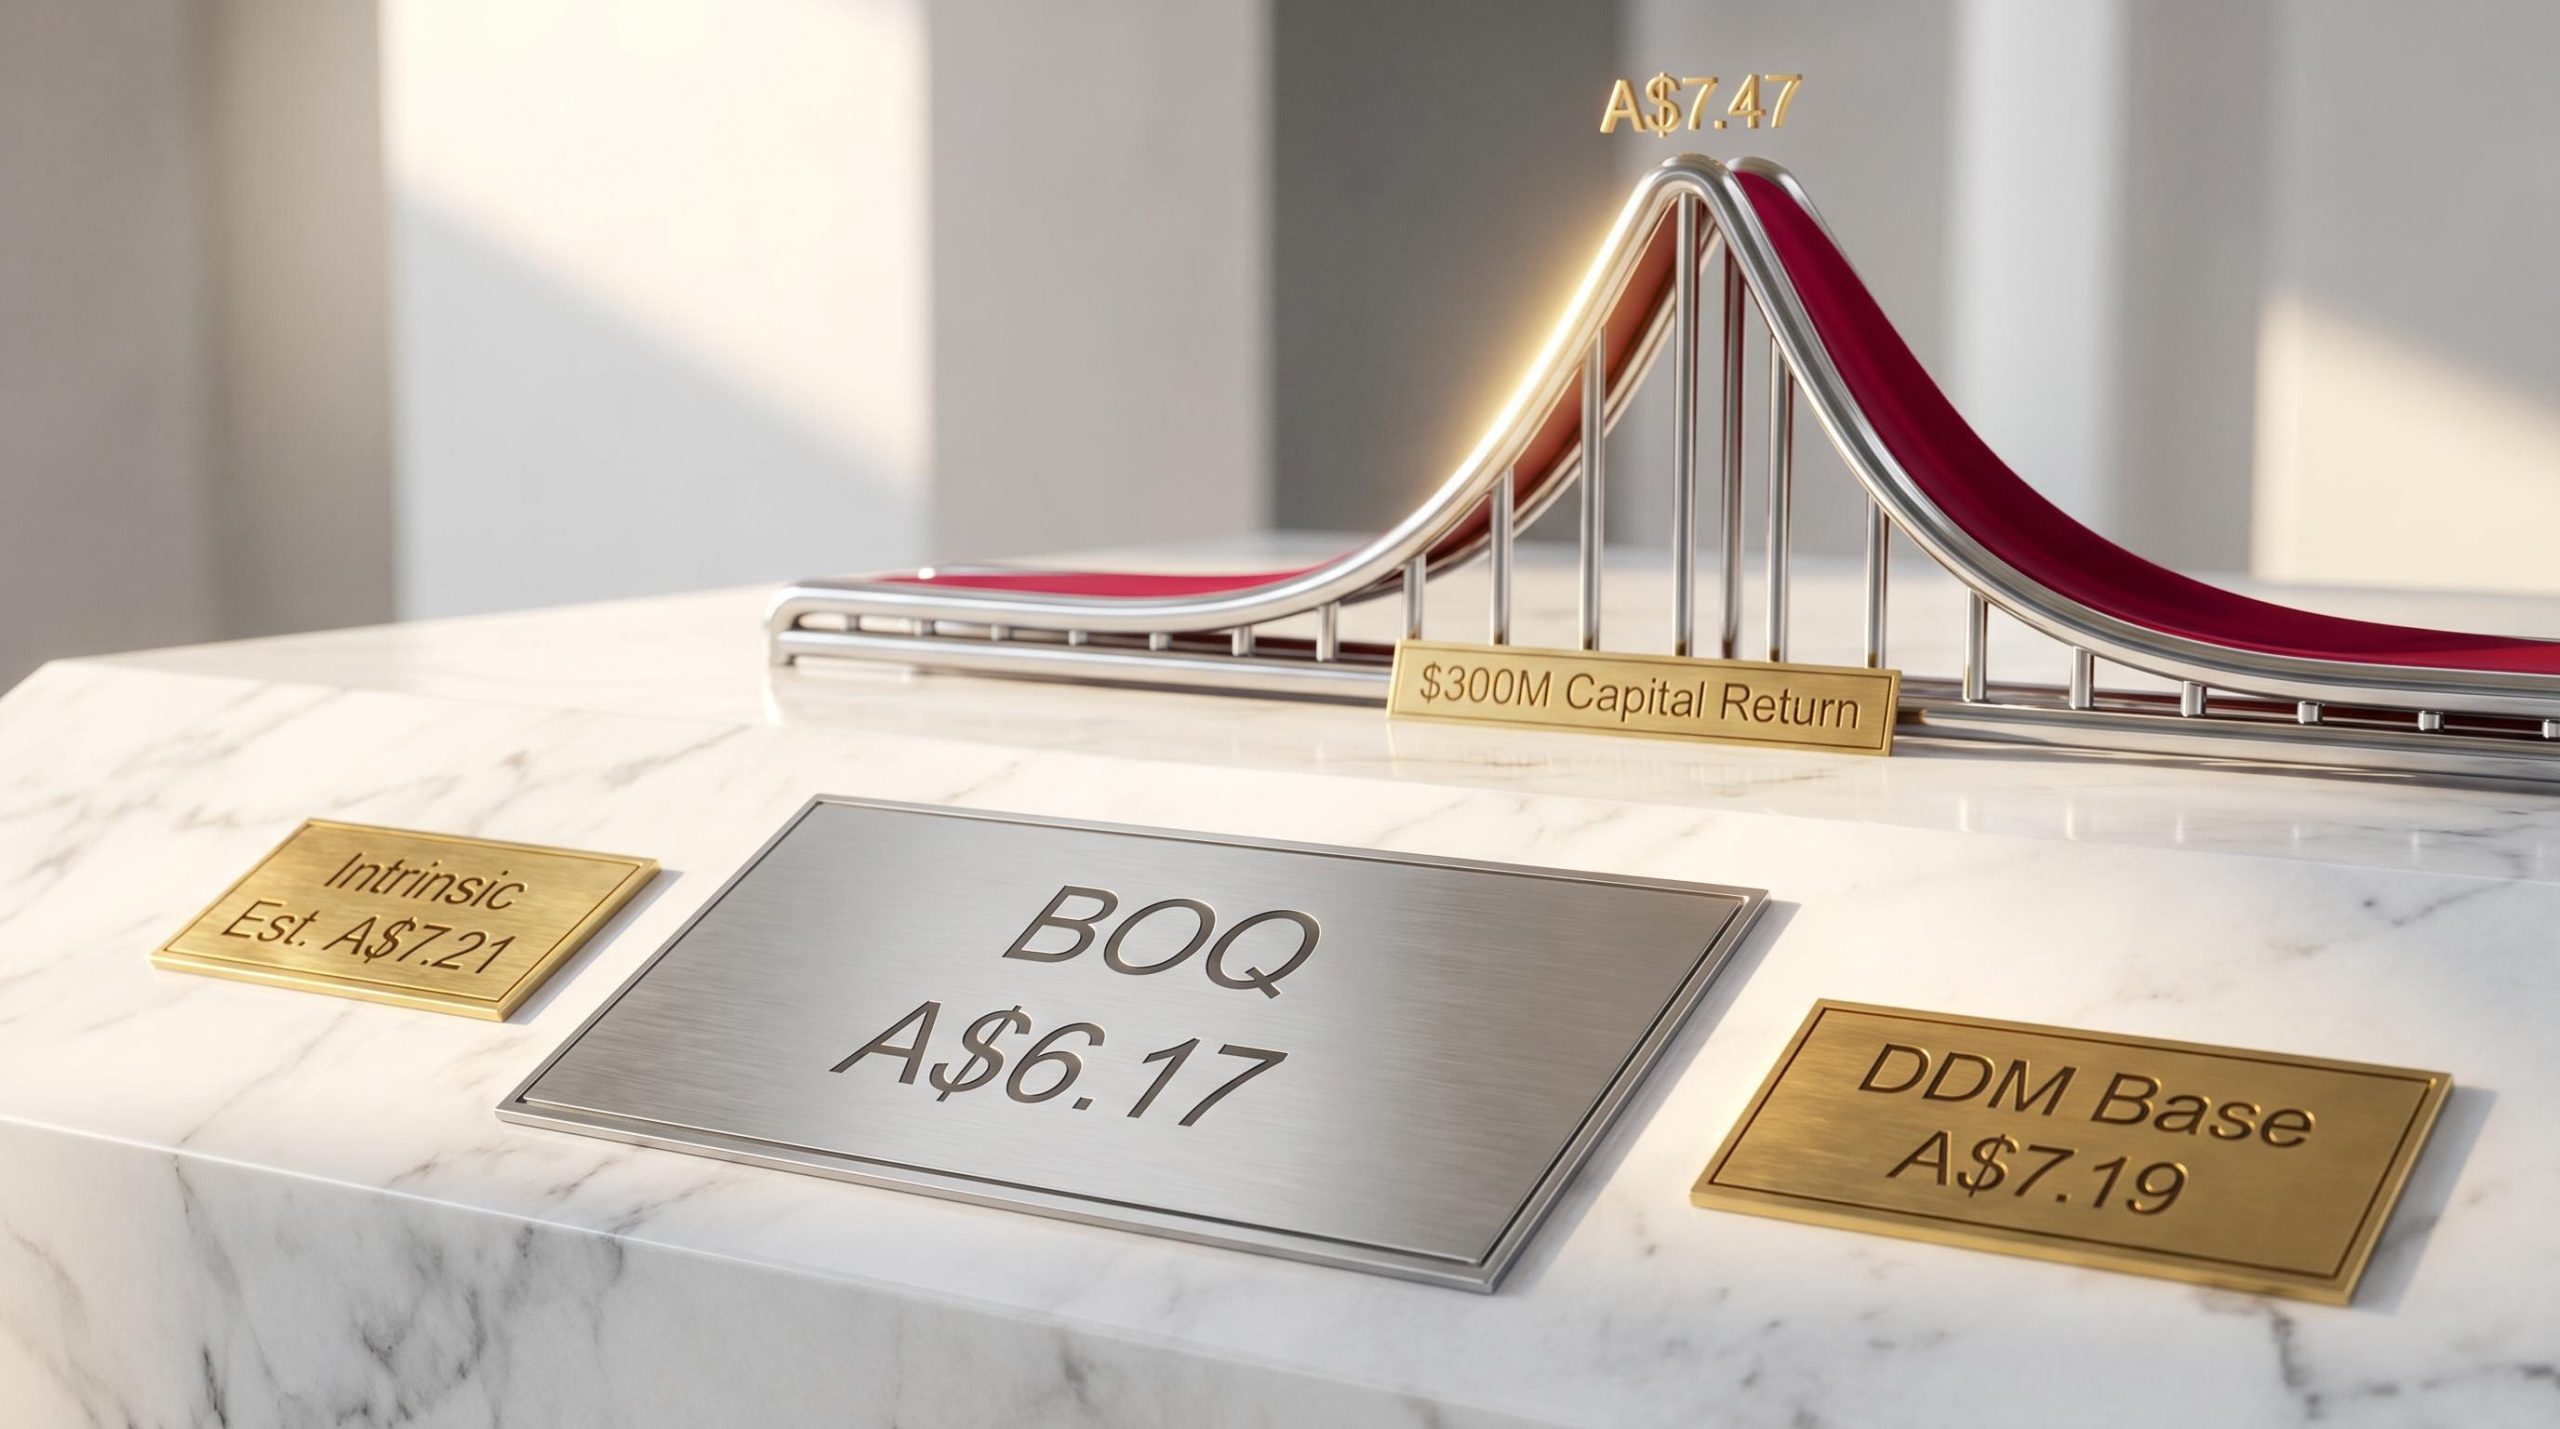
Bank of Queensland shares are trading around A$6.17 in mid-May 2026, yet two standard valuation frameworks place the stock’s estimated intrinsic value between A$7.19 and A$7.40. That gap, roughly 17%, is either an opportunity or a signal that the market sees something the models do not. Working out which requires more than a headline number.
The past six weeks have reshaped the BOQ investment case. A $3.7 billion equipment finance portfolio sale and a $300 million capital return announcement drove shares to a 2026 high of A$7.47 in mid-April before a sharp retreat. Half-year 2026 results showed revenue rising but profit falling, prompting Macquarie to downgrade the stock to Neutral on margin pressure concerns. BOQ now sits roughly 17% below its April peak, with 14 analysts split across five Buy, seven Hold, and eight Sell ratings.
What follows applies the PE ratio method and the Dividend Discount Model (DDM) to BOQ’s current numbers, explains how each method works and what drives its outputs, then places both results in the context of macroeconomic conditions and qualitative factors that neither model can capture.
What the PE ratio says about BOQ’s current price
The arithmetic is straightforward. Three inputs produce the signal:
- BOQ share price: A$6.17 (mid-May 2026)
- FY24 earnings per share (EPS): A$0.41
- Implied price-to-earnings (PE) ratio: approximately 15x
The Australian banking sector trades at a PE of 20.4x as of May 2026. Applying a more conservative 18x multiple to BOQ’s A$0.41 EPS produces a sector-adjusted estimated value of A$7.21 per share.
The PE ratio method for bank shares requires a peer benchmark that excludes structural outliers: CBA’s premium multiple of approximately 25x inflates any sector-average calculation and produces fair value estimates that overstate what a mid-tier regional bank’s earnings can realistically command.
Sector-adjusted estimated value: A$7.21 per share, applying an 18x PE multiple to BOQ’s A$0.41 EPS.
That figure implies roughly 17% upside from the current price. But there is a complication: the sector PE of 20.4x already sits well above its three-year average of 17.6x, which means using any sector-derived multiple as a benchmark assumes Australian bank valuations remain elevated.
Why BOQ trades at a discount to the sector multiple
A lower PE for a mid-tier regional bank relative to the major banks is structurally common, not automatically a signal of undervaluation. CBA, Westpac, NAB, and ANZ command scale premiums that BOQ’s balance sheet does not support.
Earnings quality reinforces the discount. Half-year 2026 profit fell even as revenue grew, a combination that points directly to margin compression. Macquarie’s downgrade to Neutral on 22 April 2026 cited exactly this dynamic. When profit is moving in the opposite direction to revenue, the market applies a lower multiple to the earnings that remain.
The question for investors is whether that discount is cyclical, meaning it narrows as margins recover, or structural, meaning it persists because BOQ’s competitive position limits margin expansion regardless of the rate cycle.
When big ASX news breaks, our subscribers know first
How the Dividend Discount Model values BOQ shares
The DDM values a stock by discounting its future dividend payments back to present value. It requires three inputs: the expected dividend, a risk rate (the return an investor demands for holding the stock), and a long-term dividend growth assumption.
Using a base forecast dividend of A$0.34 per share, the DDM produces an estimated value of A$7.19. An adjusted dividend of A$0.35 lifts the output to A$7.40. BOQ dividends are fully franked, and when franking credits are included, the gross dividend rises to A$0.50 per share, generating a DDM estimate of A$10.57.
The DDM mechanics for income stocks explain why franking credits are not a cosmetic adjustment: for superannuation funds in pension phase, the franking offset is refundable in cash, meaning the effective yield on a fully franked dividend is materially higher than the headline figure suggests.
Gross DDM estimate: A$10.57 per share, assuming the shareholder can fully utilise the franking credits attached to BOQ’s dividend. Investors who cannot claim the full franking benefit should rely on the pre-franking estimates.
The headline figures matter less than the sensitivity around them. Small shifts in the risk rate or growth assumption move the DDM output by dollars, not cents.
| Risk Rate | 2% Growth | 3% Growth | 4% Growth |
|---|---|---|---|
| 6% | A$8.50 | A$11.33 | A$17.50 |
| 7% | A$7.00 | A$8.75 | A$11.67 |
| 8% | A$5.83 | A$7.00 | A$8.75 |
| 9% | A$5.00 | A$5.83 | A$7.00 |
| 10% | A$4.38 | A$5.00 | A$5.83 |
| 11% | A$3.89 | A$4.38 | A$5.00 |
At the current price of A$6.17, the trailing yield sits at approximately 6.5% on an unfranked basis. The table illustrates why a single DDM output should never be read as a price target: the range spans from A$3.89 at the most conservative assumptions to A$17.50 at the most aggressive.
Understanding the two valuation models and their limits
Both frameworks produced similar headline figures: A$7.21 (PE-based) and A$7.19 (DDM base case). That convergence may look like confirmation. It is not. The two models share underlying assumptions about earnings durability, and when those assumptions are wrong, both outputs move in the same direction.
The valuation methods for ASX bank stocks each carry sector-specific blind spots: PE ratios treat all earnings as equivalent regardless of their source, DDM outputs swing sharply with small changes in the discount rate, and neither model accounts for APRA capital adequacy requirements that can constrain a bank’s actual dividend-paying capacity.
The PE ratio as a relative lens
The PE ratio compares what investors pay for a dollar of earnings at one company versus another. Its inputs are the share price and EPS. It is most useful for peer comparison and historical benchmarking within the same sector.
Where it fails: the PE ratio treats all earnings as equivalent. A dollar of earnings from a bank with expanding margins is not the same as a dollar from a bank with compressing margins. BOQ’s half-year 2026 results, where profit fell even as revenue rose, illustrate this directly. The A$0.41 EPS figure used in the calculation carries real uncertainty about whether it will be repeated.
The DDM as an absolute income lens
The DDM values a stock based on the cash it returns to shareholders through dividends, discounted at a rate that reflects the risk of holding it. Its primary inputs are the dividend, the discount (risk) rate, and the assumed long-term growth rate.
Where it fails: small changes in the discount rate or growth assumption produce large swings in the output, as the sensitivity table above demonstrates. The model also assumes dividends are sustainable and grow at a steady rate, an assumption that becomes fragile when the payout ratio is rising because profit is falling while the dividend holds steady. Australian banks collectively account for over one-third of the S&P/ASX 200 by market capitalisation, making sector PE comparisons particularly relevant for domestic equity investors, but neither model accounts for whether a company can defend its current payout.
The capital return catalyst and what it changes for valuation
On 7 April 2026, BOQ announced the sale of its $3.7 billion equipment finance portfolio to Challenger Ltd, accompanied by a $300 million capital return to shareholders.
Capital return: $300 million, structured as a combination of on-market buyback and special dividend, pending regulatory approvals. Completion expected by end of May 2026.
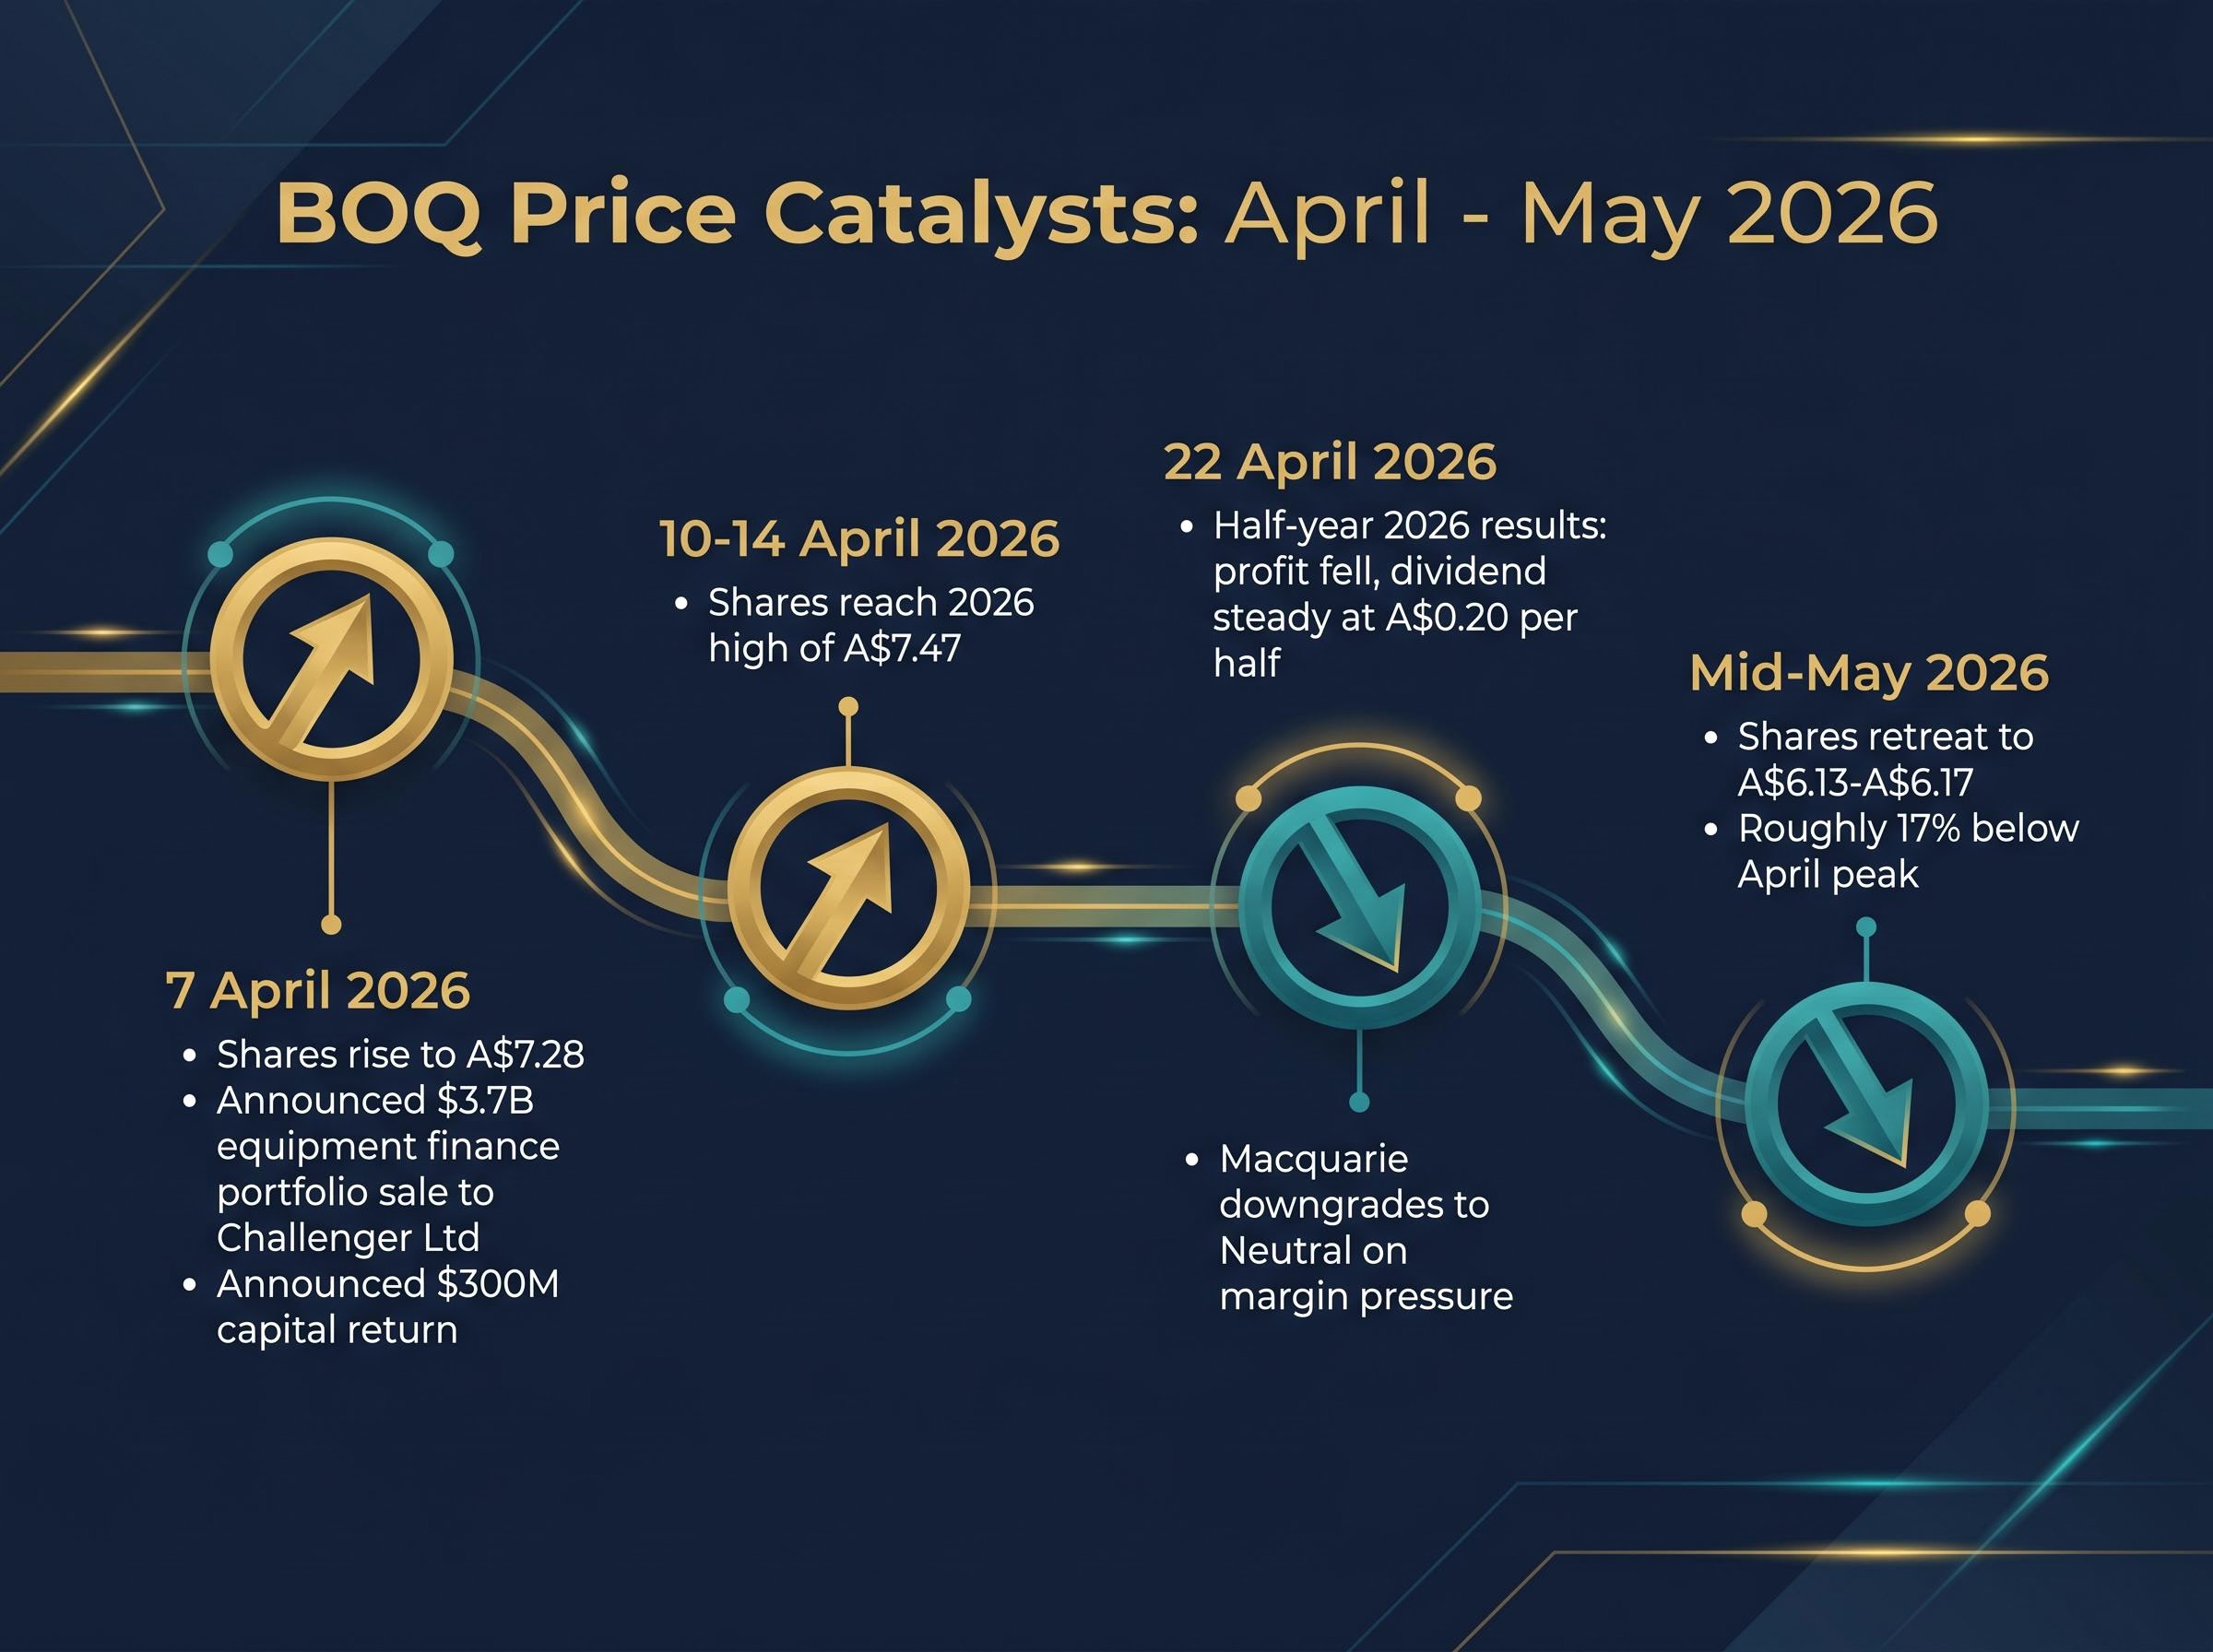
The market responded immediately. The timeline ran as follows:
- 7 April 2026: Announcement day; BOQ shares rose to A$7.28
- 10-14 April 2026: Shares reached a 2026 high of approximately A$7.47
- 22 April 2026: Half-year 2026 results released; profit fell, dividend held steady at A$0.20 per half (A$0.40 annualised)
- 22 April 2026: Macquarie downgraded BOQ to Neutral, citing margin pressure
- Mid-May 2026: Shares retreated to A$6.13-A$6.17, roughly 17% below the April peak
Both valuation models are directly affected. The buyback component reduces the share count, which can mechanically lift EPS and therefore the PE-implied value. The special dividend temporarily inflates the income stream used in a DDM, but it is non-recurring and should not be fed into a steady-state model without adjustment.
The retreat from A$7.47 to A$6.17 was not irrational. It reflected investors discounting execution uncertainty around regulatory approvals and reassessing BOQ’s post-transaction earnings capacity once the equipment finance book, and its associated revenue, exits the balance sheet.
What the models miss: macroeconomic and qualitative factors
The RBA cash rate stands at 4.35% as of May 2026, with forward guidance suggesting rates will remain steady unless geopolitical risks force a reassessment. At this level, discount rates for Australian bank equity remain elevated relative to the low-rate era, which mechanically compresses DDM-derived fair values. Any RBA pivot to cuts would move BOQ’s DDM range materially higher; further tightening would compress it further.
The RBA’s May 2026 monetary policy decision confirmed the cash rate at 4.35%, with the Board noting that inflation progress and global uncertainty would shape the timing of any future adjustments, a stance that keeps discount rates for Australian bank equity elevated relative to the low-rate environment that previously supported more generous DDM valuations.
Neither model captures the qualitative factors that determine whether the discount closes:
- Net interest margin trajectory: Has NIM compression troughed, or will deposit competition and funding costs continue to erode margins?
- Dividend payout sustainability: Profit fell in the half-year 2026 period, yet the dividend was held steady, pushing the payout ratio higher
- Credit quality: Mortgage and small business loan books face pressure from a moderating housing market
- Management execution: The equipment finance sale signals a strategic pivot toward capital efficiency, but investors are waiting for evidence of what replaces the divested revenue
- Competitive position: Whether a regional bank can compete effectively against major bank balance sheet scale in a tighter lending environment
The analyst consensus reflects this uncertainty directly. According to Simply Wall St, 14 analysts cover BOQ with an average 12-month target of A$6.38, implying only +3.4% upside from current levels.
| Broker | Rating | Price Target | Key Rationale |
|---|---|---|---|
| Citi | Buy | A$7.15 | Valuation upside from capital return |
| UBS | Buy | — | Rating maintained |
| Morgan Stanley | Overweight | — | Constructive on re-rating potential |
| Macquarie | Neutral (downgraded) | — | Margin pressure; downgraded 22 April 2026 |
The consensus breakdown of 5 Buy, 7 Hold, and 8 Sell ratings means more than half of covering analysts do not recommend buying the stock, despite it trading below multiple valuation estimates.
The discount is real, but so is the uncertainty
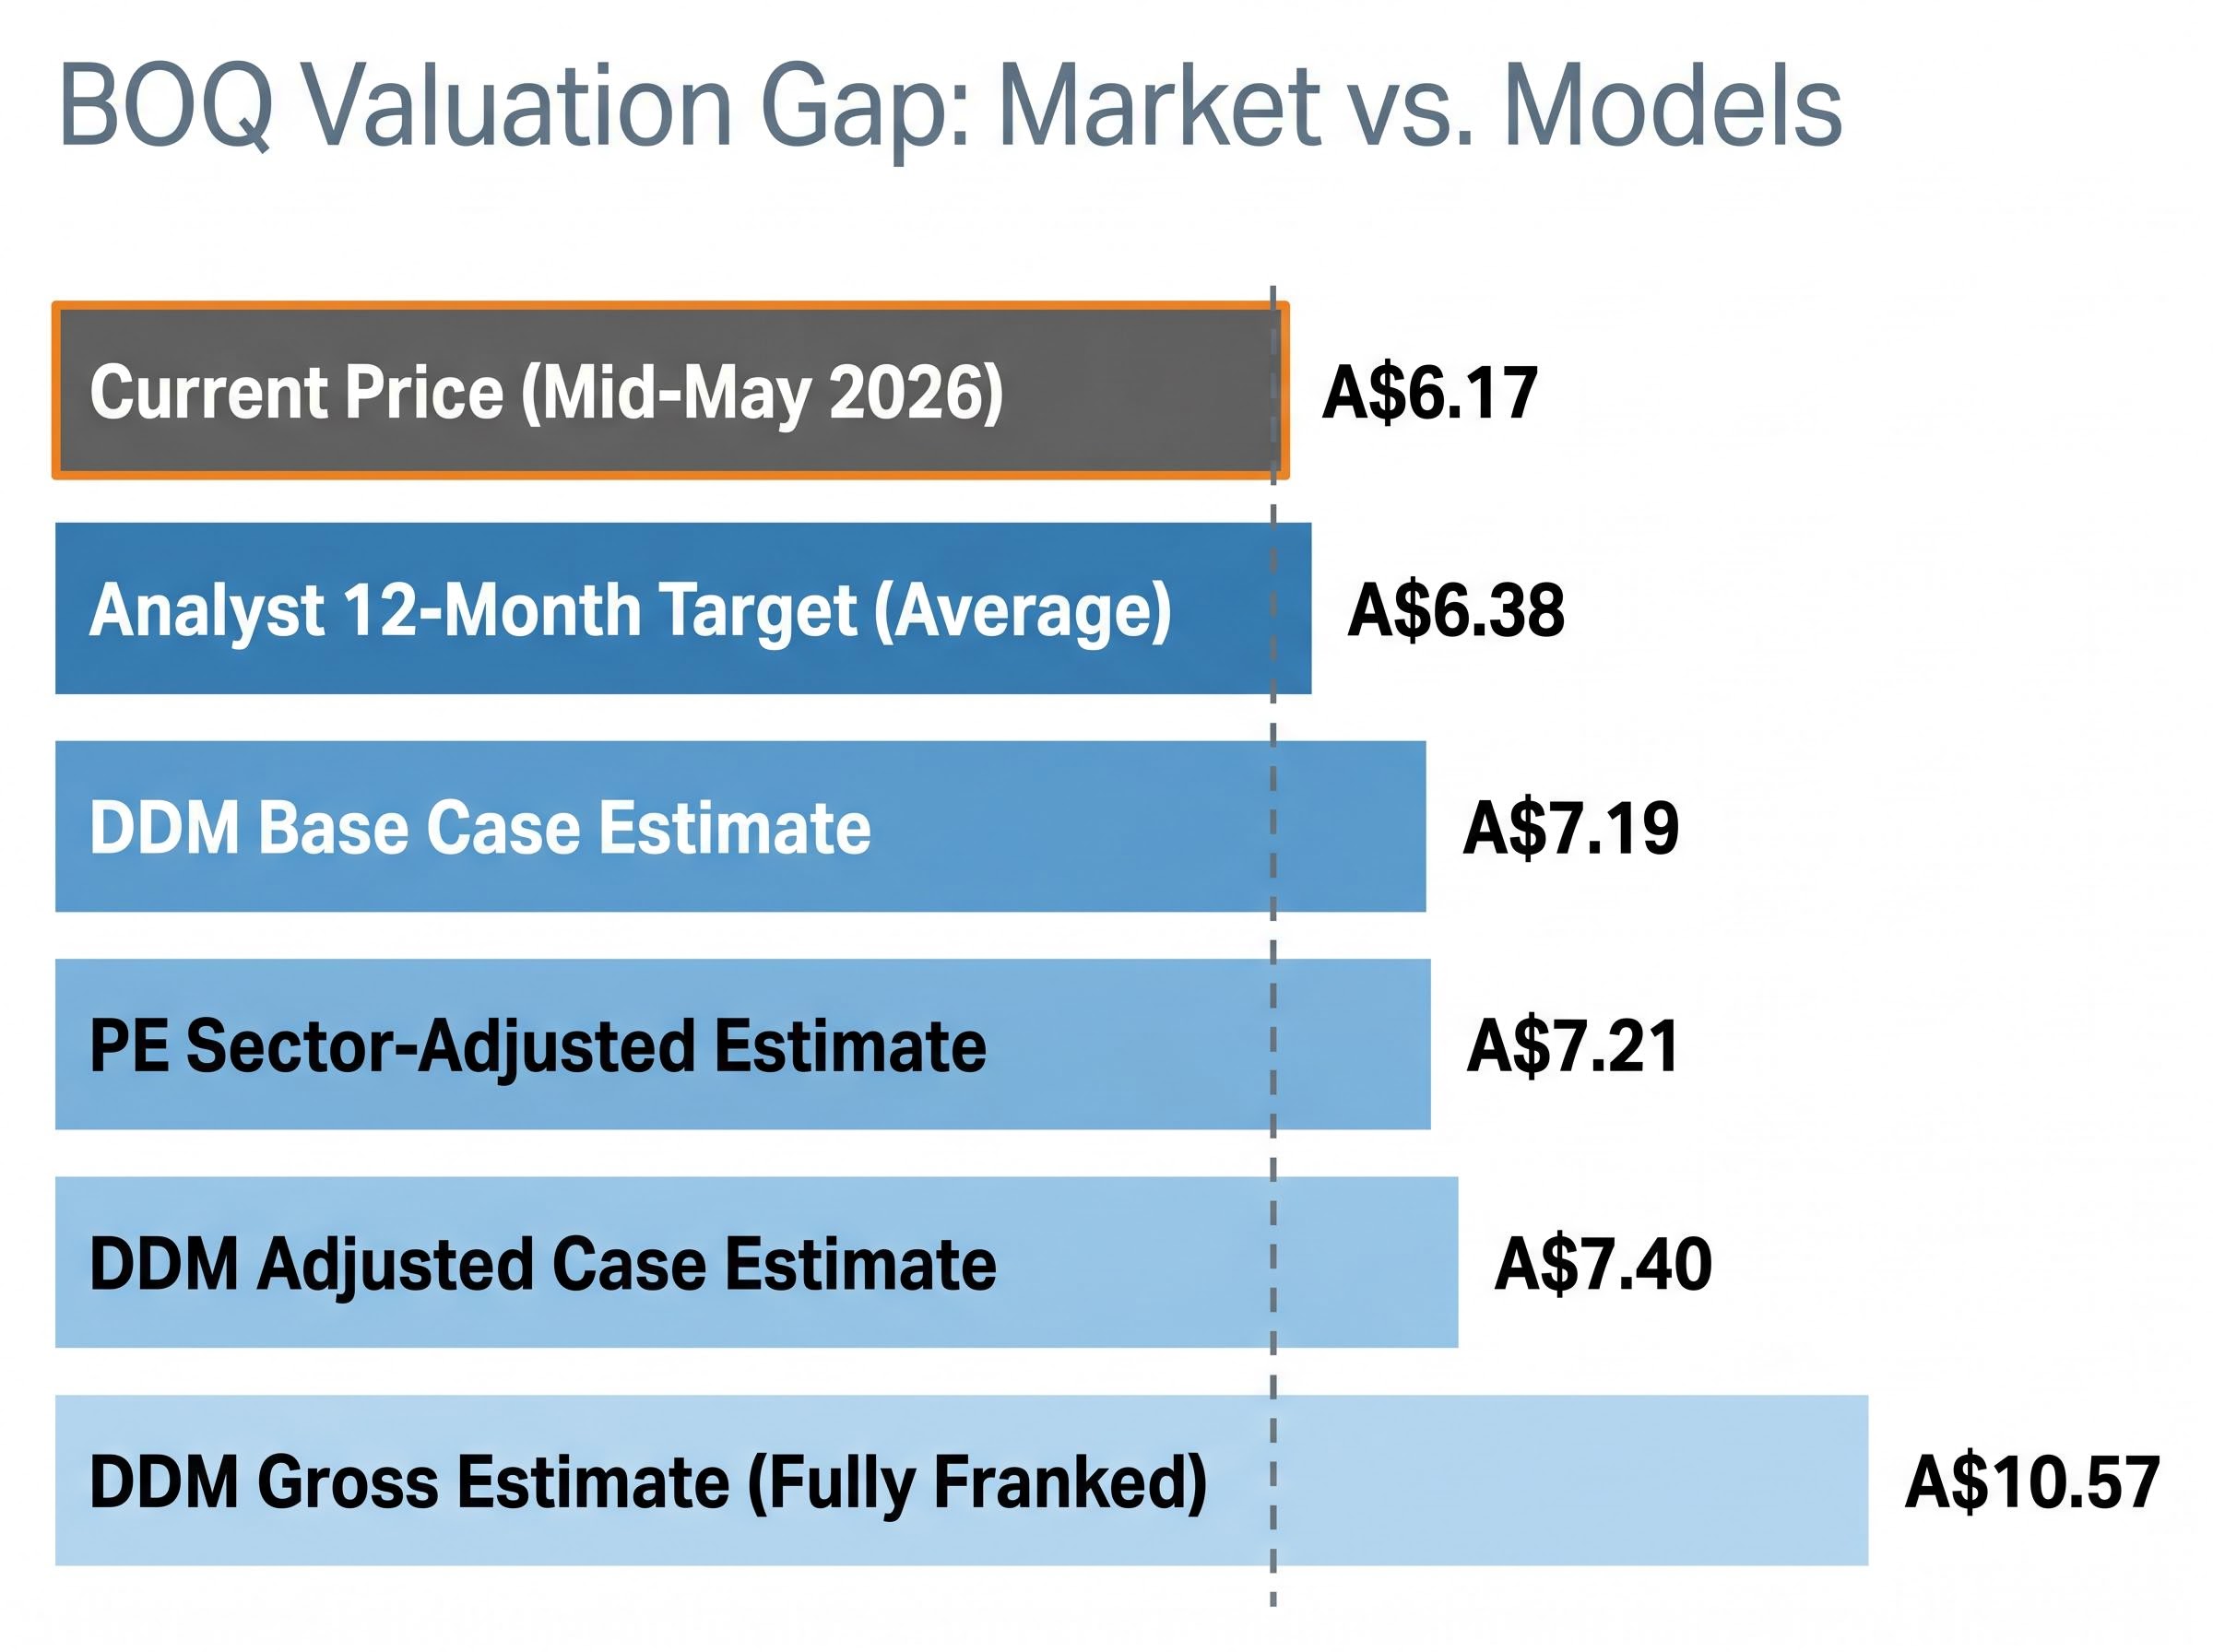
Both models agree on the direction: BOQ trades below model-implied intrinsic value. The PE method places the sector-adjusted estimate at A$7.21. The DDM base case sits at A$7.19, with the adjusted case at A$7.40 and the gross franking-adjusted figure at A$10.57.
The core tension: BOQ trades at an approximately 17% discount to model-implied value, yet the median analyst sees only +3.4% upside from current levels. That gap between the models and the consensus is itself a data point.
Two conditions would most likely close the discount:
- Completion of the $300 million capital return as announced, with regulatory approval confirmed by end of May 2026
- Evidence in the next reporting period that net interest margin compression has troughed and earnings can stabilise
Two risks could prevent it:
For readers wanting to understand the investment case in more depth, our deep-dive into the BOQ share price drop examines why the 7.3% fall was not a straightforward profit warning, how deliberate cost investment and a loan book pivot toward commercial lending complicate a near-term earnings read, and what the 2027 recovery thesis requires to hold.
- Continued margin erosion that forces a dividend cut, invalidating both the PE earnings base and the DDM dividend input
- A deterioration in credit quality across BOQ’s mortgage or small business lending books
Investors positioned to utilise the full franking credits attached to BOQ’s dividend have a materially different valuation case from those relying solely on the pre-franking DDM output. At approximately 6.5% trailing yield on an unfranked basis, the income proposition is visible, but it depends on a dividend that is currently being paid from declining profits.
This article is for informational purposes only and should not be considered financial advice. Investors should conduct their own research and consult with financial professionals before making investment decisions. Past performance does not guarantee future results. Financial projections are subject to market conditions and various risk factors.