
FLT Share Price vs. 90% Revenue Growth: Analysing the Gap
40 mins ago

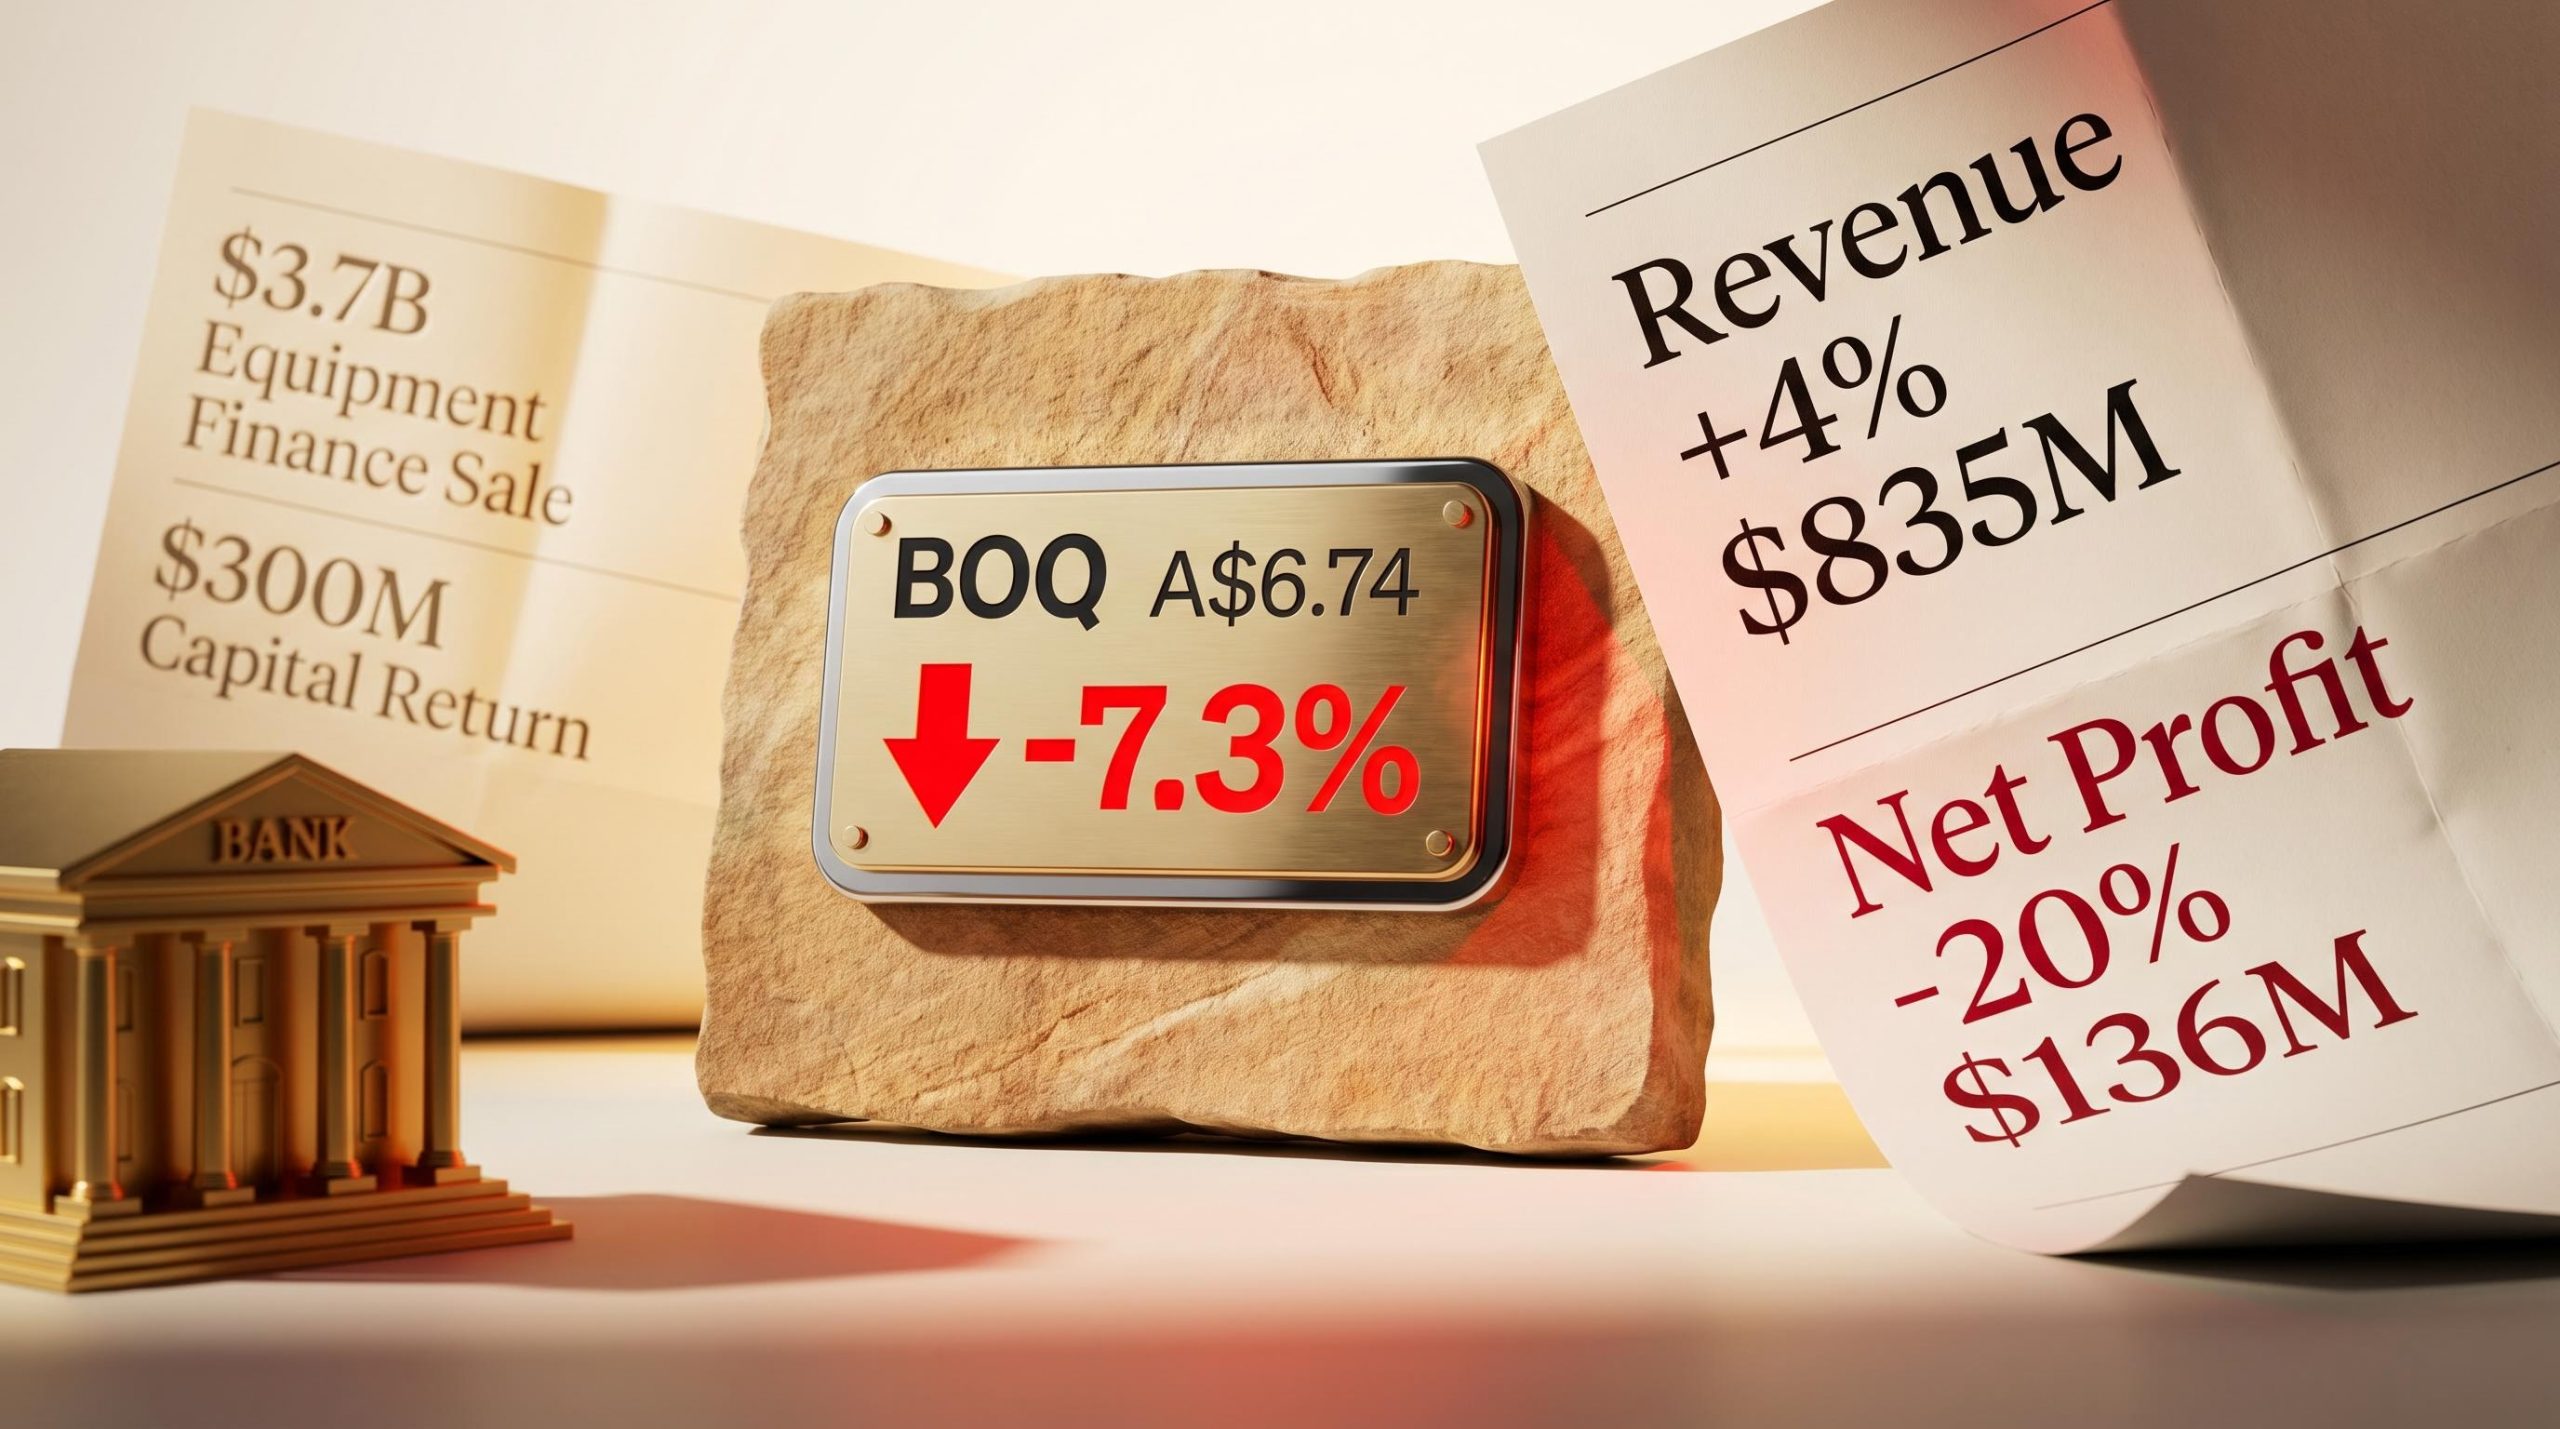
Bank of Queensland shares dropped 7.3% on 22 April 2026, the day the regional lender reported a 20% fall in statutory net profit to $136 million. Revenue, meanwhile, rose 4% to $835 million. That contradiction, profit falling sharply while the top line grew, is the story the market spent the following week pricing in.
BOQ is mid-transition. The bank is deliberately shrinking its home lending book, building out commercial banking, investing in digital infrastructure, and selling a $3.7 billion equipment finance portfolio to fund a $300 million capital return. The half-year result is the first major scorecard for that strategy under genuine cost pressure.
What follows unpacks why costs swallowed the revenue gain, what the lending mix shift means for the earnings trajectory, and what investors watching the BOQ share price should monitor heading into the second half of FY26.
BOQ closed at approximately A$7.32 on 21 April. By the close of 22 April, the day results landed, the stock had fallen to approximately A$6.74, a single-session decline of 7.3%.
The sell-off did not reverse.
The core tension: statutory net profit fell 20% to $136 million, while total income rose 4% to $835 million. The market responded not to weak revenue but to what consumed the growth.
Over the eight trading days that followed, shares drifted lower rather than recovering, settling at approximately A$6.77 by 30 April, an 8.2% decline from pre-announcement levels.
| Date | Share Price (approx. A$) |
|---|---|
| 21 April (pre-announcement close) | $7.32 |
| 22 April | $7.03 |
| 23 April | $6.64 |
| 24 April | $6.71 |
| 29 April | $6.72 |
| 30 April | $6.77 |
The persistence of the decline suggests the market was not reacting to a single headline figure. Something in the earnings structure unsettled investors beyond what the revenue number could offset.
The BOQ 1H26 results confirmed cash earnings after tax of $176 million alongside an 11% lift in the interim dividend to 20 cents per share fully franked, metrics that sit alongside the statutory figures and provide a more complete picture of the bank’s underlying earnings trajectory.
Revenue grew 4%. Cash operating expenses grew 6%, reaching $553 million. That two-percentage-point gap is where the profit went.
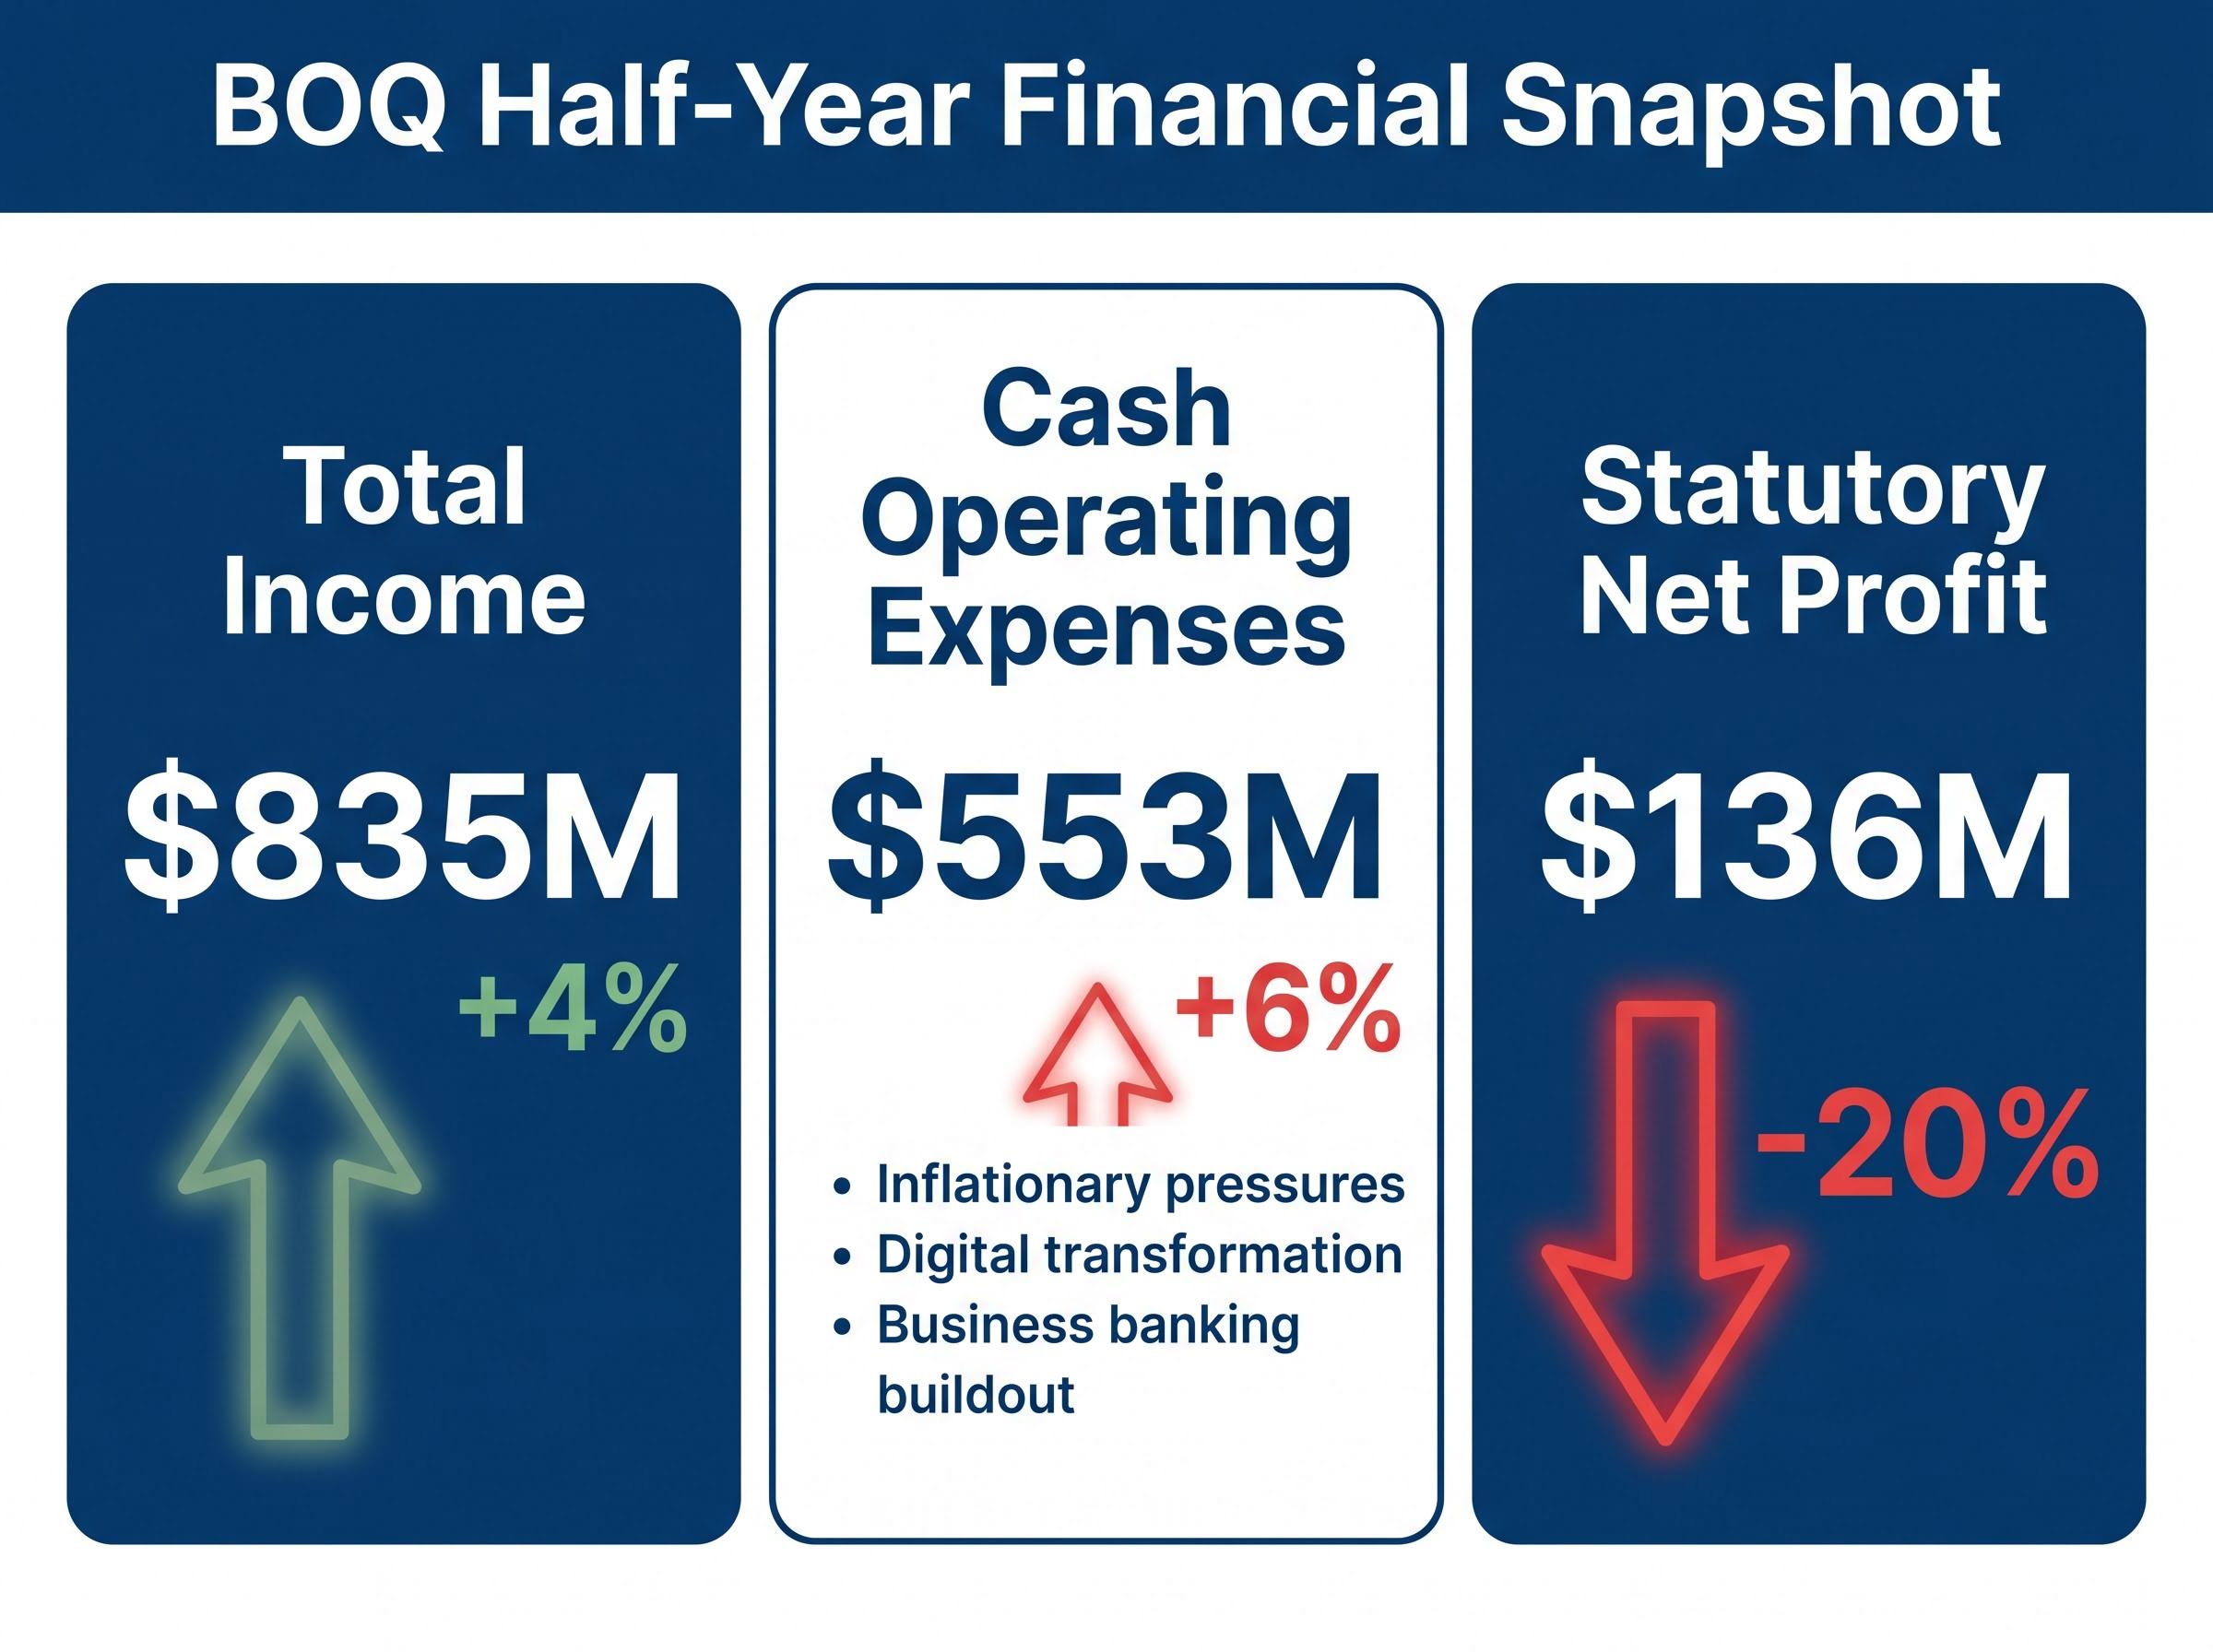
The cost increase came from three distinct sources:
Not all of these costs carry the same signal. Inflation is an external headwind that management cannot fully control. The digital and business banking spend, by contrast, represents deliberate investment decisions with multi-year payoff horizons.
That distinction matters. If the cost growth were purely inflationary, the result would suggest a bank losing margin with no offsetting benefit. The presence of strategic investment within the cost line means some portion of the squeeze is self-imposed, with the expectation that it generates returns in later periods.
BOQ is not simply growing or shrinking. The bank is actively reshaping which types of lending dominate its book, and that shift creates temporary friction in the numbers that a single half-year snapshot cannot fully capture.
Home lending, historically the bank’s largest category, fell 4% over the half. Commercial lending grew 7% over the same period, with year-on-year growth running at approximately 16%.
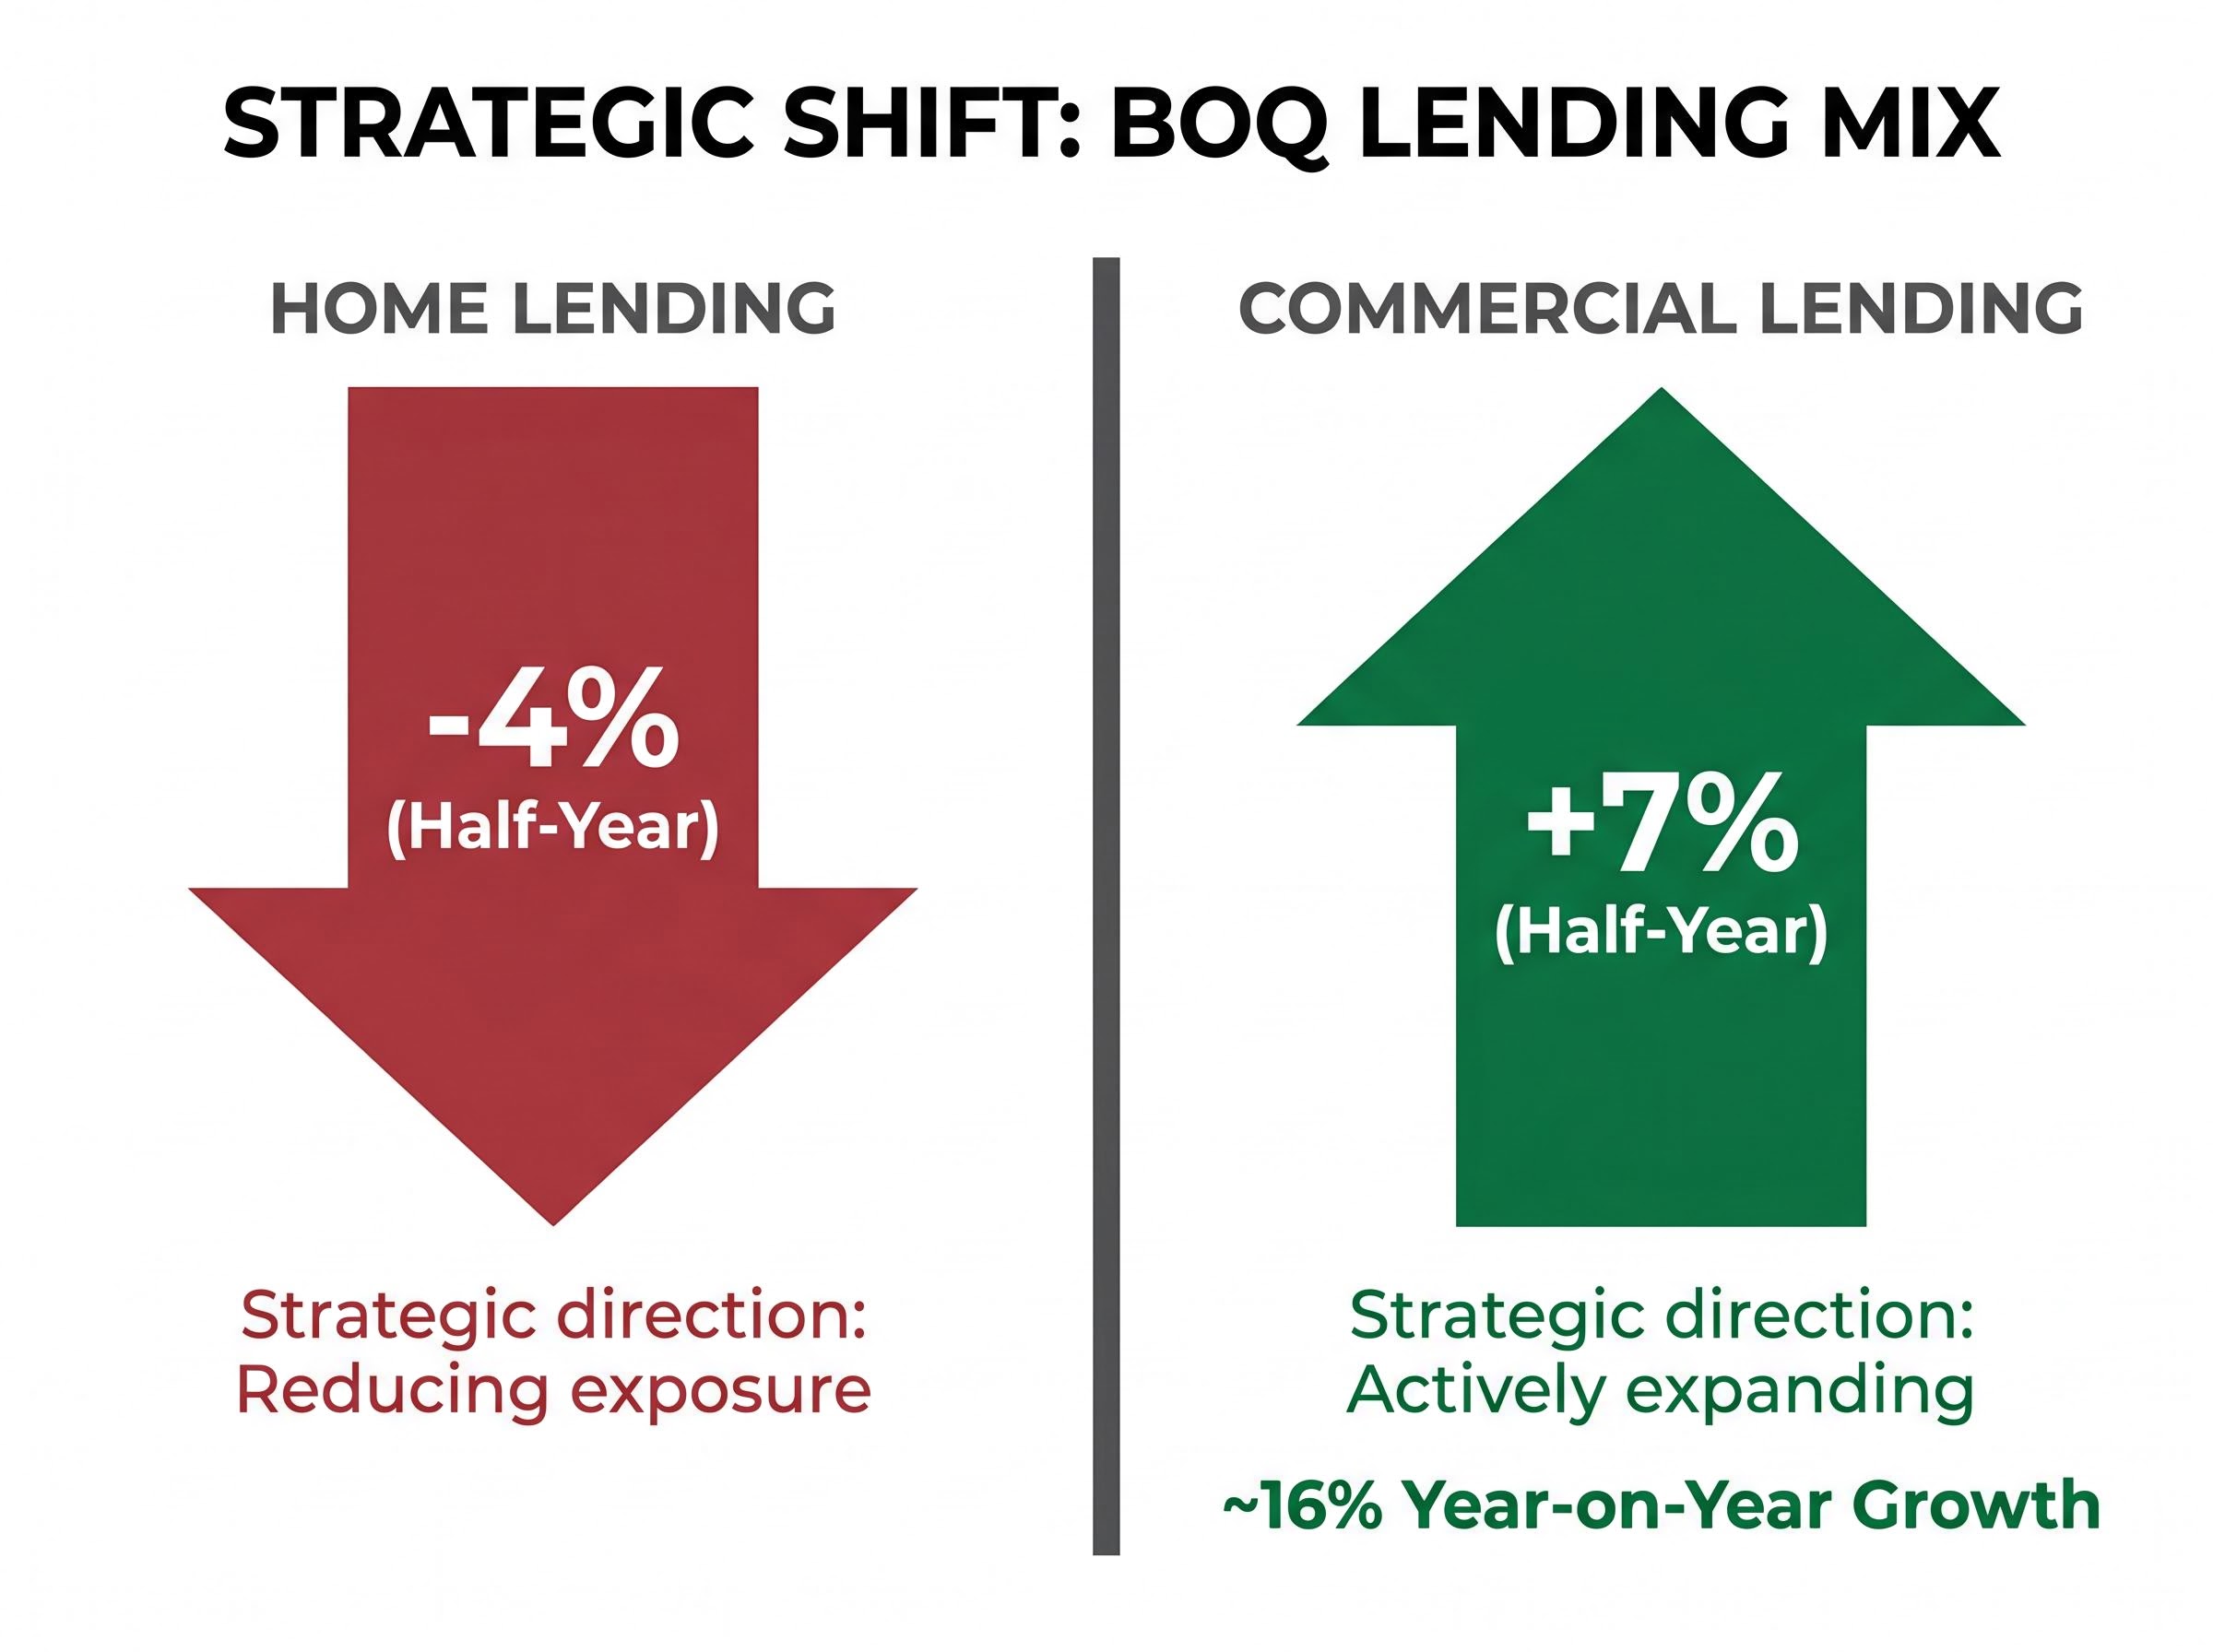
| Metric | Home Lending | Commercial Lending |
|---|---|---|
| Half-year growth | -4% | +7% |
| Year-on-year growth | Declining | ~16% |
| Strategic direction | Reducing exposure | Actively expanding |
The pivot toward commercial lending targets higher margins, but new business relationships take time to mature and generate the fee income that justifies the upfront acquisition cost. In the interim, the declining home loan book suppresses volume-based income before commercial income fully compensates.
APRA’s quarterly ADI statistics track aggregate capital adequacy, asset quality, and lending mix across all authorised deposit-taking institutions in Australia, providing the sector-wide benchmark against which BOQ’s deliberate shift from home lending to commercial lending can be assessed.
Non-interest income grew 13% during the half, supported by business lending fees and branch conversion proceeds, an early indicator that the commercial strategy is beginning to contribute.
Asset quality, meanwhile, improved. Arrears and impaired asset metrics moved in the right direction period-on-period, which separates the cost and margin story from any suggestion of deteriorating credit quality. The bank is not losing money on bad loans; it is spending money on a deliberate repositioning.
The largest near-term catalyst for BOQ shareholders sits outside the lending results entirely.
The bank has agreed to sell its $3.7 billion equipment finance loan book to Challenger, with the transaction expected to follow a three-step sequence:
That $300 million figure is material. Against a market capitalisation of approximately $5 billion, the return represents roughly 6% of BOQ’s total market value.
No specific regulatory approvals were identified as pending as of 30 April 2026, though investors should monitor ASX announcements for confirmation of completion and details on how the return will be structured.
The transaction also simplifies the bank’s portfolio. Exiting equipment finance allows management to concentrate capital and operational resources on the commercial and retail banking segments that sit at the centre of the strategic pivot.
The 22 April sell-off did not arrive in isolation. Over the 12 months to 30 April 2026, BOQ shares declined approximately 6%, while the S&P/ASX 200 gained approximately 15% over the same period.
That relative underperformance gap of roughly 21 percentage points places BOQ among the weaker performers in the Australian banking sector over the trailing year.
Valuation metrics reinforce the tension. A price-to-earnings ratio of approximately 43.8x, compared with a global banking peer average of approximately 11.2x, suggests the current share price already embeds expectations of significant future earnings recovery. At least one analyst holds a Sell rating on BOQ with a price target of A$6.00, below the 30 April close.
Australian bank valuations have become a recurring concern across the sector: at the Big Four level, analysts at Morgans issued sell ratings on all four in late April 2026, with CBA trading at roughly 27x earnings against a historical average of approximately 18x, a valuation dynamic that frames the BOQ multiple of approximately 43.8x as an even more acute version of the same market-wide repricing risk.
CEO Rod Finch outlined several forward priorities during the results presentation:
Management has effectively nominated FY27 as a potential inflection point. If cost discipline holds and commercial income scales, the margin compression visible in this half-year result could begin to reverse. If the recovery delays, the elevated multiple leaves limited room for further disappointment.
The half-year result illustrates a pattern that recurs across banks in strategic transition: headline revenue growth can mask margin compression when cost growth outpaces income. Reading one line without the other produces a distorted picture.
For BOQ specifically, the dividend held steady at the half-year mark, the $300 million capital return is approaching, and management has identified FY27 as a potential turning point for earnings trajectory.
Investors tracking this story should monitor a short list of signals before the full-year result:
For investors tracking the broader picture, our full explainer on ASX banking sector catalysts examines how the May 2026 RBA decision, the 10.5 percentage point performance gap between the best and worst Big Four performers, and stretched valuations across the sector are combining to make stock selection within Australian banking more consequential than broad sector allocation.
This article is for informational purposes only and should not be considered financial advice. Investors should conduct their own research and consult with financial professionals before making investment decisions. Past performance does not guarantee future results.
BOQ shares dropped 7.3% on 22 April 2026 because statutory net profit fell 20% to $136 million even as revenue rose 4%, with cash operating expenses growing 6% and outpacing income growth, unsettling investors about the bank's near-term earnings trajectory.
BOQ agreed to sell its $3.7 billion equipment finance loan book to Challenger, with the transaction expected to complete by end of May 2026, after which the bank plans to distribute approximately $300 million to shareholders, representing roughly 6% of its total market capitalisation.
BOQ is deliberately reducing its home loan book, which fell 4% over the half, while growing commercial lending at approximately 16% year on year, targeting higher margins and fee income, though the transition creates short-term earnings friction as new commercial relationships take time to mature.
BOQ trades at a price-to-earnings ratio of approximately 43.8x, well above the global banking peer average of around 11.2x, meaning the current share price already embeds significant expectations of future earnings recovery, leaving limited room for further disappointment.
Investors should watch whether cash operating expense growth decelerates relative to revenue in the second half of FY26, whether the equipment finance sale completes and capital return details are confirmed by end of May 2026, and whether commercial lending momentum and digital mortgage channels stabilise the home loan book.