
Bitcoin is trading below $83,000 on Monday, 28 September 2026, down from highs near $87,000 reached earlier in the month. Yet every major technical indicator that professional chart-readers watch is still pointing the same direction it was before the pullback began.
That gap between the price action and the underlying structure is the whole story. Over the past several weeks, BTC broke out of a months-long consolidation between $74,000 and $78,000, crossed above its major moving averages in a stacked bullish formation, and cleared key resistance. A Monday dip inside that kind of setup reads very differently than the same dip would in a market going sideways or trending lower.
Here is the practical toolkit you will walk away with: the specific price levels that define whether the constructive thesis is still alive, the indicators to watch for genuine signs of deterioration, and what an actual structural reversal would look like versus what this week’s move actually is.
What the moving average structure is telling you right now
Start with the foundation. Bitcoin is currently trading roughly 11.4% above its 50-day exponential moving average (EMA) and approximately 18.1% above its 180-day average. An EMA is simply the average traded price over a set number of days, weighted toward recent activity, and that kind of separation from the base is read by analysts as a sign of durable trend momentum rather than a short-lived spike.
The exact EMA levels vary slightly by source, which is normal for a fast-moving asset. FXStreet places the 50-day EMA near $77,292, while Bitget’s daily update pegs it at $77,041.85, both flagged with a “Buy” bias.
The longer averages sit well beneath spot. The 100-day EMA reads somewhere between $73,561 and $73,915, and the 200-day EMA falls between $71,779 and $74,245 depending on the data provider.

| Moving Average | Approximate Level | Distance Below Spot | Analyst Bias |
|---|---|---|---|
| 50-day EMA | $77,041 – $77,292 | ~11.4% (vs 50-day avg) | Buy |
| 100-day EMA | $73,561 – $73,915 | Deep support | Buy |
| 200-day EMA | $71,779 – $74,245 | Structural floor | Buy |
What makes this arrangement bullish is the order. Shorter-period EMAs sit above longer-period ones, forming what technicians call a “stacked” structure. Reuters’ “Mapping the Market” analysis from 3 September confirmed that BTC vaulted above its 21-, 55-, 100-, and 200-day moving averages, triggering golden cross formations that strip out price extremes to confirm the primary uptrend.
Golden cross formations have a well-documented lag problem: the 50-day SMA can only cross the 200-day SMA after prices have already trended in the new direction for weeks, which means the signal confirms momentum rather than predicting it, and that distinction matters when sizing a position into an established move.
Two thresholds carry particular weight. According to DailyForex, holding the bullish reversal required reclaiming the 50-week EMA near $77,000 and the True Market Mean near $76,660. These are structural markers, not tactical levels, and BTC is now sitting comfortably above both.
Here is why the distinction matters to you. When price sits 11% above a stacked EMA cluster that spans roughly $71,000 to $77,000, a pullback to $82,800 is not a breakdown of that structure. It is the structure doing exactly what it was built to do, absorbing selling pressure at a distance from the averages. The EMA cluster defines where the structural buy zone actually is, which is not where price is trading today.
Why the stacked formation matters more than any single average
A single moving average is one reference point. A tight cluster of them is a dense demand area, because it represents the aggregate cost basis for buyers across multiple timeframes. When many participants share a similar entry price in the same zone, that zone tends to attract fresh buying on dips.
FinanceFeeds illustrated this on 14 September, when a multi-factor confluence near $76,000, combining horizontal support, the lower Bollinger Band, and the 38.2% Fibonacci retracement level, attracted buyers and launched a fresh leg higher. That is stacked structure amplifying support in real time.
When big ASX news breaks, our subscribers know first
RSI at 58 is not a warning sign, it is a reset
The daily Relative Strength Index (RSI), a momentum gauge that runs from 0 to 100 and measures the speed of recent price moves, currently sits near 58. Broader snapshots across 27-28 September from DealPlexus, Coinfuty and Cryptonews.net read slightly higher, in the 59 to 66 range, but the picture is consistent.
That reading sits above the neutral 50 line, which separates buying momentum from selling momentum, but well below the 70 threshold that signals overbought conditions. In plain terms, momentum is positive without being stretched.
Now look at where it came from. Only days earlier, the market was flashing exhaustion.
The overbought extreme, six days ago On 22 September, the daily RSI(14) reached 74.27, well into overbought territory. On the 1-hour chart, RSI briefly spiked to an extreme 87.84, a reading that almost always precedes a cooling-off period.
The trajectory since then tells the story better than any single number:
- 22 September: Daily RSI(14) at 74.27 and 1-hour RSI at 87.84, signalling short-term exhaustion at the highs.
- 25 September: RSI cooled to 62.03, coinciding with a successful test of the $83,000 support level.
- 28 September: RSI at roughly 58, back in the mid-range with the uptrend still intact.
That progression from overbought back to the mid-50s is the technical signature of a healthy trend digesting its gains, not a market rolling over. Momentum came in hot, released some pressure, and settled into a zone that has historically served as a launching pad for the next directional leg when the broader trend holds.
RSI divergence at structural confluence carries a meaningfully different evidential weight than a flat RSI threshold reading: a 2024 academic study of Nifty 50 equities recorded an 87.61% success rate for divergence signals at key support levels across three eight-year windows, which is the analytical context that makes the current BTC RSI reset at 58 worth distinguishing from a deteriorating divergence signal.
For anyone holding BTC or watching for an entry, the read is straightforward. An RSI of 58 following a pullback from overbought extremes is closer to a reset than a warning, and misreading it as a top is the kind of error that shakes people out right before continuation.
What MACD deceleration and support levels define as the range to watch
Not every indicator is singing the same note, and the honest complication in this picture is the MACD. The Moving Average Convergence Divergence indicator, which tracks the relationship between two moving averages to gauge momentum direction, has decelerated to what commentary from XS.com describes as barely positive territory.
The detail behind that is a bearish tilt. Both daily and hourly MACD histograms turned negative between 19 and 25 September, meaning upside momentum is fading even as price holds near local highs. This is the one genuinely moderating signal on the board, and it deserves to be treated as such rather than explained away.
The support architecture is what contains the risk beneath it. The primary near-term zone sits at $81,000 to $84,000, with the $82,000 to $83,000 band, per UseTheBitcoin, acting as the immediate breakout base. That is the level the constructive thesis depends on holding. Above spot, the first meaningful barrier is the $85,000 horizontal resistance.
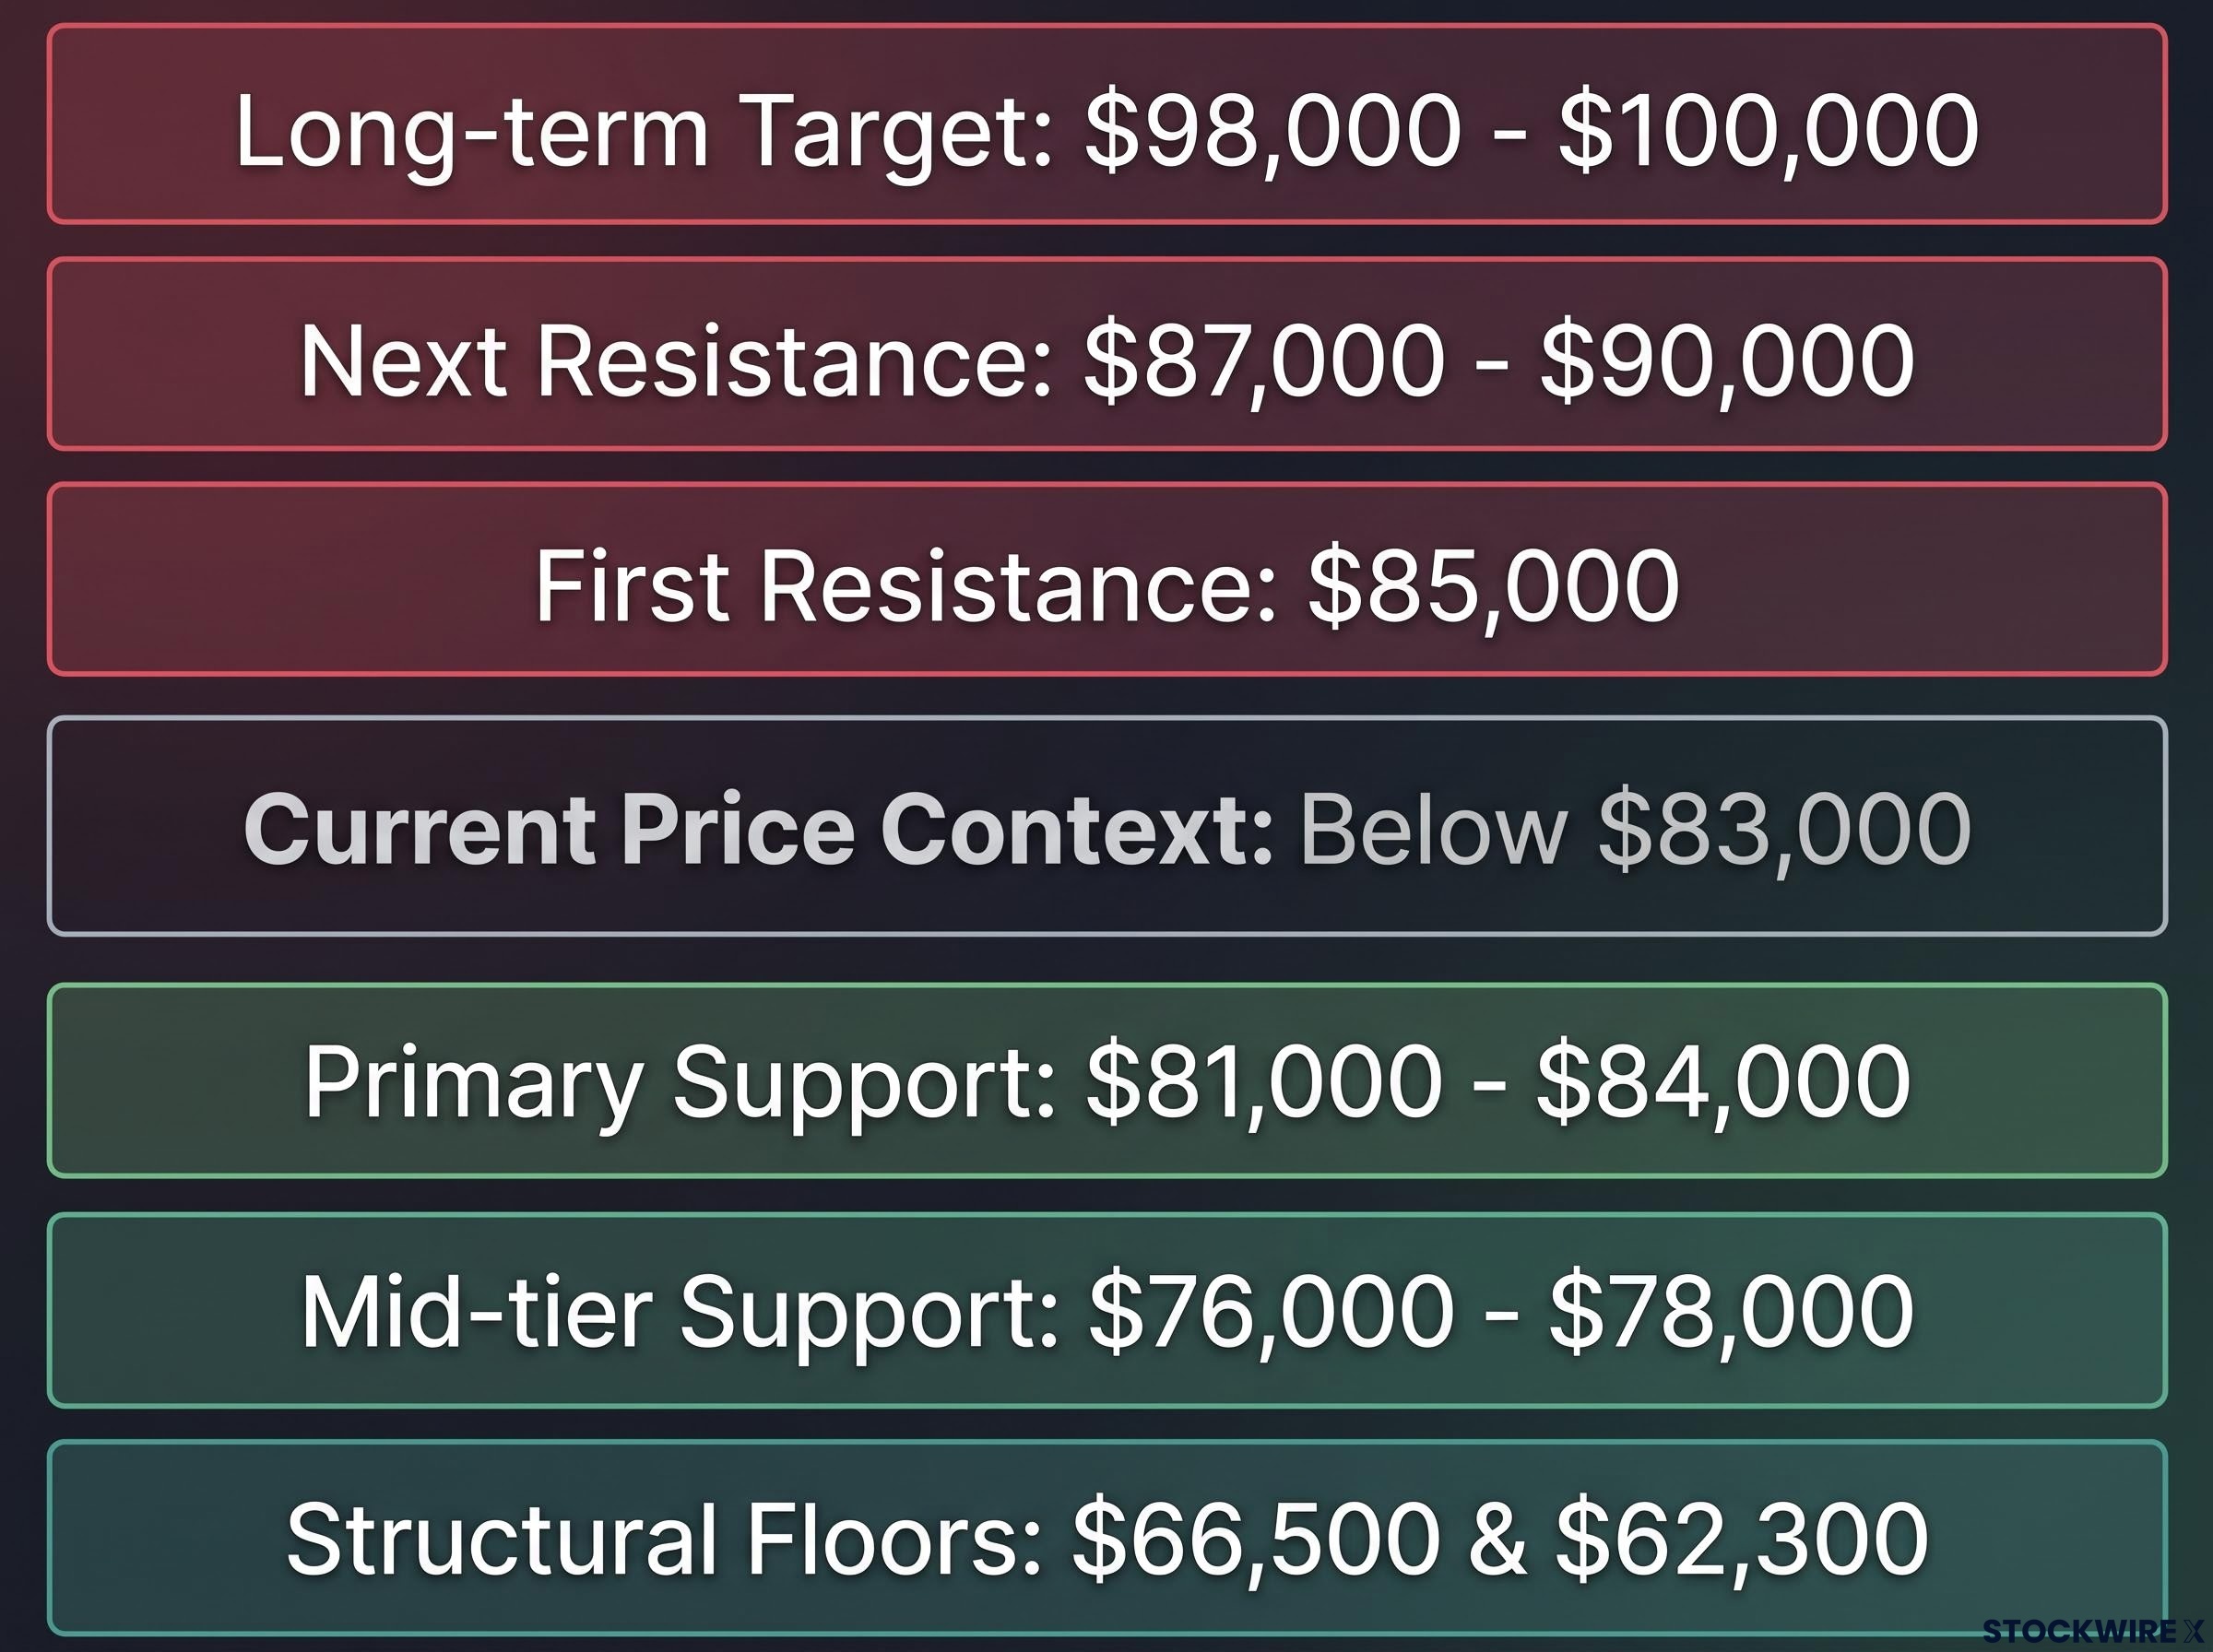
| Level | Zone | Significance | Source |
|---|---|---|---|
| First resistance | $85,000 | Immediate barrier above spot | Original / TradingKey |
| Next resistance | $87,000 – $90,000 | Following supply zones | Coinspeaker / Nansen |
| Primary support | $81,000 – $84,000 | Thesis depends on this holding | Coinspeaker / UseTheBitcoin |
| Mid-tier support | $76,000 – $78,000 | Secondary demand cluster | UseTheBitcoin |
| Structural floors | $66,500 / $62,300 | Trend-invalidation territory | Original source |
The downside plays out in tiers, and knowing the sequence is what separates a routine pullback from a genuine breakdown:
- Primary support holds: As long as $81,000 to $84,000 contains selling, the constructive setup remains in a normal holding pattern.
- Mid-tier tested: A break of the primary zone exposes the $76,000 to $78,000 cluster, which overlaps with the stacked EMA support discussed earlier.
- Structural floors: Only a move toward $66,500 and $62,300 would represent genuine trend invalidation rather than a correction within an uptrend.
Beyond spot, StoneX’s Q4 2026 outlook argues the balance of risk has shifted to the topside, pointing toward previous-support-turned-resistance in the $98,000 to $100,000 range as a longer-term destination.
Put the two signals together and the position is clear. The MACD tells you the fuel gauge is lower than it was; the support map tells you how far the market can coast before it needs a refill. You need both readings to position correctly, and reacting to either one in isolation is how good setups get misjudged.
The framework of stacking technical indicators from independent analytical families — trend, volume, and momentum — is precisely what elevates a single RSI reading or MACD histogram from a data point into a tradeable conclusion; backtests show that three-factor confluence raises the estimated probability of directional follow-through from roughly 60% with one factor to approximately 85% with three.
How BTC has behaved in this exact technical setup before
The most useful evidence here is not abstract theory. It is how Bitcoin has actually resolved this precise configuration twice already this month.
Consider the sequence in order:
- 19 September: Price at $81,247.96, stacked bullish EMAs paired with a negative MACD histogram and a neutral 15-minute RSI near 49.91. The outcome was sideways consolidation around the $81,200 area, not a breakdown.
- 25 September: Daily RSI at 62.03 with the 4-hour MACD cooling. The outcome was a successful hold of the $83,000 support level with the uptrend intact.
- 28 September (current): RSI roughly 58 to 66, MACD cooling, price in the $82,700 to $83,900 band. The market is consolidating near recently reclaimed resistance and waiting for a directional catalyst.
Each instance shares the same fingerprint: cooling momentum sitting on top of intact EMA support, resolving as consolidation followed by resumption rather than reversal. That repetition, within the same asset and the same month, is a more grounded framework than any general chart pattern.
The risk that complicates it is momentum divergence. Price remains elevated while the MACD fades, and this kind of divergence raises the probability of a deeper correction if buying volume fails to return. It is the single condition most worth monitoring.
There is a macro overlay too. According to Simon-Peter Massabni, Head of Business Development at XS.com, elevated US Treasury yields above the 5% threshold, combined with anticipated Federal Reserve tightening, raise the opportunity cost of holding Bitcoin and help explain the profit-taking seen near recent highs.
The tail-risk scenario worth acknowledging StoneX notes that Bitcoin could still theoretically make a new cycle low under $60,000 if critical macro or structural conditions deteriorate materially. It is a low-probability outcome given the current structure, but naming it matters more than burying it.
The read for you is this. The 19 and 25 September precedents make consolidation-then-continuation the base case, but the MACD divergence and the yield dynamic are precisely the conditions that would make this time play out differently. Watch those, not the daily price ticks.
The structural case for BTC remains intact, but here is what would change it
Pull the four threads together and a single diagnostic emerges. The bull case holds as long as three conditions stay true: the $81,000 to $84,000 zone continues to hold, RSI stays above the 50 neutral line, and all three EMA layers remain stacked below price. The one caveat is the MACD histogram, which needs to recover into positive territory for momentum to confirm the structure.
Monday’s pullback to roughly $82,779 sits comfortably inside that constructive zone. That means your job right now is not to decide whether Bitcoin is bullish or bearish. It is to identify which specific signal would update the assessment.
Here is the contrast, stated in thresholds:
- Bull case intact: $81,000-$84,000 support holds, RSI stays above 50, EMAs remain stacked beneath price.
- Bull case strengthens: MACD histogram recovers above zero and RSI reclaims the 60+ range.
- Bear case triggered: a confirmed daily close below the mid-$70,000s EMA cluster.
- Trend invalidation: RSI breaks below 50 while MACD confirms sustained negative momentum, in combination with the EMA breakdown.
The difference between a correction and a reversal is not a feeling. It is a defined set of levels, and now you know where they sit.
For investors who have identified the $81,000–$84,000 support zone as the thesis boundary and want a rules-based framework for sizing around it, our full explainer on trim-and-trail position management covers how to lock in partial profits at defined risk multiples while keeping exposure to a continuation move, without relying on a perfect exit call.
If support holds, where does the chart point next?
The $85,000 horizontal barrier is the immediate gate. A sustained break above it, per TradingKey analysis, targets the $90,000 to $92,000 cluster, with $87,000 as an intermediate resistance flagged by Coinspeaker and Nansen data along the way.
Beyond that, StoneX’s Q4 2026 outlook identifies the $98,000 to $100,000 zone as the structural destination. The path there runs through the MACD recovering above zero and RSI reclaiming the 60-plus range as confirming momentum signals.
This article is for informational purposes only and should not be considered financial advice. Investors should conduct their own research and consult with financial professionals before making investment decisions.
Past performance does not guarantee future results. Financial projections are subject to market conditions and various risk factors, and these statements are speculative and subject to change based on market developments.