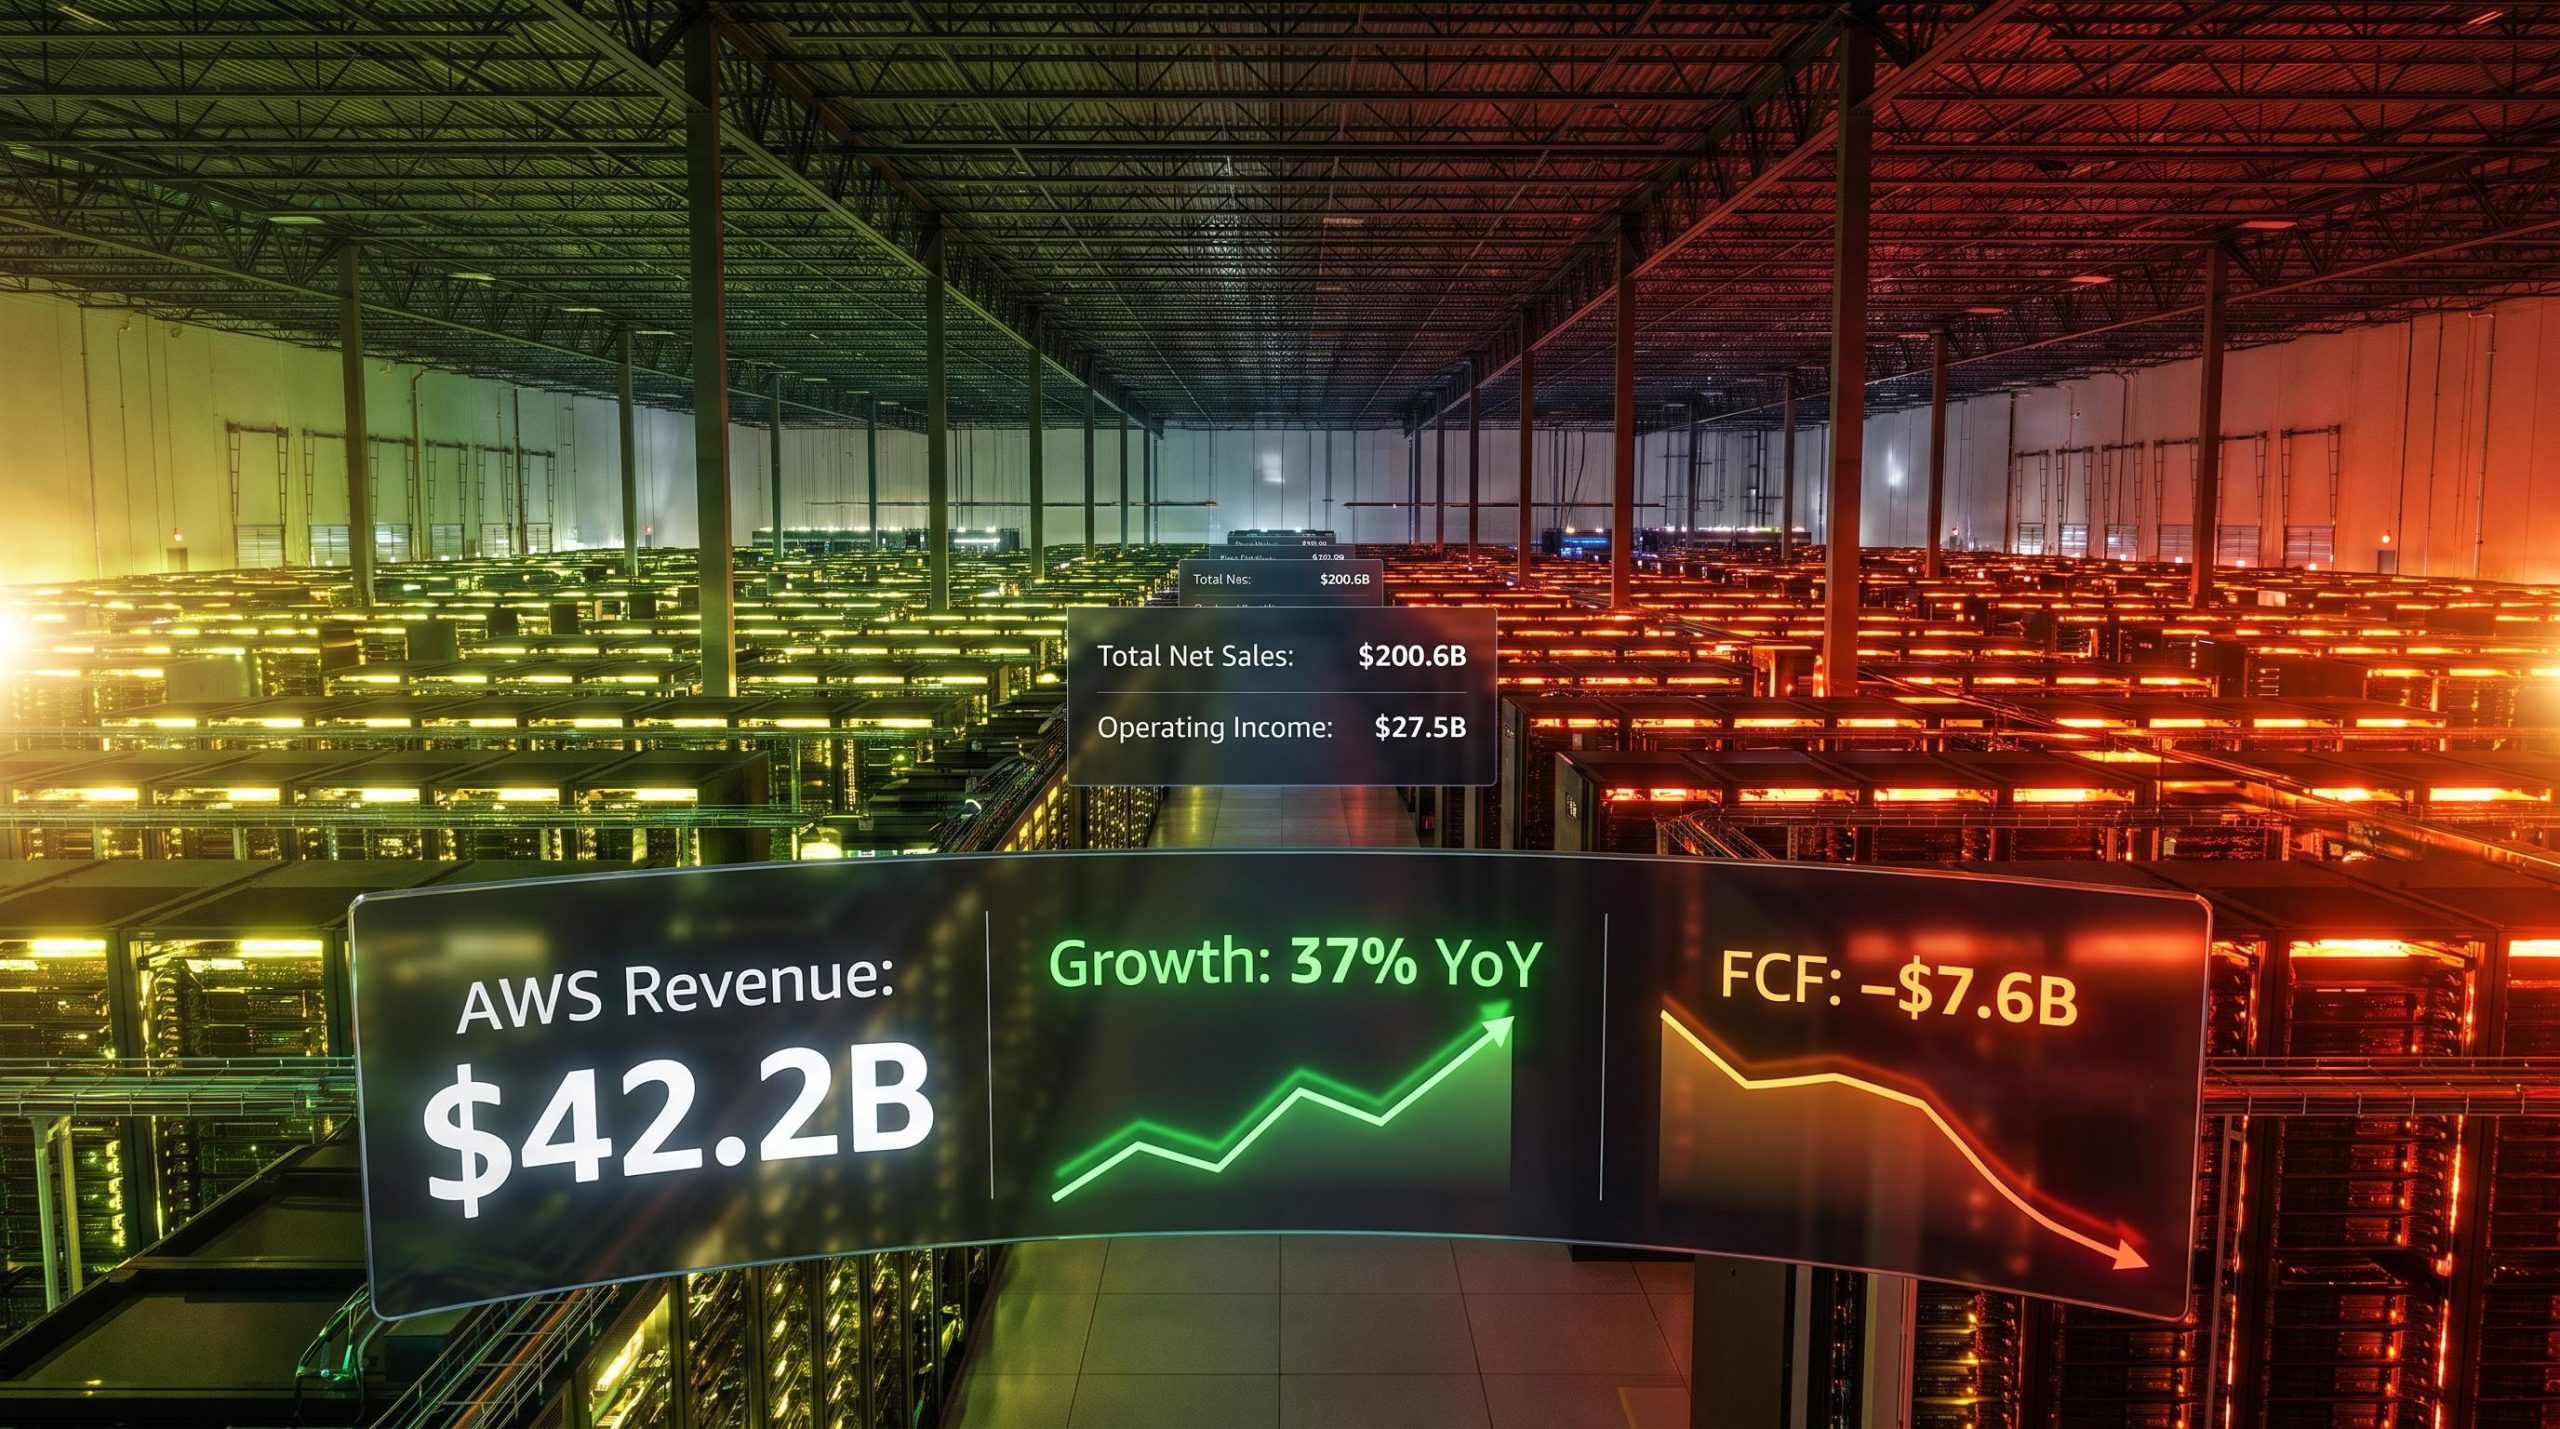
Amazon just crossed $200 billion in quarterly revenue for the first time. AWS grew 37% year over year at a scale where that growth rate should be mathematically implausible. And the company simultaneously burned through free cash flow at a pace that would alarm investors in almost any other sector.
All three of those statements are true at the same time.
The Q2 2026 results, released after U.S. market close on 31 July 2026, force a specific analytical question: when the income statement and the cash flow statement tell completely different stories about the same business, which one is telling the truth about long-term value? The answer depends less on the raw numbers than on how you interpret Amazon’s historical pattern of deliberate capital allocation and the structural realities of competing at the AI infrastructure frontier.
Here is the framework for deciding which camp you belong to, grounded in the actual figures from this quarter. The focus is on three things: what the AWS growth rate signals about demand durability, what the free cash flow reversal means about capital risk, and what metrics over the next two to three quarters will tell you whether the investment thesis is playing out.
A record quarter with an asterisk on the bottom line
The headline numbers earned their superlatives:
- Total net sales: $200.6 billion, up 20% year over year from $167.7 billion
- AWS revenue: $42.2 billion, up 37% year over year, implying an annualised run rate of approximately $169 billion
- Consolidated operating income: $27.5 billion, up 43% from $19.2 billion in Q2 2025
Then there is net income. The reported figure was $62.6 billion, a number that looks extraordinary until you strip out approximately $53.4 billion in non-operating pre-tax gains, driven primarily by the revaluation of Amazon’s investment in Anthropic.
The $62.6 billion net income headline includes investment gains that will not recur in the same form quarter to quarter. Operating income of $27.5 billion is the more reliable lens for assessing underlying earnings power.
If you anchor to the net income figure, you will overstate what the operating business actually produced this quarter and potentially overprice what the results justify. Operating income is the number that matters for valuation work.
When big ASX news breaks, our subscribers know first
Why AWS growing 37% at $42 billion in quarterly revenue changes the valuation conversation
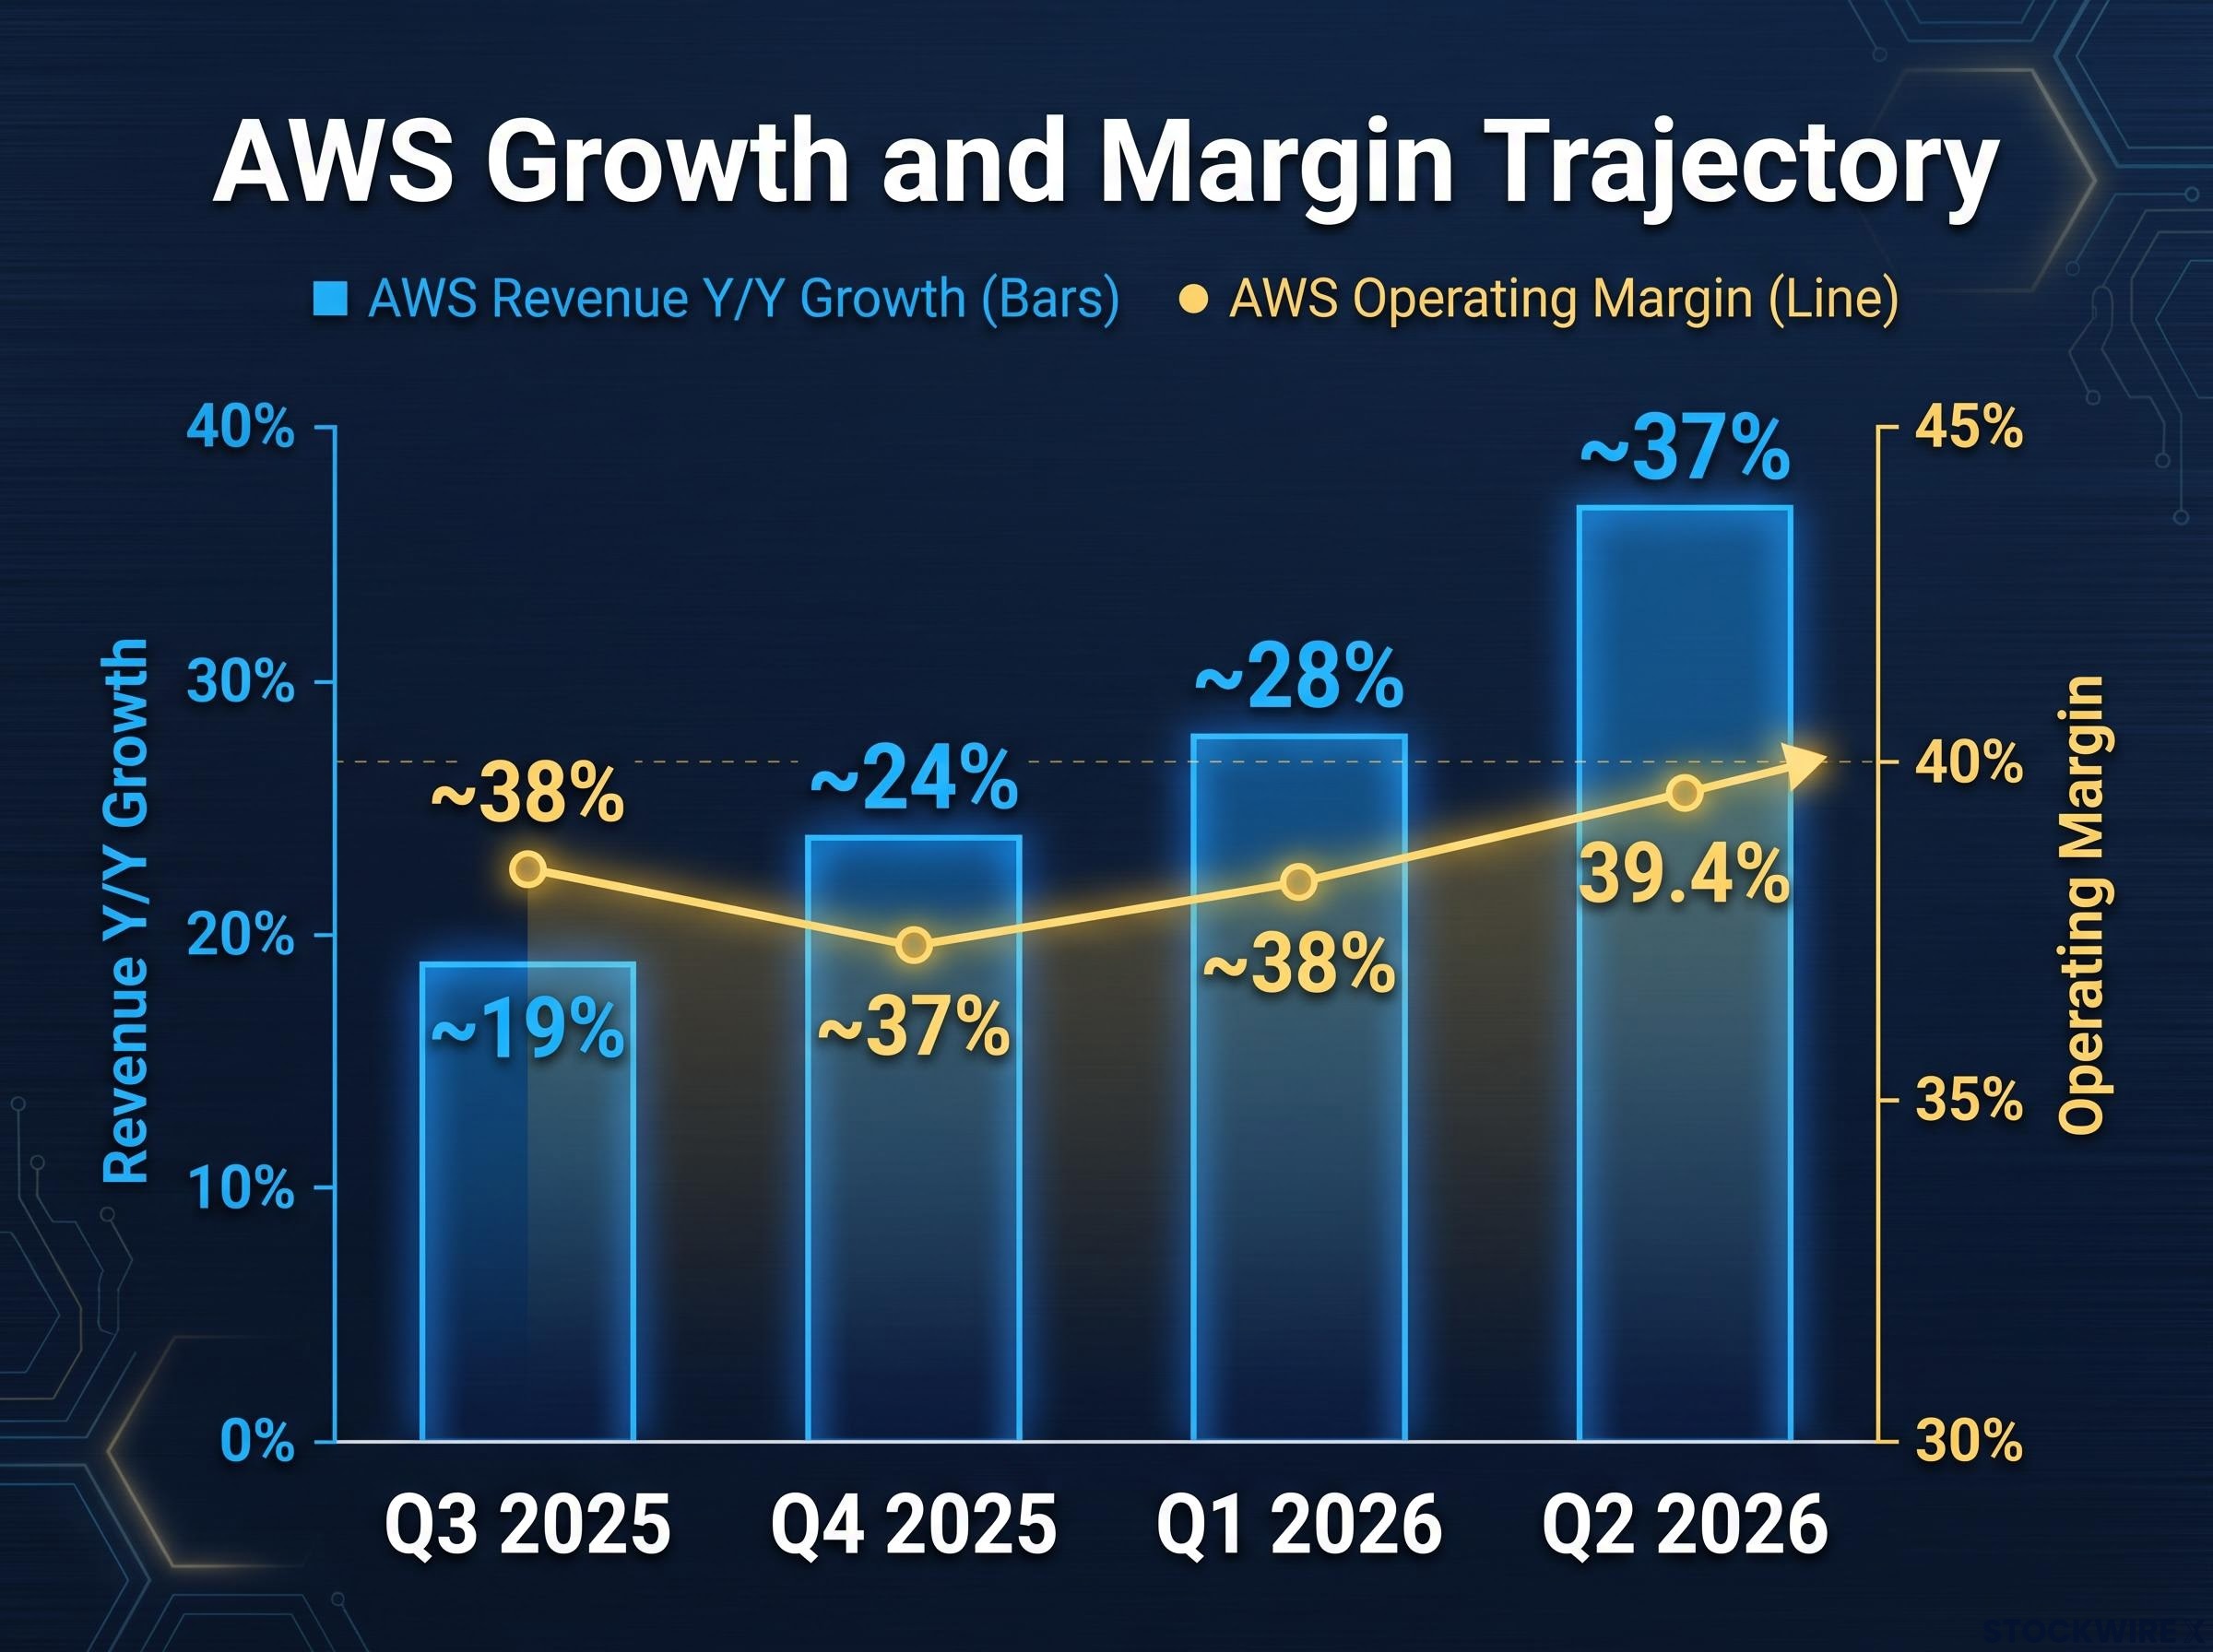
The growth rate alone would be noteworthy. What makes it analytically significant is the acceleration. AWS grew approximately 28% in Q1 2026. One quarter later, on a base exceeding $40 billion, the rate jumped to 37%, the fastest pace in 18 quarters.
AWS contributed approximately 60% of consolidated operating income despite representing roughly one-fifth of total revenue. Its operating margin expanded to 39.4%, producing $16.6 billion in operating income. Margins expanded even as capital expenditures rose sharply, which tells you the revenue is scaling faster than the cost base.
Management cited AI workloads and core enterprise cloud migration as dual drivers of the acceleration. That combination matters because it means the growth is not solely dependent on one demand source.
| Quarter | AWS Revenue (Y/Y Growth) | AWS Operating Margin |
|---|---|---|
| Q3 2025 | ~19% | ~38% |
| Q4 2025 | ~24% | ~37% |
| Q1 2026 | ~28% | ~38% |
| Q2 2026 | ~37% | ~39.4% |
The acceleration from 28% to 37% growth on a $40 billion-plus quarterly base is the single most important data point in this earnings report for a long-term investor. It means the addressable market for cloud and AI services is growing faster than many models assumed.
The Q2 acceleration did not emerge in isolation: hyperscaler earnings from Q1 2026 had already revealed a 93% surge in AWS backlog and a Goldman Sachs warning that reported Big Tech profit growth was being partially inflated by mark-to-market equity gains rather than core cloud operations.
The $1 trillion vision: management conviction or aspirational framing?
CEO Andy Jassy expressed confidence that AWS could ultimately reach $1 trillion in annual revenue, though without specifying a timeline. This is a management vision, not formal guidance or a financial forecast. Its primary investment function is signalling that management believes the AI and cloud addressable market justifies years of elevated capital commitment.
What cloud infrastructure actually costs at the AI frontier
Strong operating cash flow and negative free cash flow can coexist in the same business without contradiction. Operating cash flow measures the cash a business generates from its core operations. Free cash flow subtracts capital expenditures from that figure. When capex grows faster than operating cash flow, free cash flow turns negative, regardless of how healthy the underlying business is.
That is exactly what happened this quarter. The specific numbers make the mechanics concrete:
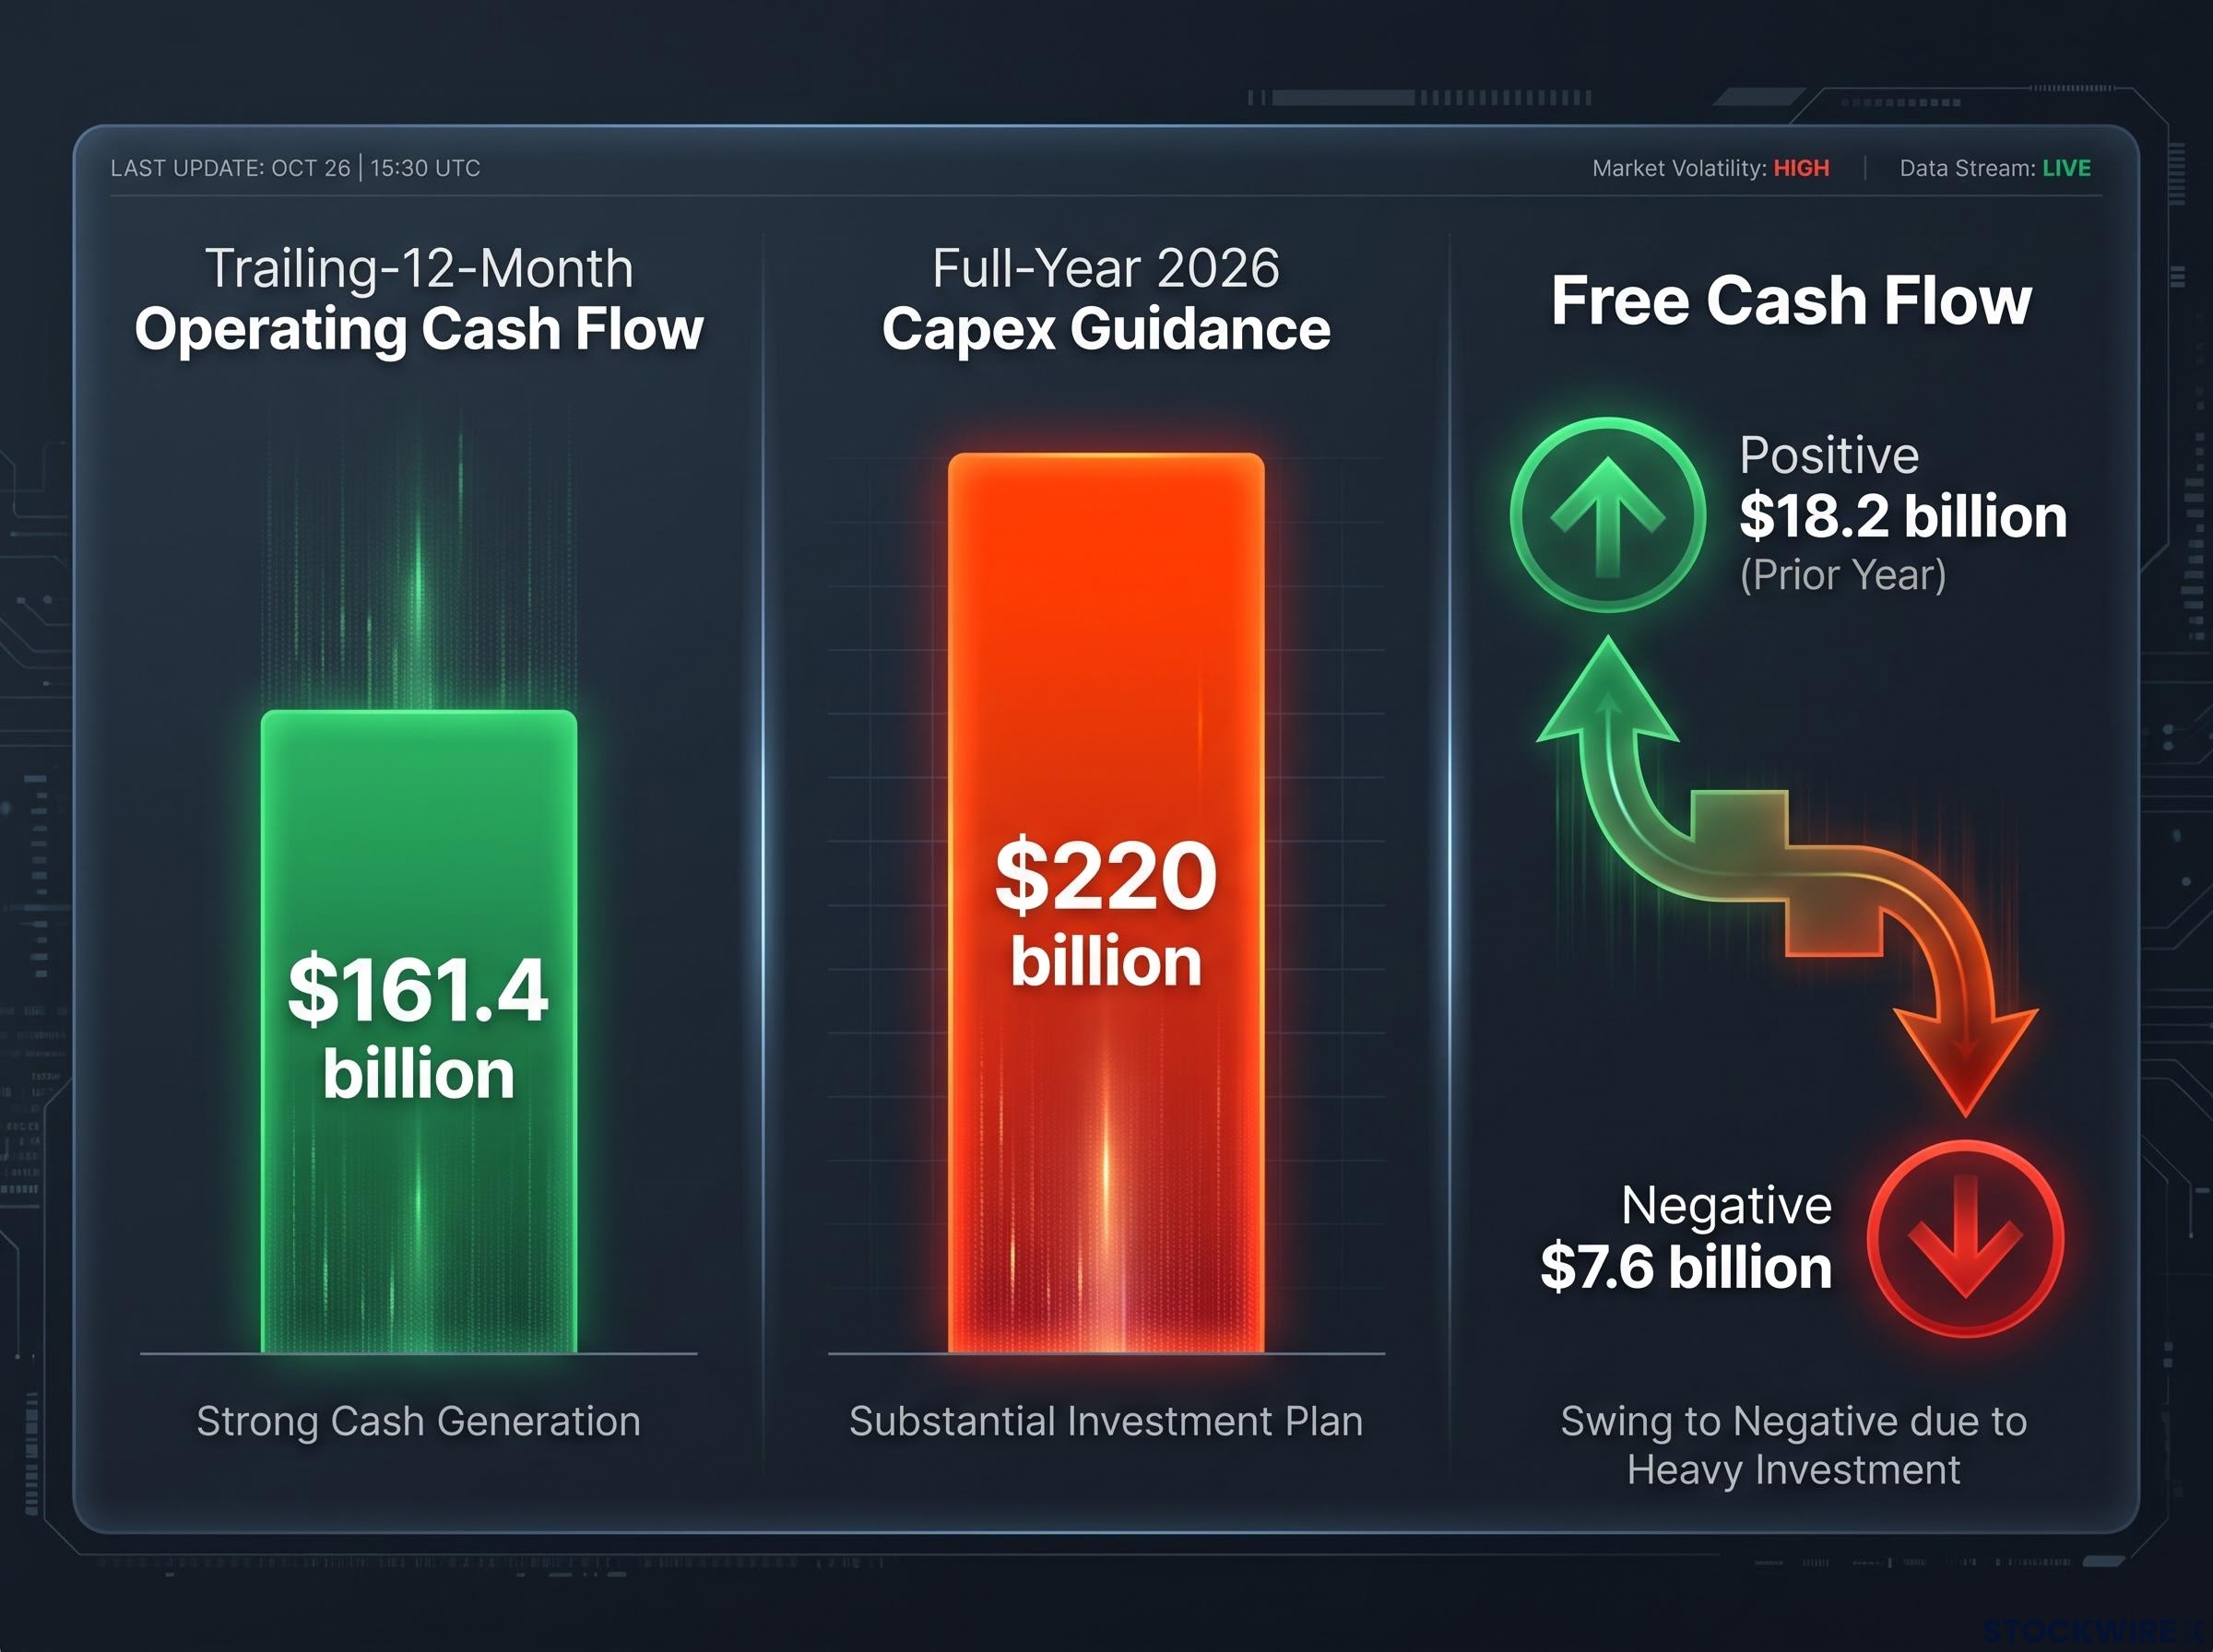
- Trailing-twelve-month operating cash flow: $161.4 billion, up 33% year over year
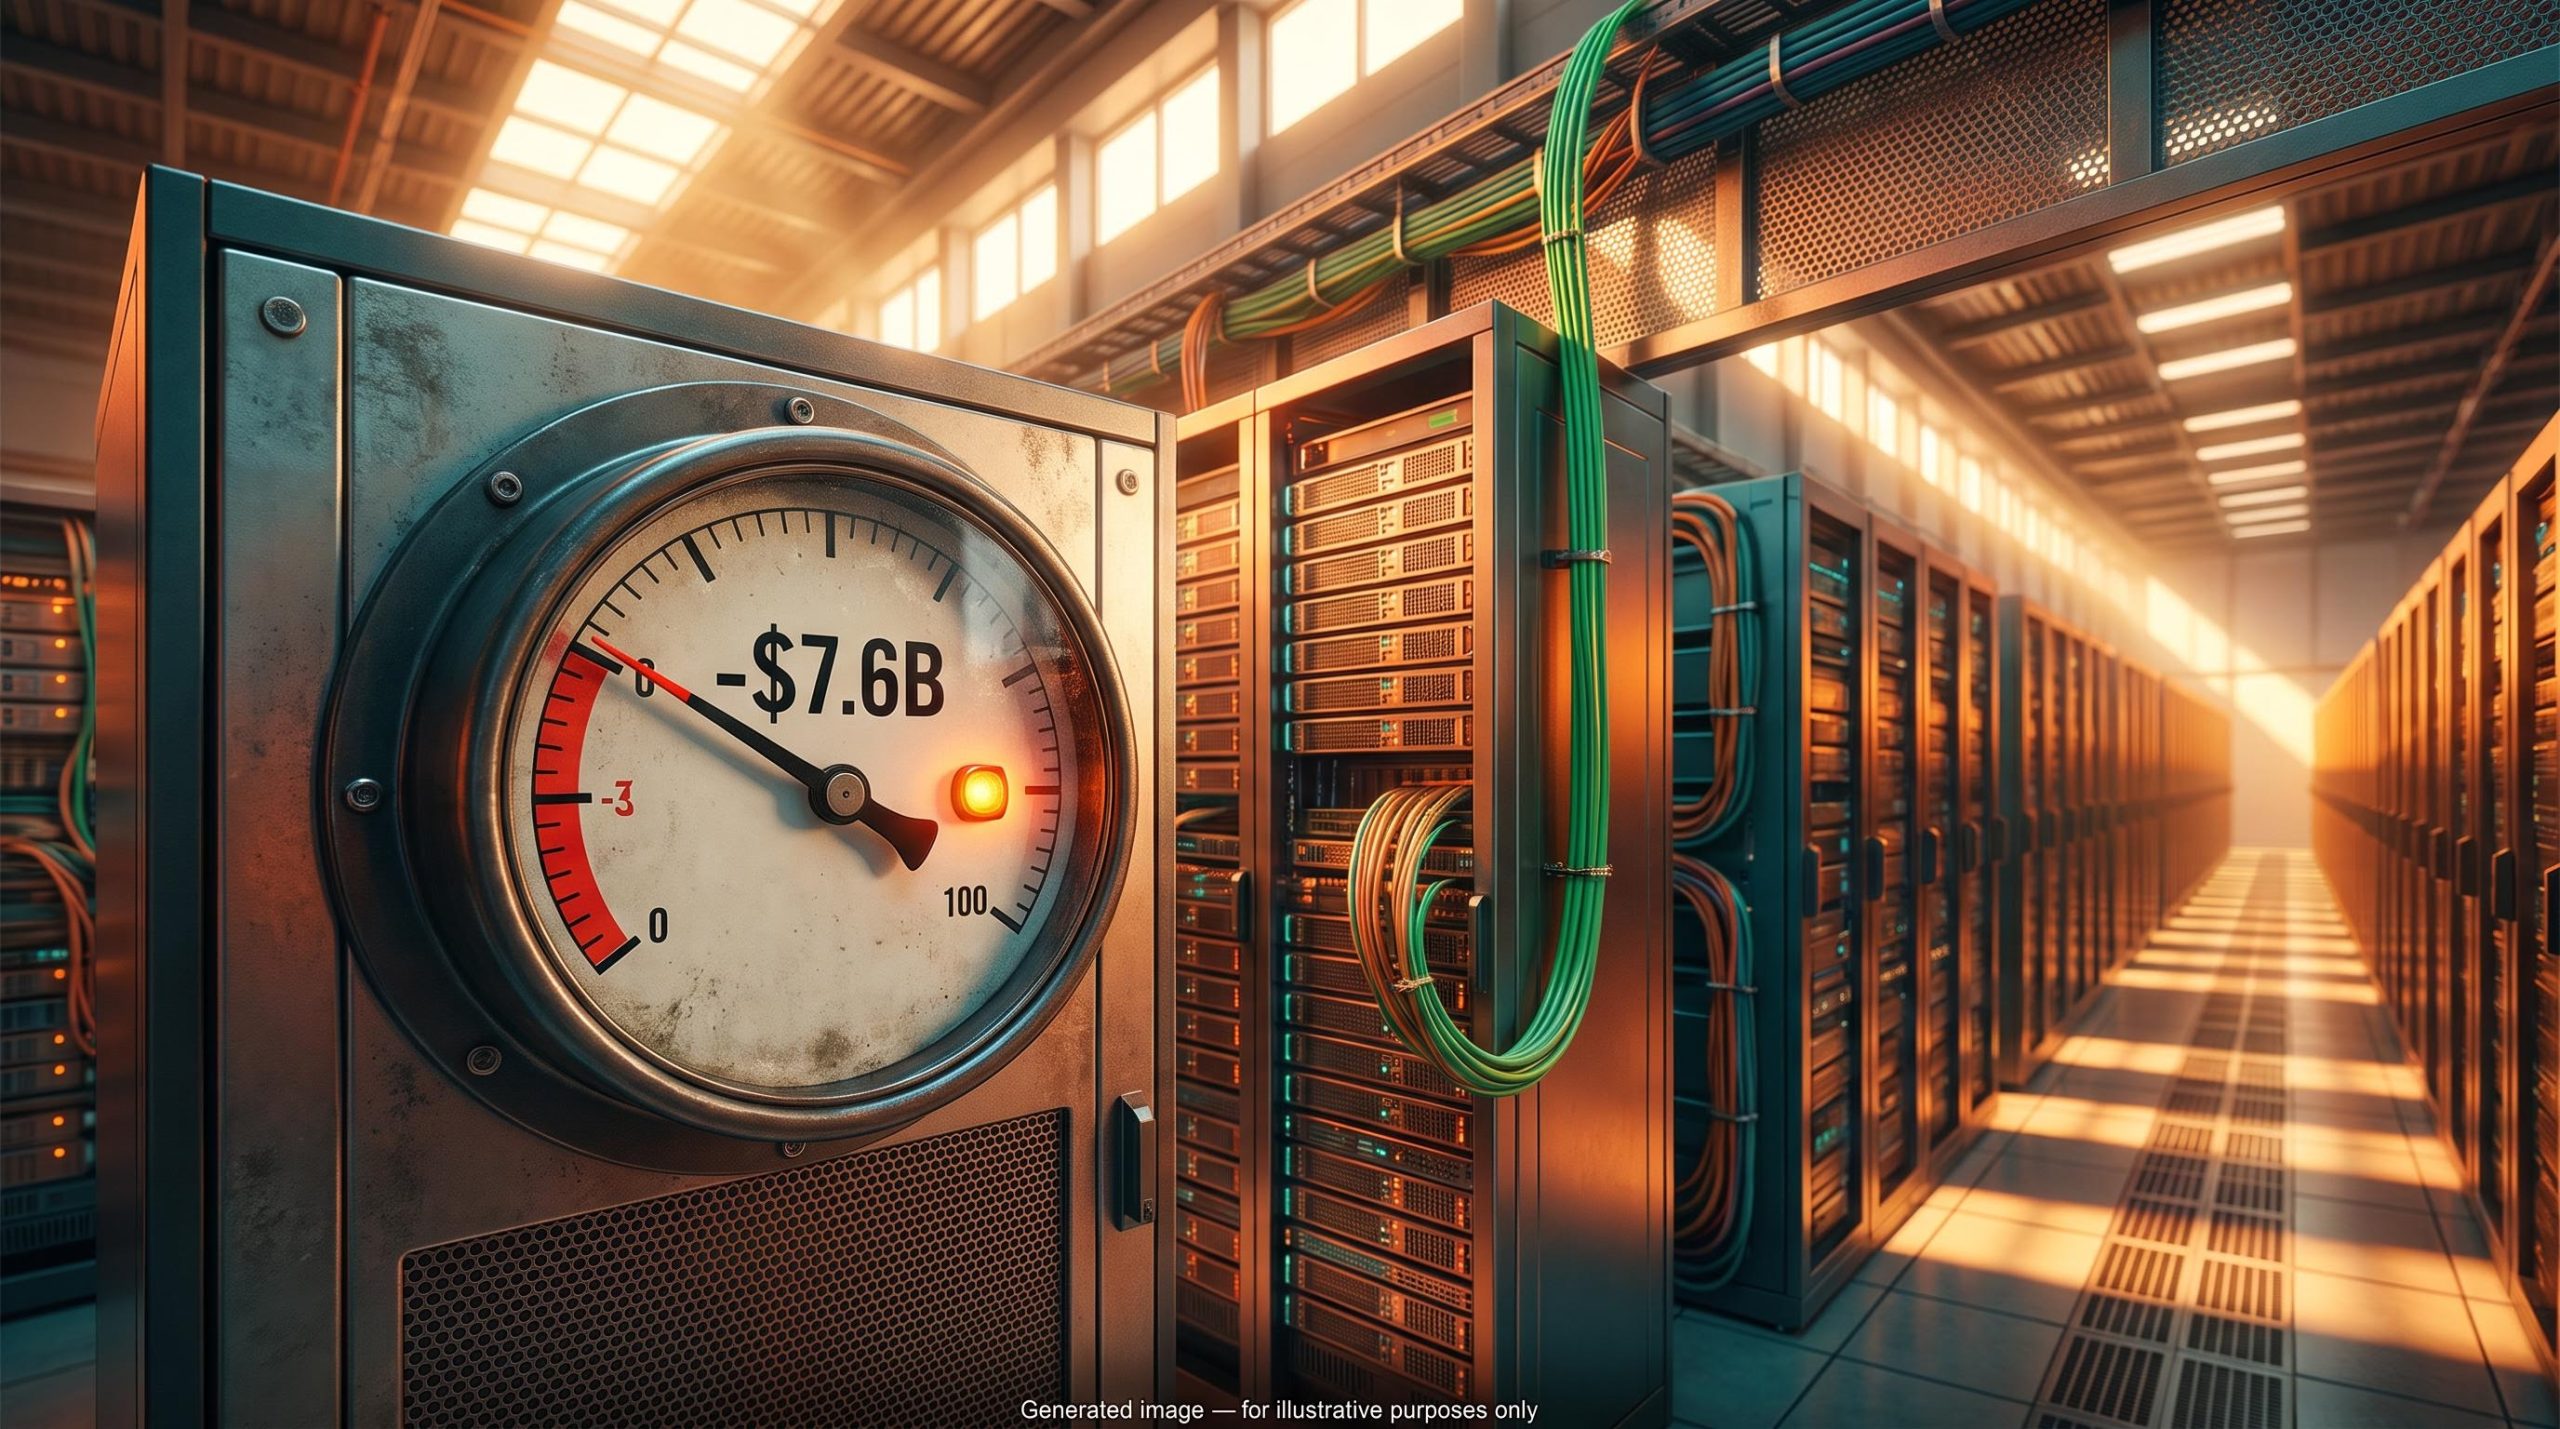
- Trailing-twelve-month free cash flow: negative $7.6 billion, compared to positive $18.2 billion in the prior year period
- Year-over-year FCF swing: approximately $25.8 billion in deterioration
- Q2 capital expenditures alone: $54.2 billion, up 68% year over year
- Full-year 2026 capex guidance: approximately $220 billion, raised from a prior estimate of approximately $200 billion
A note on data precision: Analysts at Vital Knowledge cited negative $9 billion for trailing-twelve-month free cash flow. Amazon’s official earnings release reports negative $7.6 billion. Both confirm the directional swing to negative FCF. If you are referencing analyst commentary, be aware of the discrepancy against the company’s own reported figure.
Management raised capex guidance by $20 billion rather than trimming spending in response to rising component costs, citing higher memory chip prices alongside continued data centre, networking, and custom silicon buildout. That is a signal of conviction, and a clear indication that capital intensity at the AI frontier has exceeded earlier expectations.
Synergy Research Group hyperscaler capex projections indicate that combined capital expenditures across the largest cloud operators are on track to exceed $600 billion in 2026, contextualising Amazon’s $220 billion commitment as proportional to the industry arms race rather than anomalous within it.
The shift from positive $18.2 billion FCF to negative $7.6 billion in one year is the number that separates investors comfortable with Amazon’s historical reinvestment cycles from those whose risk framework requires near-term cash return visibility. Conflating negative free cash flow with business deterioration is the most common analytical error in covering Amazon’s investment phases. The negative FCF is a deliberate allocation choice, not a collapse of the core business.
The broader AI capital cycle context matters here: hyperscaler capital expenditure is projected to consume approximately 94% of operating cash flow in 2026, compared with a historical average of around 40%, a compression ratio that reframes the negative FCF reading at Amazon as sector-wide rather than company-specific.
This article is for informational purposes only and should not be considered financial advice. Investors should conduct their own research and consult with financial professionals before making investment decisions.
The bull case and the bear case, without the sales pitch
The investment case rests on three specific pillars. AWS growth at 37% on a $169 billion annualised run rate confirms capacity is being absorbed, not sitting idle. Amazon’s track record of heavy investment phases in logistics, Prime, and the initial AWS buildout produced durable cash-generating businesses each time. And the path-dependence argument is real: falling behind Microsoft Azure and Google Cloud in AI infrastructure now could create a structural deficit that becomes prohibitively expensive to close later.
Strong results from Microsoft, reported before Amazon’s earnings, bolstered the case that enterprise demand for AI infrastructure remains robust, lifting sentiment across the cloud sector more broadly.
Azure revenue surpassing $100 billion in Microsoft’s fiscal year 2026, with growth accelerating to 43%, provides direct confirmation that enterprise AI and cloud demand is structurally strong across the sector, not a demand story unique to AWS.
| Investment Case | Risk Factor |
|---|---|
| 37% AWS growth confirms demand is real and capacity is being utilised | AI infrastructure payback horizon is less well-mapped than prior Amazon cycles |
| Historical reinvestment cycles have produced durable cash-generating businesses | Competitive intensity from Azure and Google Cloud may compress margins over time |
| Falling behind in AI infrastructure now creates a structural competitive deficit | Market expectations are elevated after positive post-earnings sentiment |
Why this cycle differs from prior Amazon investment phases
Three structural differences separate this capex cycle from earlier ones. The scale is an order of magnitude larger, with $220 billion committed for a single year. Input cost inflation, particularly in memory chips, is simultaneously compressing near-term returns in a way that logistics buildout did not face. And the competitive set is more formidable: Azure, Google Cloud, and a growing roster of specialised providers are all spending at similar intensity, which may limit the margin advantage that earlier Amazon investment phases enjoyed.
Amazon’s elevated memory chip cost exposure sits alongside a longer-term chip strategy: custom silicon programmes at Alphabet, Amazon, and Microsoft are most competitive precisely in the inference segment projected to represent approximately 80% of the AI accelerator market by 2030, a dynamic that could partially offset rising third-party chip input costs over time.
Reports that hedge fund Situational Awareness liquidated a substantial share of its public equity positions ahead of the reporting period were characterised as technical in nature rather than fundamental. Results from Meta Platforms left questions unresolved about whether the magnitude of AI capital spending across major technology companies is fully justified by near-term returns.
Whichever side of this debate you land on, the key variable is not this quarter’s results but the rate at which FCF normalises over the next six to eight quarters. That forward variable deserves more weight in your analysis than the current negative number.
Three metrics that will resolve this debate before 2027
- Free cash flow trajectory. Whether trailing-twelve-month FCF starts to stabilise or improve as Q3 and Q4 2026 are reported is the primary signal. Watch both absolute capex levels and any management commentary on the timing of normalisation. The current baseline: negative $7.6 billion against $220 billion in committed full-year spending.
- AWS growth rate and margin sustainability. The threshold to monitor is whether AWS can sustain growth above 30% as the quarterly base scales beyond $42.2 billion, and whether operating margins hold in the mid- to high-30s under competitive and cost pressure. The current baseline: 39.4% operating margin.
- AI service unit economics. This is the least disclosed metric but ultimately the most important. Whether AI workloads are structurally higher-margin or lower-margin than traditional cloud workloads, after accounting for elevated chip and capex costs, will determine the long-term shape of AWS’s profitability.
Management has cited AI service and custom chip run rates exceeding $25 billion. This figure has not been independently confirmed in public filings and should be treated with appropriate caution until verified.
If AWS margins compress below 35% while FCF remains deeply negative in Q3 and Q4 2026, the bull case weakens materially. If margins hold and FCF begins to stabilise, the investment cycle is behaving as management has projected. 2027 is the first realistic inflection point for spending normalisation based on the current trajectory.
Investors who track these three metrics across the next two earnings cycles will have a substantially clearer read on whether Amazon’s AI infrastructure bet is compounding or overbuilt, before the broader market reaches a consensus.
For investors wanting to build a formal valuation framework around the FCF recovery timeline, our dedicated guide to intrinsic value estimation covers DCF mechanics, terminal value sensitivity, and margin of safety construction, with worked examples directly applicable to capital-intensive businesses with back-loaded cash return profiles.
Past performance does not guarantee future results. Financial projections are subject to market conditions and various risk factors.
Where the weight of evidence sits heading into Q3 2026
The Q2 2026 results confirm that AWS demand is real, accelerating, and margin-accretive at scale. That makes the capex commitment look rational given competitive dynamics. The unresolved question is the timing and magnitude of the FCF recovery: $161.4 billion in trailing operating cash flow alongside negative $7.6 billion FCF, with $220 billion in capex committed for the full year.
For multi-year investors who accept back-loaded cash returns and trust Amazon’s reinvestment track record, the quarter reinforces the long-term bull case. For investors requiring near-term FCF visibility or sceptical of AI infrastructure monetisation timelines, the same quarter highlights non-trivial deferred risk. AWS producing approximately 60% of operating income from approximately 20% of revenue at a 39.4% margin is the foundation both camps are building from; where they diverge is on the payback timeline.
2027 represents the first realistic point at which the market will assess whether the current capex cycle is producing the expected operating leverage and FCF recovery. The next two earnings releases, not this one, are where the investment thesis will be made or tested. Treating Q2 2026 as a definitive verdict in either direction will likely lead to mispositioning.