
How Hormuz Closure at $104 Oil Is Reshaping Every Asset Class
5 hrs ago

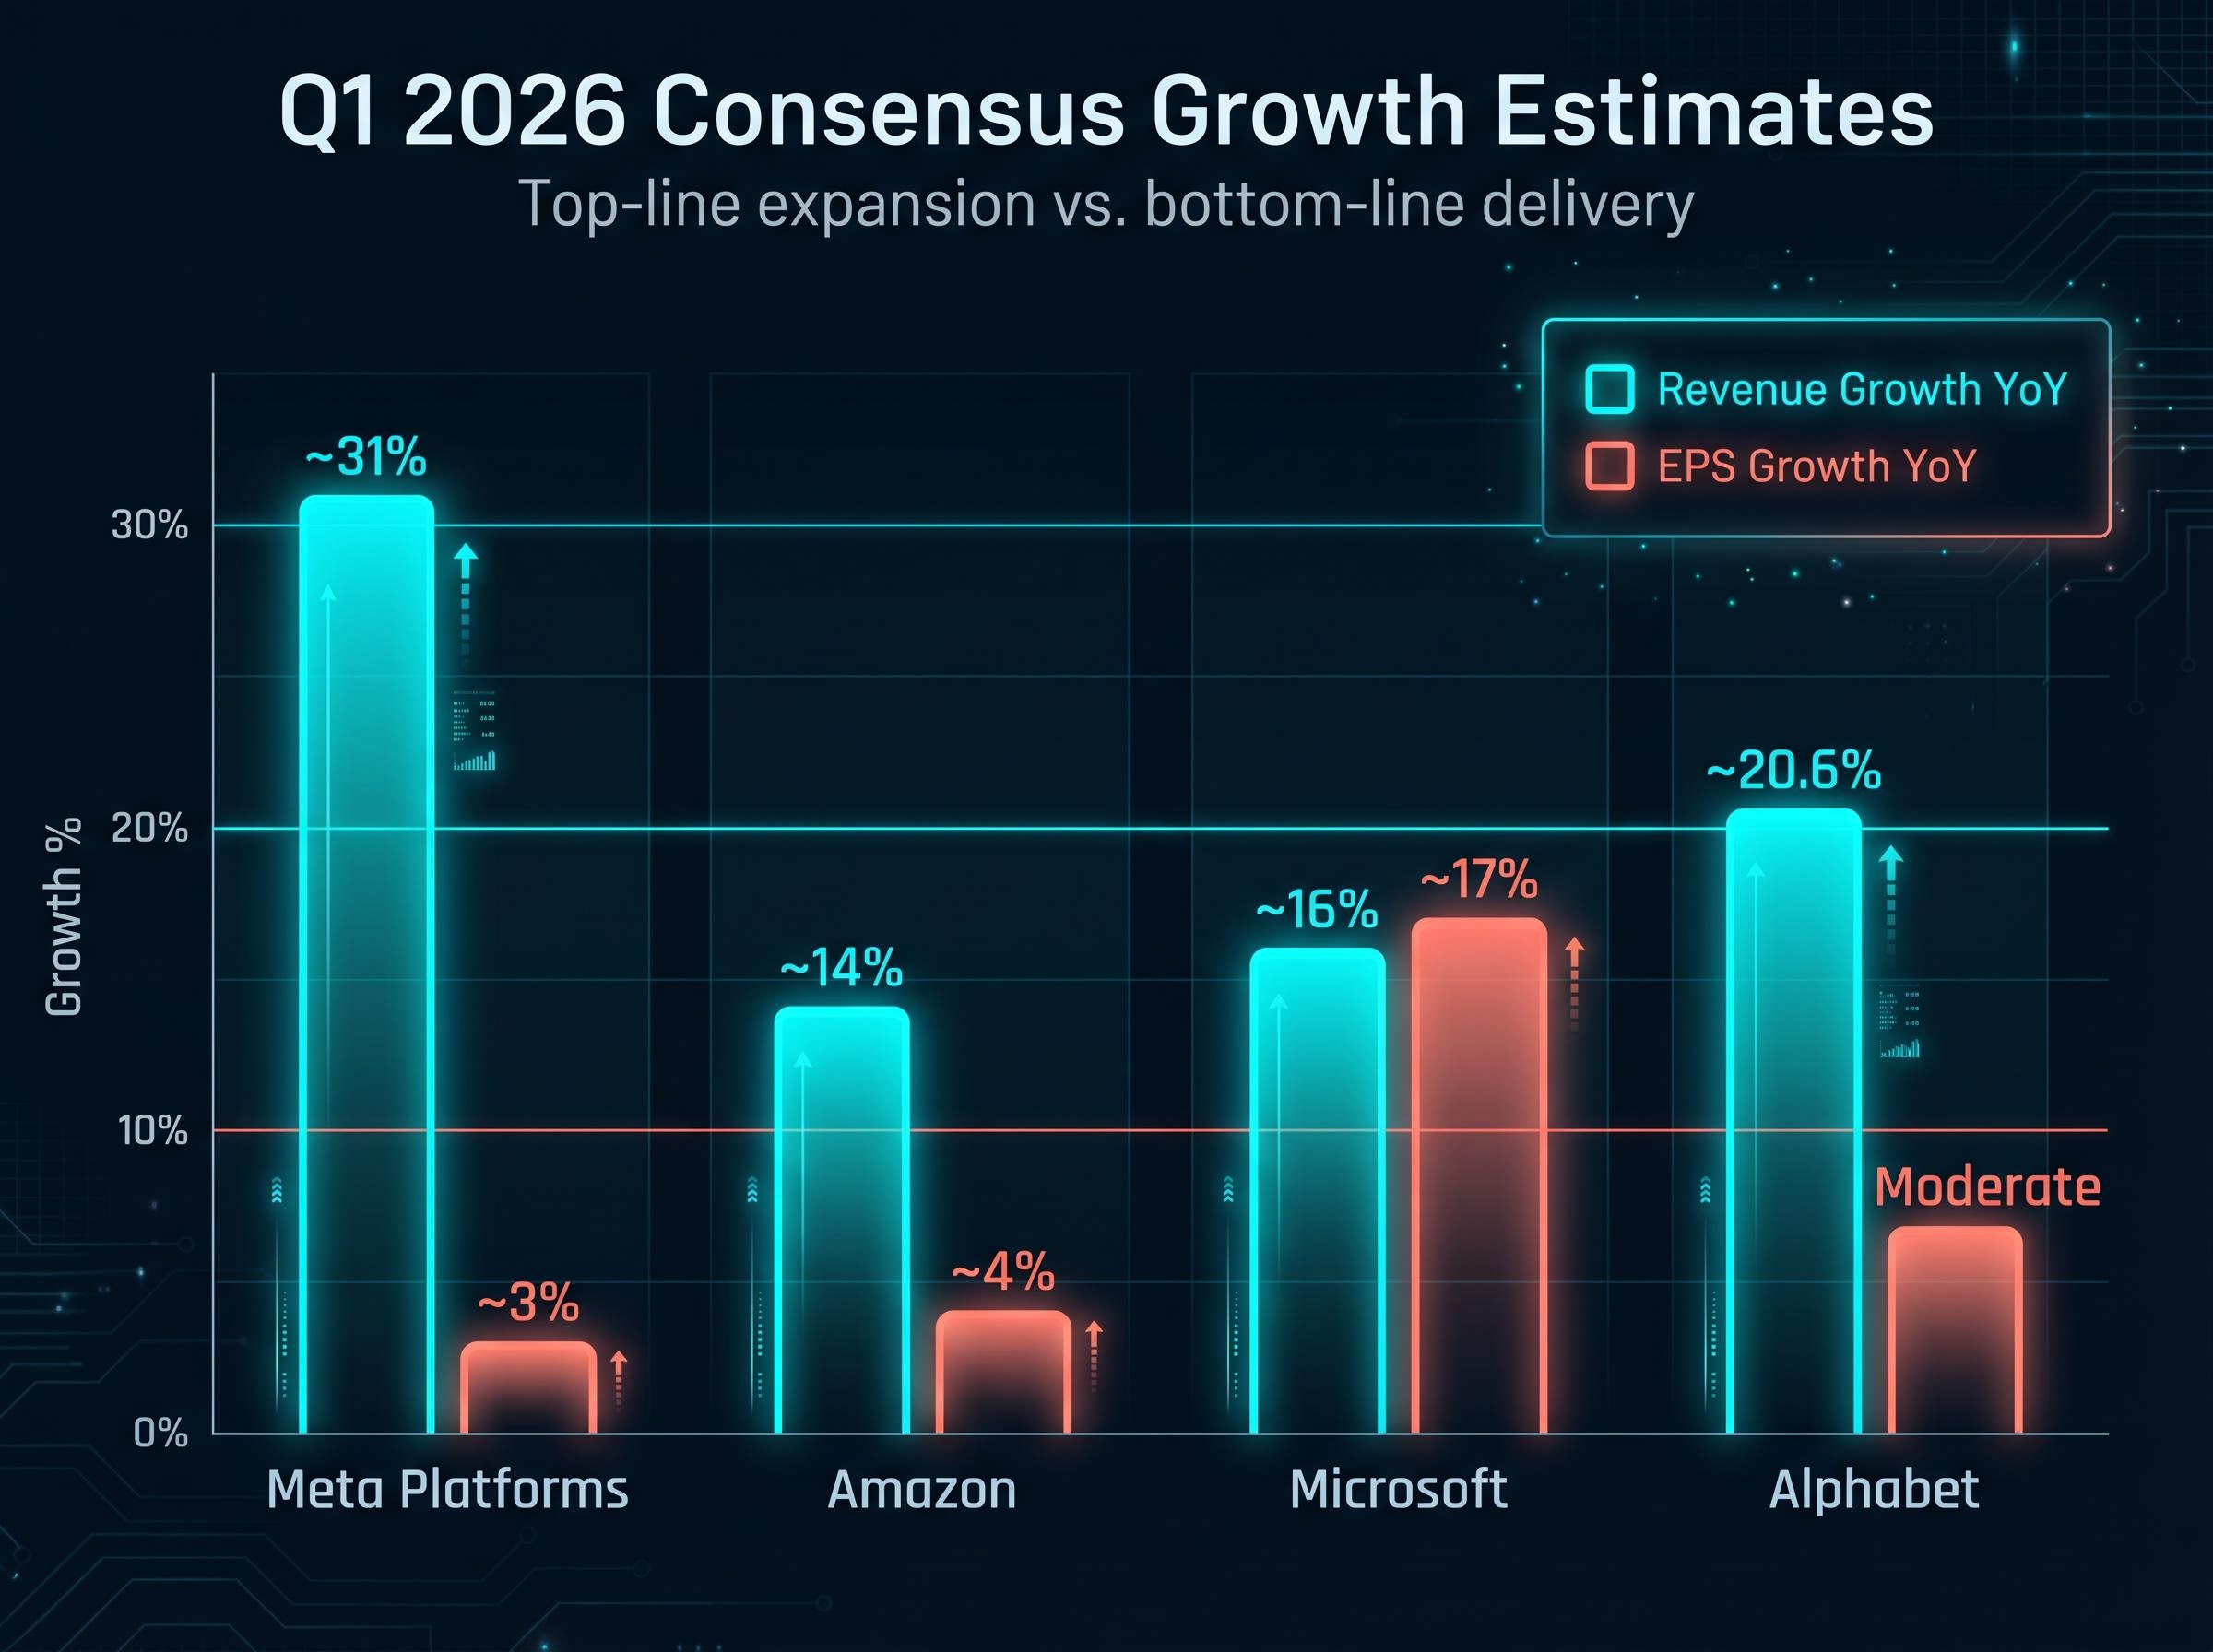
“`json { “fact_checked_full_article”: “Four stocks. One Tuesday evening. More than 18% of the S&P 500 on the line. After the market close on 29 April, Alphabet, Meta Platforms, Amazon, and Microsoft all report quarterly earnings simultaneously, creating one of the most concentrated reporting events of 2026. All four are Magnificent Seven members. All four are deep into multi-hundred-billion-dollar AI infrastructure buildouts. And all four face the same question heading in: are the astronomical capital expenditures generating returns fast enough? This preview breaks down each company’s consensus estimates, the specific metrics investors are watching, the AI capex dynamic compressing earnings per share (EPS) despite strong top-line growth, and what the collective result could mean for broader market sentiment on Wednesday morning.\n\n## Why this single Tuesday evening could move the entire market\n\nThe combined S&P 500 index weighting of these four companies exceeds 18%. For any investor holding a broad index fund, that is not an abstraction. It is a direct portfolio exposure that reprices in a single after-hours session.\n\n> More than 18% of the S&P 500 by index weight reports earnings on the same evening. There is no sequential absorption; all four reactions hit the market at once.\n\nThe timing compounds the stakes. Because all four report simultaneously, there is no opportunity for the market to digest one result before processing the next. Sentiment arrives as a wall, not a sequence. With the S&P 500 at 7,167.70 and the Nasdaq Composite at 24,825.74 as of 27 April, both indices sit at elevated levels where a broad repricing carries amplified consequences.\n\nThe Magnificent Seven cohort is expected to deliver Q1 2026 earnings growth of +22.8%, according to FactSet. The broader S&P 500 blended consensus sits at +15.1%. Tuesday’s results will determine whether that growth premium holds, or whether the gap between big tech’s ambitions and its near-term profitability begins to narrow.\n\n## What the numbers say: consensus estimates for all four companies\n\nRevenue growth across all four companies is expected to be strong. EPS growth is where the picture fractures.\n\nMeta Platforms carries the highest projected revenue growth at approximately 31% year on year, yet consensus EPS growth is only around 3%. That gap, nearly 28 percentage points of divergence between top-line expansion and bottom-line delivery, is the central analytical tension heading into Tuesday.\n\nAmazon shows a similar pattern: roughly 14% revenue growth paired with approximately 4% EPS growth. Microsoft is the outlier, with an EPS growth rate of approximately 17% that more closely tracks its 16% revenue expansion. Alphabet falls between the extremes, with revenue growth of roughly 20.6%.\n\n
| Company | Revenue Estimate | Revenue Growth YoY | EPS Estimate | EPS Growth YoY |
|---|---|---|---|---|
| Alphabet | $92.22B | ~20.6% | $2.67 | Moderate |
| Meta Platforms | $55.49B | ~31% | $6.67 | ~3% |
| Amazon | $177.2B | ~14% | $1.63 | ~4% |
| Microsoft | $81.42B | ~16% | $4.07 | ~17% |
\n
\n\nThe sharpest revenue-to-EPS divergence belongs to Meta, where the gap signals that massive spending is absorbing the majority of incremental revenue before it reaches earnings. Amazon follows closely. The explanation for both sits in the same place: AI infrastructure capital expenditure.\n\n## The AI capex pressure: why record revenues are not translating to record profits\n\nA company can grow revenue by 31% and still deliver near-flat EPS. The mechanics are straightforward: when a business front-loads hundreds of billions of dollars into data centres, AI chips, and energy infrastructure, those costs flow through the income statement as depreciation and operating expenses. Revenue climbs. Margins compress. EPS stalls. This is not a sign of operational failure. It is a deliberate infrastructure cycle where the spending precedes the monetisation by quarters or years.\n\n> Combined big tech capital expenditure for 2026 is estimated at approximately $650 billion, according to Yahoo Finance.\n\nThe individual commitments reinforce the scale:\n\n- Amazon has committed to $200B in full-year 2026 capital expenditure. CEO Andy Jassy has stated that near-complete customer commitments already support this spend level.\n- Microsoft’s Azure AI Services consensus revenue for FY2026 sits at $23.4B, up from $18.8B in January 2026, reflecting approximately 25% upward revision in analyst expectations since early 2025.\n- Meta’s Reality Labs division is expected to post operating losses of approximately $19B for FY2026, with a quarterly run rate of roughly $5.0B in Q1.\n- Amazon’s AI chip division has reached a $50B annual run rate, with year-on-year growth exceeding 100%, according to CEO Andy Jassy.\n\nWithout understanding this dynamic, a retail investor could look at Meta’s 3% EPS growth and conclude the business is deteriorating. The opposite interpretation, that disciplined investment in future infrastructure is temporarily compressing earnings, may be closer to the mark. The market is not pricing current-quarter profits. It is pricing whether the AI monetisation curve will eventually justify the spend. That is why management guidance and forward commentary, rather than backward-looking EPS, will determine the after-hours reaction.\n\n## Company by company: the specific metrics and storylines that matter most\n\nThe AI capex theme unifies all four companies. But each has a distinct swing variable that could determine whether its stock moves higher or lower after the close.\n\n### Alphabet\n\nThe $32B acquisition of cloud security firm Wiz positions Google Cloud’s expanding enterprise strategy as the primary watch item. Investors need to see cloud revenue acceleration that validates the spend.\n\n- Cloud revenue growth rate and early Wiz integration commentary\n- The existing approximately 14% stake in Anthropic, with a planned additional $40B investment, and any signals on Anthropic’s potential IPO timeline\n- Search AI monetisation impact on core advertising revenue\n\n### Meta Platforms\n\nMeta enters Tuesday with the strongest projected revenue growth of the group, yet retail investor sentiment remains notably cautious. That disconnect creates a potential positive-surprise dynamic.\n\n- Muse Spark AI model launch and its competitive positioning against rival platforms\n- Margin impact from the 10% workforce reduction (approximately 8,000 positions) announced earlier this year\n- Reality Labs loss trajectory and whether management maintains or adjusts FY2026 guidance; Family of Apps operating income consensus sits at approximately $108.7B\n\n### Amazon\n\nCEO Andy Jassy’s shareholder letter defended the $200B capital expenditure commitment. Tuesday’s results need to show the returns materialising.\n\n- AWS AI workload growth and whether the cloud re-acceleration narrative holds\n- AI chip division performance against the $50B run rate with over 100% year-on-year growth\n- The $10.8B Globalstar acquisition and its rationale as a consumer-touchpoint expansion\n\n### Microsoft\n\nMicrosoft carries the most resilient EPS profile of the group heading in, with stock performance of approximately +1.6% since its January earnings report.\n\n- Copilot monetisation performance, reportedly outperforming internal expectations after transitioning to a paid model\n- Azure AI Services growth rate versus the 25% upward revision in analyst expectations\n- Revised OpenAI partnership terms and their implications for cost structure going forward\n\n## What options markets are pricing and what that means for volatility on Wednesday\n\nOptions markets quantify the risk that headline figures cannot. An implied move represents the percentage swing that options traders collectively expect a stock to make following its earnings report. It is derived from the price of options contracts expiring shortly after the announcement and reflects the market’s best estimate of near-term volatility.\n\n- An implied move of plus or minus 7.3% on a stock trading at $675 means the market is pricing in a potential swing of roughly $49 per share in either direction.\n- For a stock at $263, the same 7.3% implies approximately $19 per share of overnight risk.\n\nBecause all four companies report simultaneously, there is no sequential absorption. The cumulative index-level impact could be amplified rather than staggered.\n\n
| Company | Price (27 April) | Implied Move | Implied Range | YTD Performance |
|---|---|---|---|---|
| Alphabet (GOOGL) | $353.00 | ±5.59% | $333-$373 | +18.5% |
| Meta (META) | $675.22 | ±7.3% | $626-$724 | +27.3% |
| Amazon (AMZN) | $263.07 | ±7.3% | $244-$282 | +14.2% |
| Microsoft (MSFT) | $424.53 | ±6.7% | $396-$453 | +11.6% |
\n
\n\nSource: TipRanks options volatility report, 27 April to 1 May 2026.\n\nFor a retail investor deciding whether to hold, trim, or add to any of these positions before Tuesday’s close, the implied move data represents the market’s best estimate of the overnight risk being assumed.\n\n## Conclusion\n\nThis is not four separate earnings reports. It is a single referendum on whether the AI infrastructure supercycle is on track, delivered simultaneously by the four companies most responsible for funding it.\n\nTwo scenarios frame Wednesday morning. If multiple companies signal that AI capital expenditure is generating accelerating revenue returns, and management maintains or raises full-year guidance, the collective result could serve as a broad positive catalyst for the indices. If guidance disappoints, or if management commentary turns defensive on the timeline to AI monetisation, the index-level implications extend well beyond these four names.\n\nThe disclosures to monitor in real time are not the headline EPS comparisons. They are management commentary on 2026 full-year guidance, the Azure AI Services growth rate, Meta’s margin trajectory following the workforce reduction, and AWS AI workload adoption. Those four data points will tell investors more about Wednesday’s open than any single earnings figure.\n\n> This article is for informational purposes only and should not be considered financial advice. Investors should conduct their own research and consult with financial professionals before making investment decisions. Past performance does not guarantee future results. Financial projections are subject to market conditions and various risk factors.\n\n—” } “`
Among the four companies, Amazon’s tariff exposure as a Q2 guidance risk distinguishes it from the others: unlike Alphabet, Meta, and Microsoft, Amazon operates a large physical retail and logistics network where tariff-driven cost inflation could weigh materially on Q2 margin guidance, making the language around retail cost headwinds as important as the AWS cloud metrics.
For readers wanting to model the longer earnings cycle beyond Tuesday’s prints, our full explainer on hyperscaler free cash flow and the 2026-2027 earnings trajectory examines Societe Generale’s projection that free cash flow could turn negative for some hyperscalers by late 2026 before recovering in Q1 2027, with detailed analysis of the depreciation compounding effect across successive AI investment cycles.
S&P 500 concentration in Magnificent Seven mega-caps has made broad index fund ownership structurally different from what diversification once implied: the top 10 holdings in a fund like VTI account for more than 31% of the portfolio, meaning a passive investor who believes they hold the entire US market is in practice heavily exposed to the same four companies reporting on Tuesday evening.
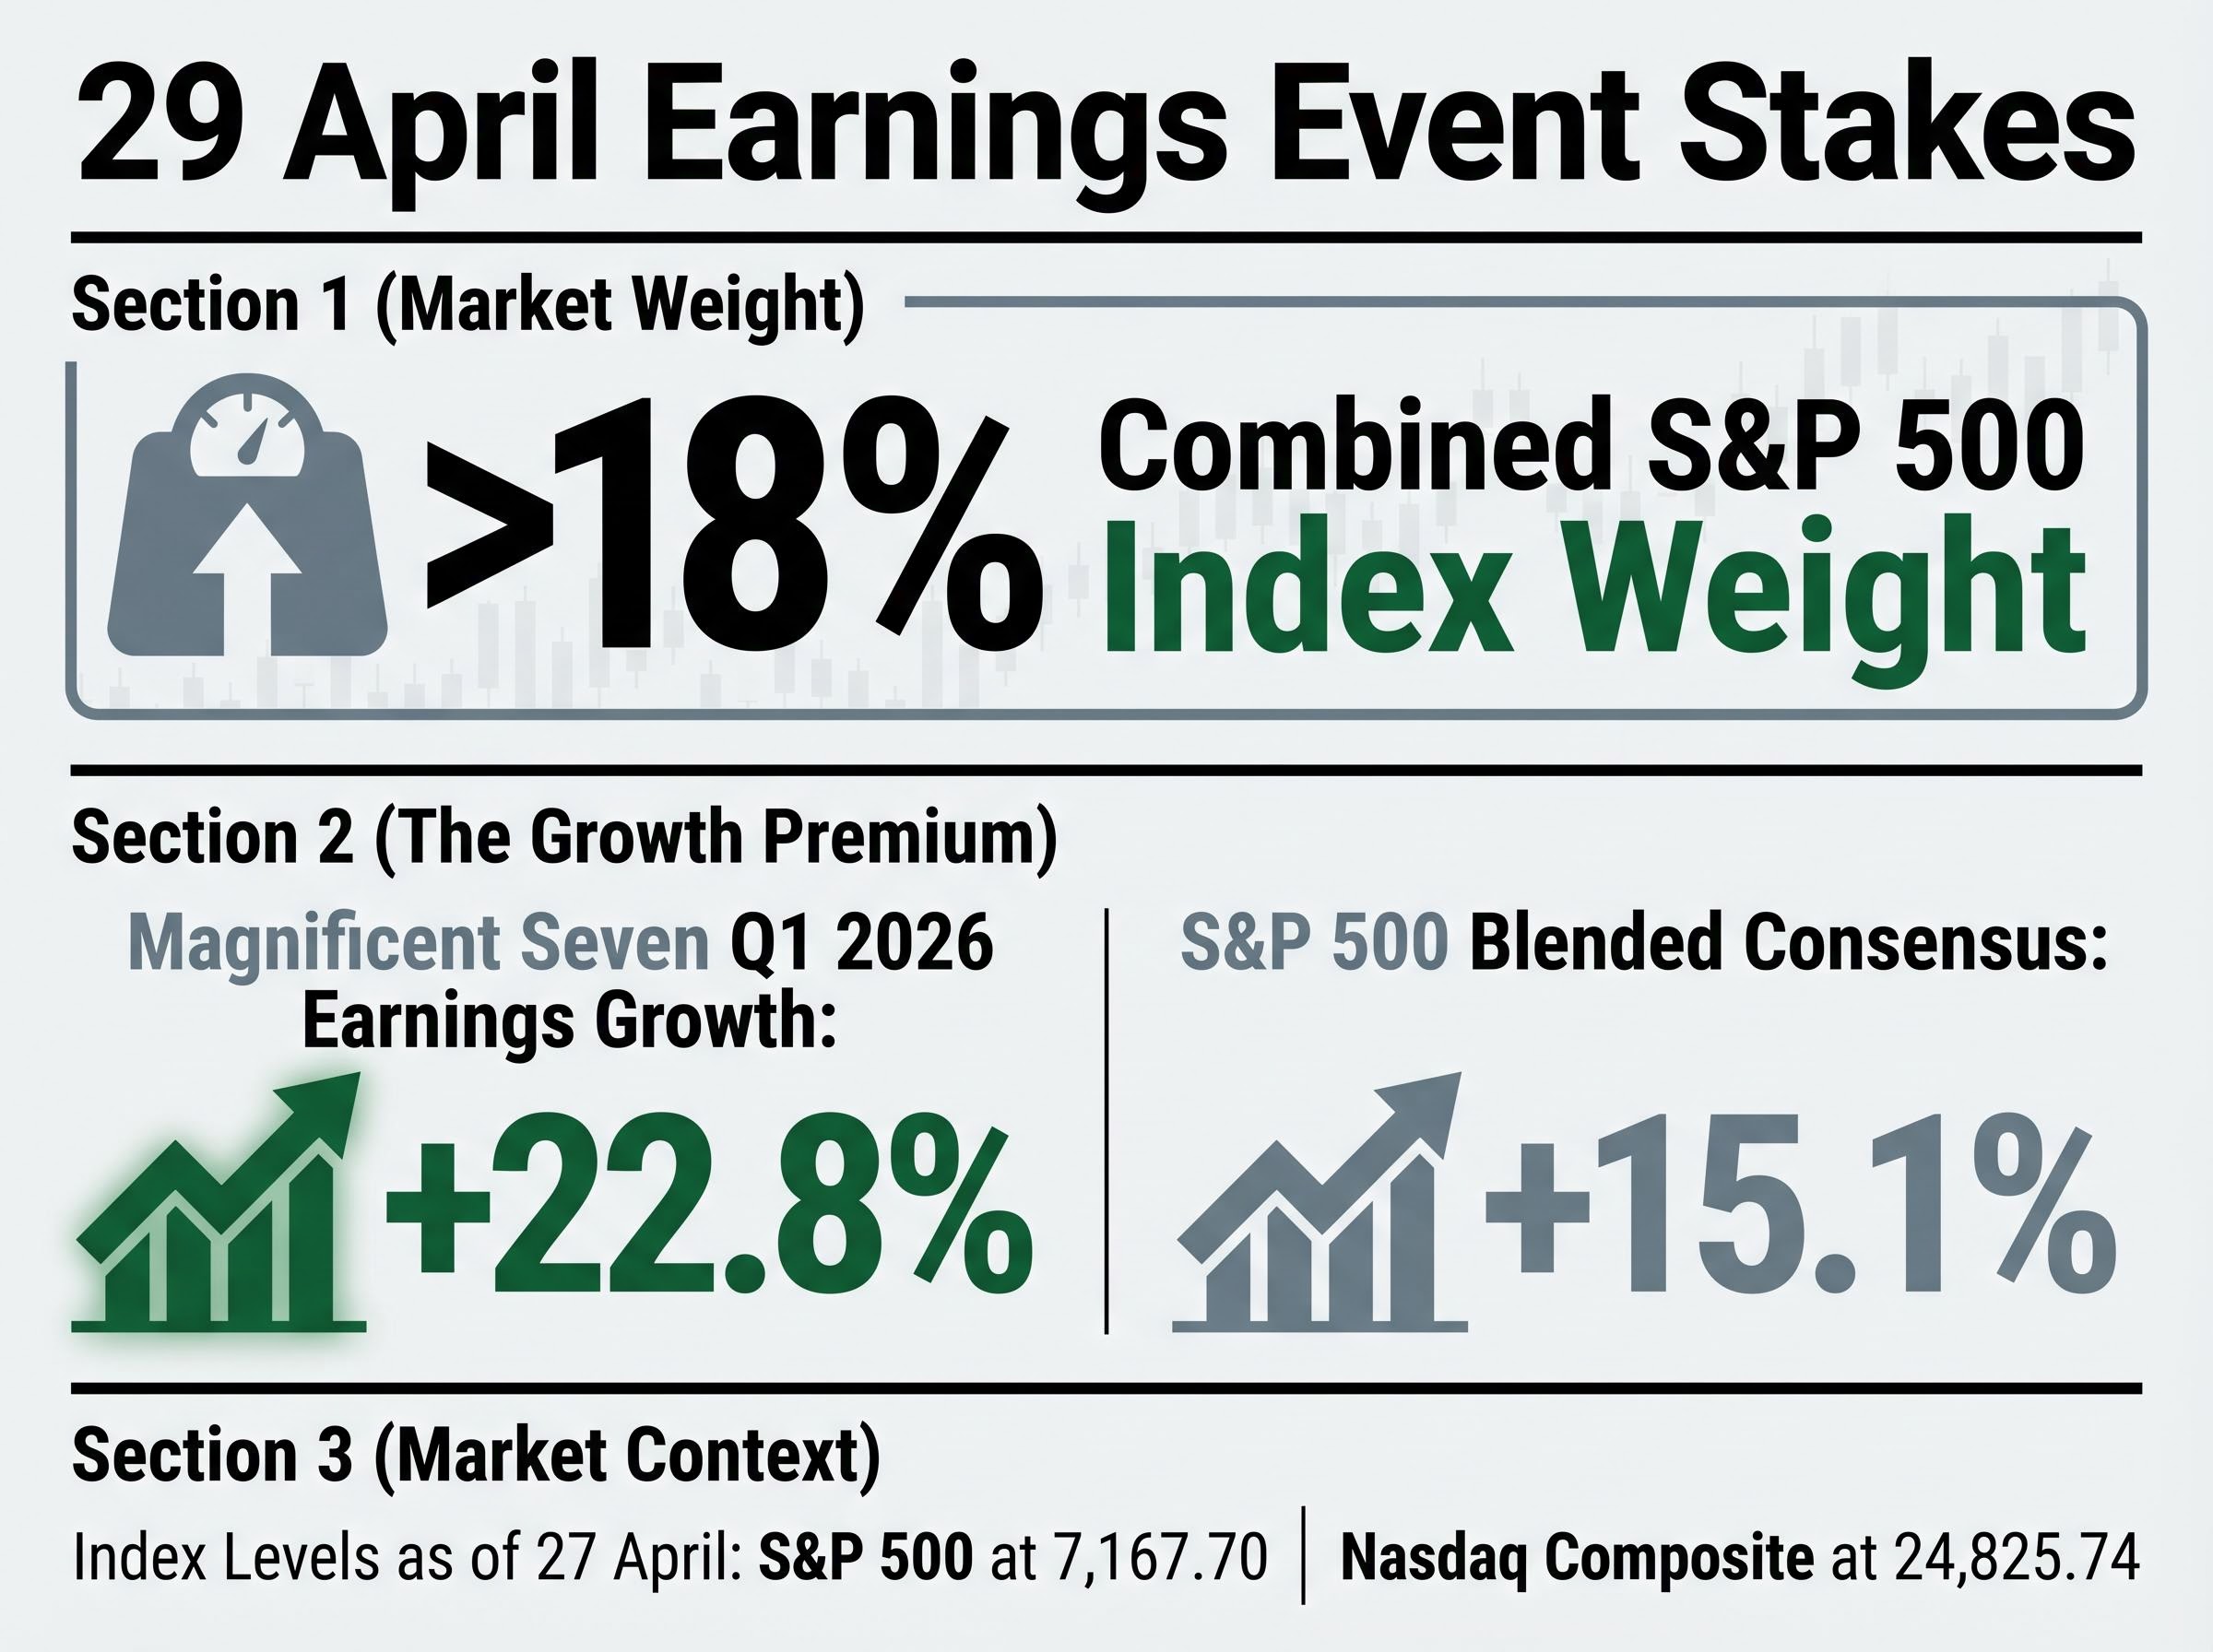
The April 2026 big tech earnings preview covers Alphabet, Meta, Amazon, and Microsoft all reporting after the market close on 29 April 2026, a single evening event that represents more than 18% of the S&P 500 by index weight.
Combined AI infrastructure capital expenditure for 2026 is estimated at approximately $650 billion across these four companies, and the depreciation and operating costs from that spending compress profit margins even as revenues grow strongly.
As of 27 April, options markets are pricing implied moves of plus or minus 5.59% for Alphabet, 7.3% for Meta, 7.3% for Amazon, and 6.7% for Microsoft following their earnings announcements.
For Alphabet the key watch item is Google Cloud revenue growth and Wiz integration commentary; for Meta it is margin trajectory after workforce cuts; for Amazon it is AWS AI workload growth; and for Microsoft it is the Azure AI Services growth rate versus analyst expectations.
Because all four companies report simultaneously with a combined S&P 500 weighting exceeding 18%, there is no sequential market absorption, meaning a broad positive or negative sentiment shift could amplify index-level moves at Wednesday's open.


