Bendigo and Adelaide Bank shares closed at A$10.46 on 22 May 2026, yet a dividend discount model (DDM) analysis places the stock’s franking-adjusted fair value as high as A$19.64 per share. That is an implied discount of nearly 47% to a structured valuation estimate, and it demands an explanation that goes beyond a single number.
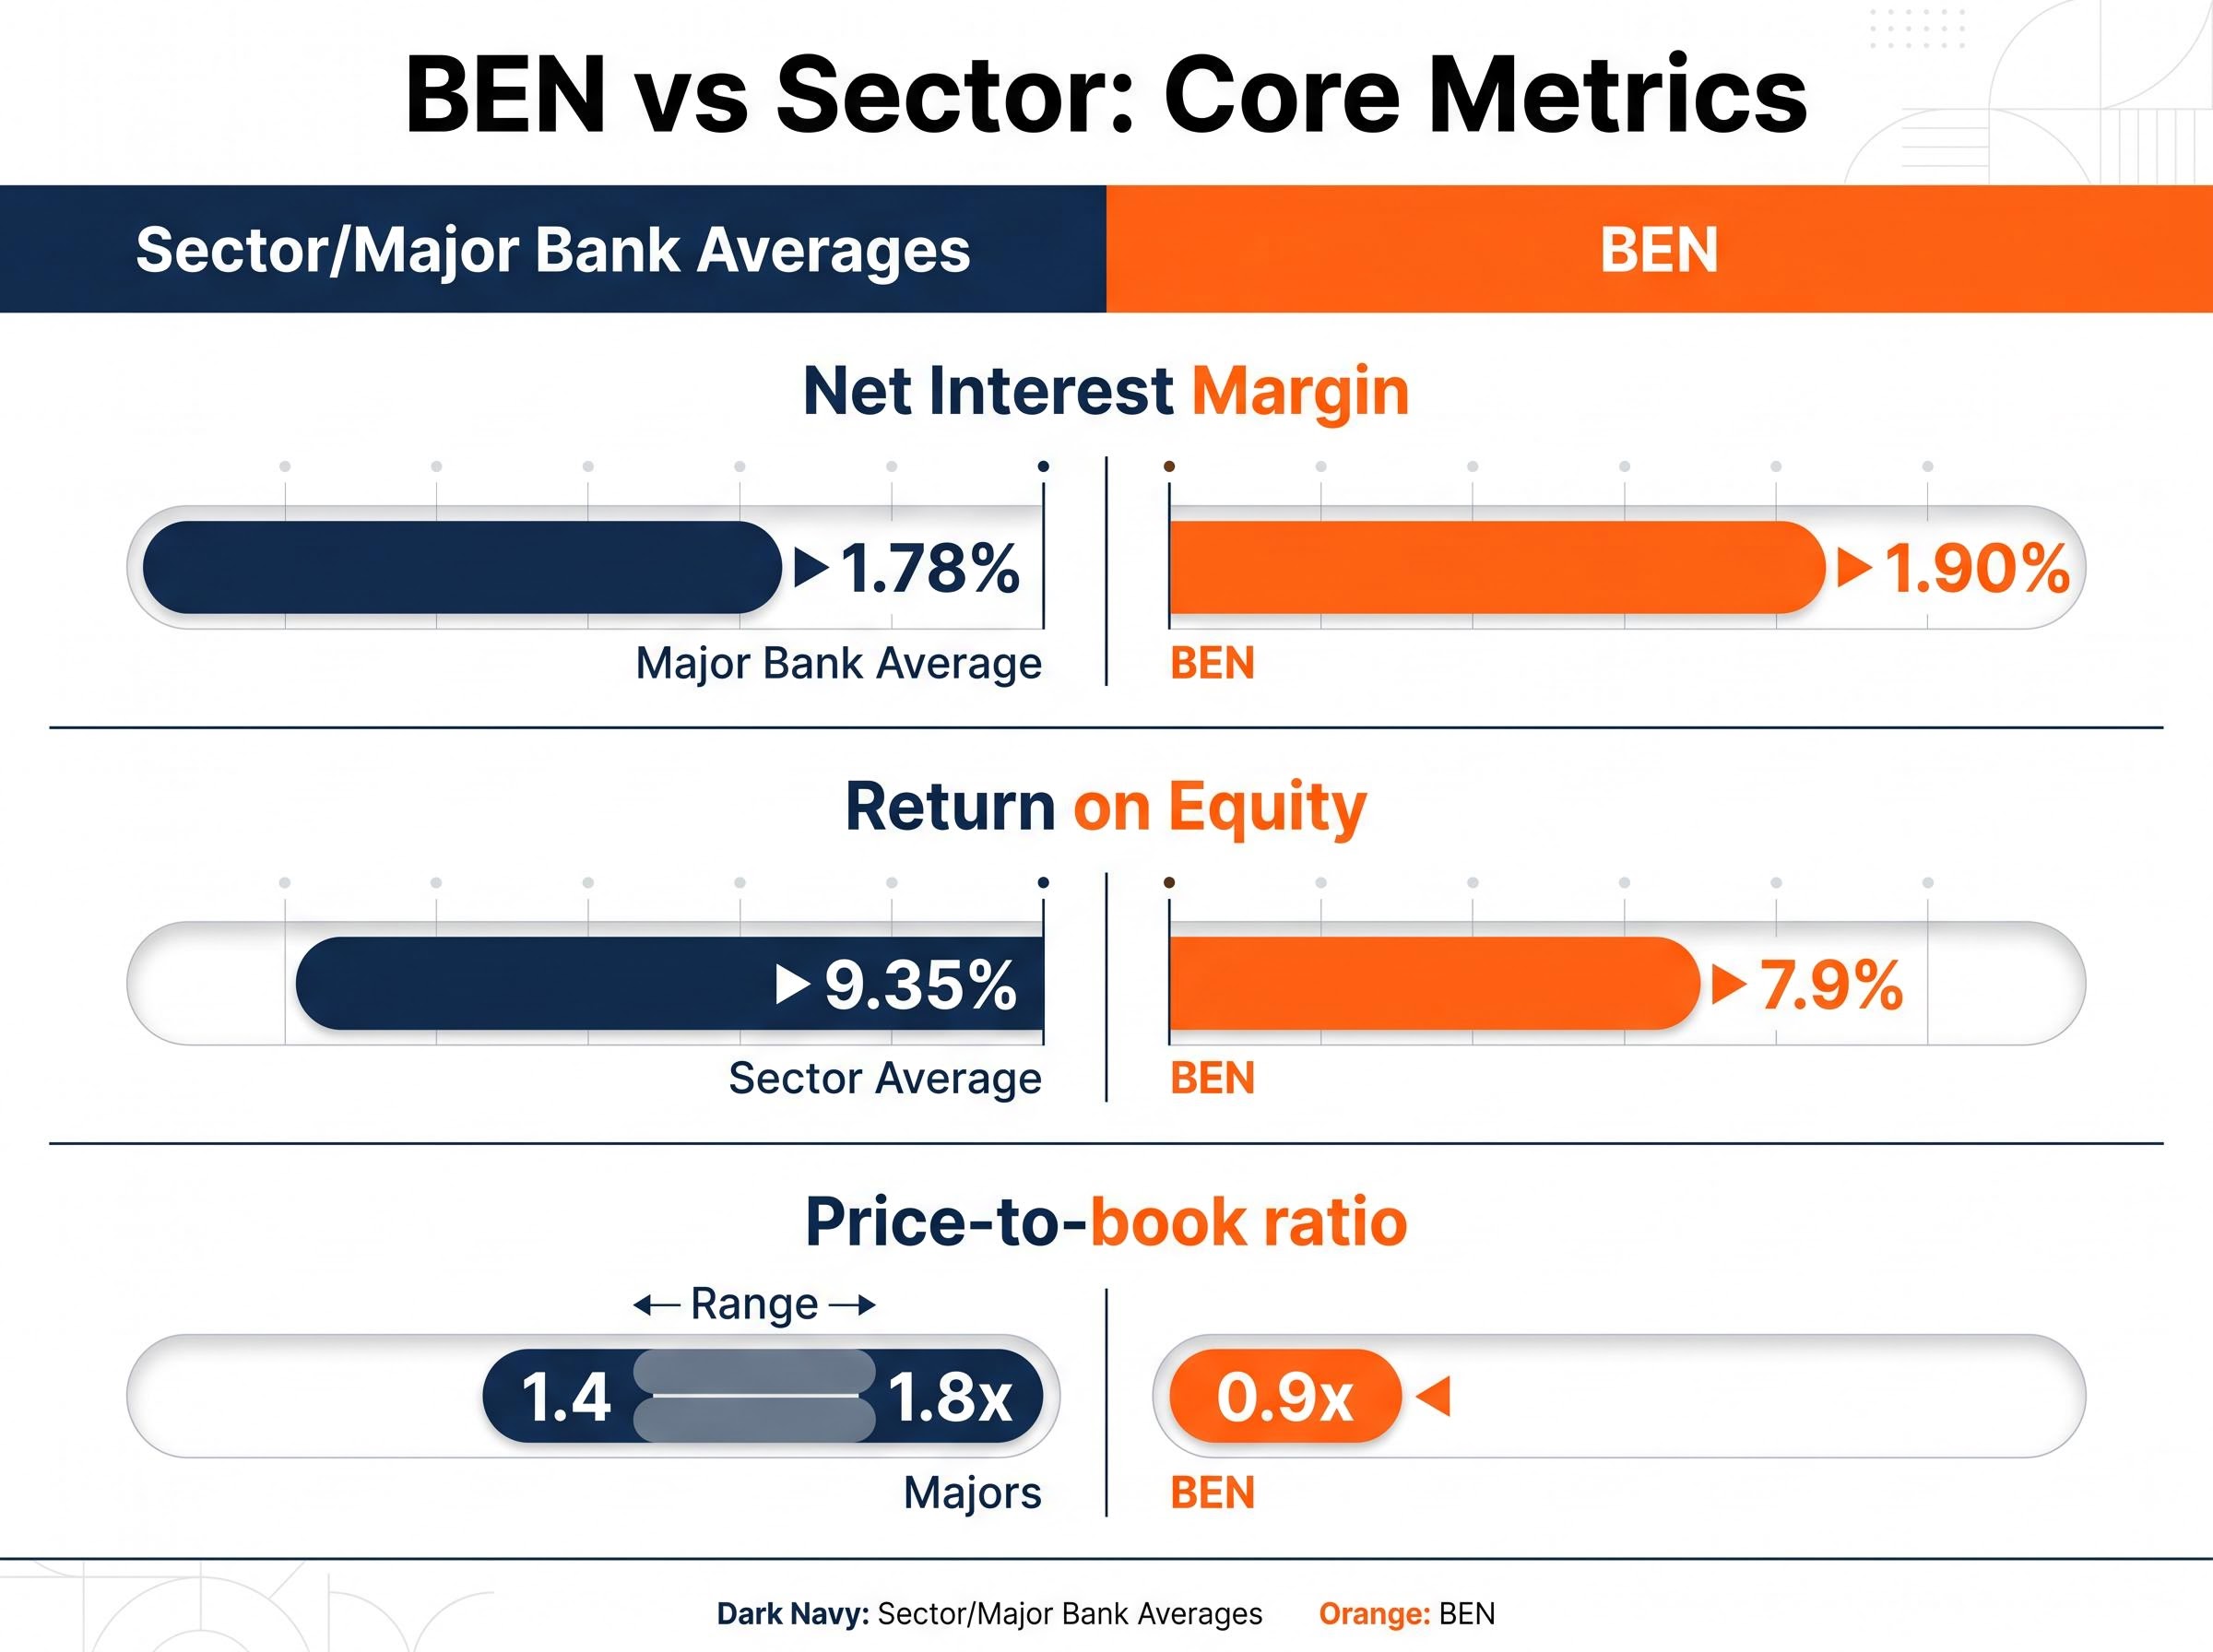
With the 1H FY26 result now public (released 16 February 2026), investors assessing Australian regional bank exposure have fresh financial data to work with. BEN sits at a crossroads: its net interest margin outpaces the major bank average, but its return on equity lags the sector, and analyst consensus sits only modestly above the current price at approximately A$10.85. This analysis walks through BEN’s three core financial metrics, explains what each means for the share price forecast, and connects them to a structured valuation framework. The goal is to give readers a grounded view on whether BEN shares are genuinely cheap or priced that way for good reason.
What the numbers say about BEN’s most recent result
Bendigo and Adelaide Bank reported its 1H FY26 result on 16 February 2026, covering the six months to 31 December 2025. The headline figures provide the factual baseline for every valuation and forecast discussion that follows:
- Cash earnings after tax: A$256.4 million
- Statutory net profit after tax: A$230.6 million
- Interim dividend: A$0.30 per share, fully franked
On the surface, these are solid numbers for a regional bank. The fully franked interim dividend alone signals management confidence in near-term capital adequacy.
The interim dividend stepped down from A$0.32 per share in 1H FY25 to A$0.30 in 1H FY26, a decline of 6.25%. Cash earnings also eased, from A$265.3 million to A$256.4 million over the same period.
That step-down does not necessarily signal distress, but it sets a direction. For any investor running a DDM or yield-based valuation, the quality and trajectory of earnings underpins every assumption. BEN’s most recently reported full-year dividend stands at A$0.63 per share (fully franked), the figure the valuation framework later in this analysis builds upon.
When big ASX news breaks, our subscribers know first
Why net interest margin matters more for BEN than for the big four
Net interest margin, the difference between what a bank earns on its loans and what it pays on its deposits, functions as BEN’s primary earnings engine. Approximately 87% of BEN’s income is derived from lending, compared with more diversified revenue streams at the majors. That concentration makes NIM a proxy for BEN’s entire business model.
The most recent full-year NIM calculation places BEN at 1.90%, according to Rask’s analysis, against a major bank average of approximately 1.78%. That 12-basis-point advantage is a genuine competitive point; it reflects stronger pricing power in regional retail and agribusiness lending.
KPMG’s 2026 major bank half-year analysis confirms the majors’ average NIM held at 178 basis points amid rising deposit competition, providing independent corroboration that BEN’s 1.90% margin represents a genuine structural advantage rather than a measurement artefact.
| Metric | BEN | Major Bank Average |
|---|---|---|
| Net Interest Margin | 1.90% | 1.78% |
| Lending as % of Total Income | ~87% | Lower (more diversified) |
Where margin pressure could re-emerge
The same concentration that supports BEN’s NIM advantage also amplifies risk. Any margin compression hits BEN’s earnings proportionally harder than it would a bank with significant fee, wealth management, or insurance income.
Analyst commentary suggests BEN’s NIM may have “bottomed in 2H FY24,” with a flat-to-slightly-positive trajectory projected, according to J.P. Morgan’s October 2024 banks strategy piece. However, BEN’s funding mix leaves it more exposed to deposit repricing than CBA or NAB, according to analyst views from CommSec. Deposit competition, mortgage refinancing activity led by the majors, and rate sensitivity remain live risks for any investor forecasting BEN’s earnings power forward.
How to read a bank’s financials if you’re new to bank stocks
Investors who understand general equity analysis but have not specifically valued a bank stock benefit from a three-metric framework. Each metric connects directly to the question that matters most for BEN: can the dividend be sustained?
- Net interest margin (NIM): This measures the gap between what a bank earns on its loans and what it pays on its deposits, expressed as a percentage of interest-earning assets. A higher NIM means wider profit margins on lending. BEN’s NIM sits at 1.90%, above the 1.78% major bank average, which is a positive signal for earnings quality.
- Return on equity (ROE): This measures how much profit a bank generates from every dollar of shareholder capital. It captures efficiency, scale, and cost management in a single figure. BEN’s ROE is 7.9%, below the sector average of approximately 9.35%, suggesting the bank converts its NIM advantage into profits less efficiently than its larger peers.
- Common equity tier 1 ratio (CET1): This is the proportion of a bank’s highest-quality capital (ordinary shares and retained earnings) relative to its risk-weighted assets. Regulators use it to assess whether a bank can absorb losses without threatening depositors. BEN’s CET1 is approximately 11.3%, noted as below the sector average. A lower CET1 ratio limits flexibility for buybacks or elevated dividends.
For regional banks specifically, these three metrics interact. A low ROE alongside a reasonable NIM usually signals a cost-efficiency or scale problem rather than a revenue problem. That distinction matters for forecasting whether the discount to peers can narrow over time.
Reading an ASX bank result through the NIM, ROE, and CET1 lens simultaneously is important because a bank can artificially inflate ROE by reducing its capital base rather than improving profitability; applied to BEN, that distinction matters given its CET1 sits below the sector average while its NIM leads it, a combination that raises questions about capital efficiency rather than revenue quality alone.
BEN’s return on equity and capital position: the harder part of the story
BEN’s NIM advantage is real. The two metrics where it underperforms explain why the stock trades at a persistent discount to the majors.
BEN’s ROE of 7.9% trails the sector average of 9.35% by 1.45 percentage points. The most likely drivers are familiar constraints for a regional bank: a higher cost-to-income ratio, smaller scale in technology and operations, and more limited fee income diversification. BEN earns well on its loan book; it simply costs more to run the operation that produces those earnings.
| Metric | BEN | Sector Average |
|---|---|---|
| Net Interest Margin | 1.90% | 1.78% |
| Return on Equity | 7.9% | ~9.35% |
| CET1 Ratio | ~11.3% | Above BEN (sector avg.) |
The CET1 ratio of approximately 11.3% sits above regulatory minimums but below the sector average. This implies adequate capital to support current dividend settings, but limited room for higher payouts or share buybacks. UBS, in February 2025 commentary, projected broadly flat dividends over the subsequent 12-18 months, with capital comfortably supporting existing settings but offering little surplus.
APRA’s capital adequacy framework sets a minimum CET1 ratio of 4.5% of risk-weighted assets for standardised banks, with “unquestionably strong” benchmarks sitting materially higher, which means BEN’s approximately 11.3% CET1 clears the regulatory floor by a wide margin even as it trails the sector average.
Management has indicated a medium-term ambition to bring the cost-to-income ratio “towards the low-50s” from the mid-50s, according to the FY24 investor presentation. If delivered, this would be the most direct mechanism for closing the ROE gap.
The cost-to-income ratio is the metric that most directly links BEN’s operational improvement programme to any eventual ROE recovery; banks trading at a premium price-to-book multiple require their ROE to sustainably exceed peers, and the analytical relationship between cost efficiency and that premium is why management’s ‘low-50s’ target functions as the single most important forward indicator for BEN’s re-rating potential.
BEN’s price-to-book ratio of approximately 0.9x, compared with 1.4-1.8x for the majors, reflects this structural underperformance. The question is whether the discount already accounts for these constraints, or whether it represents an ongoing ceiling.
What a dividend discount model says about BEN’s fair value
A dividend discount model estimates a stock’s value by taking its expected annual dividend, then dividing it by the difference between a required return (risk rate) and a projected growth rate. It is most useful for income-oriented stocks with stable, predictable dividends, which makes BEN a reasonable candidate.
Using BEN’s most recently reported full-year dividend of A$0.63 per share, a growth rate range of 2% to 4%, and a risk rate range of 6% to 11%, the DDM produces a spread of fair value estimates rather than a single point target.
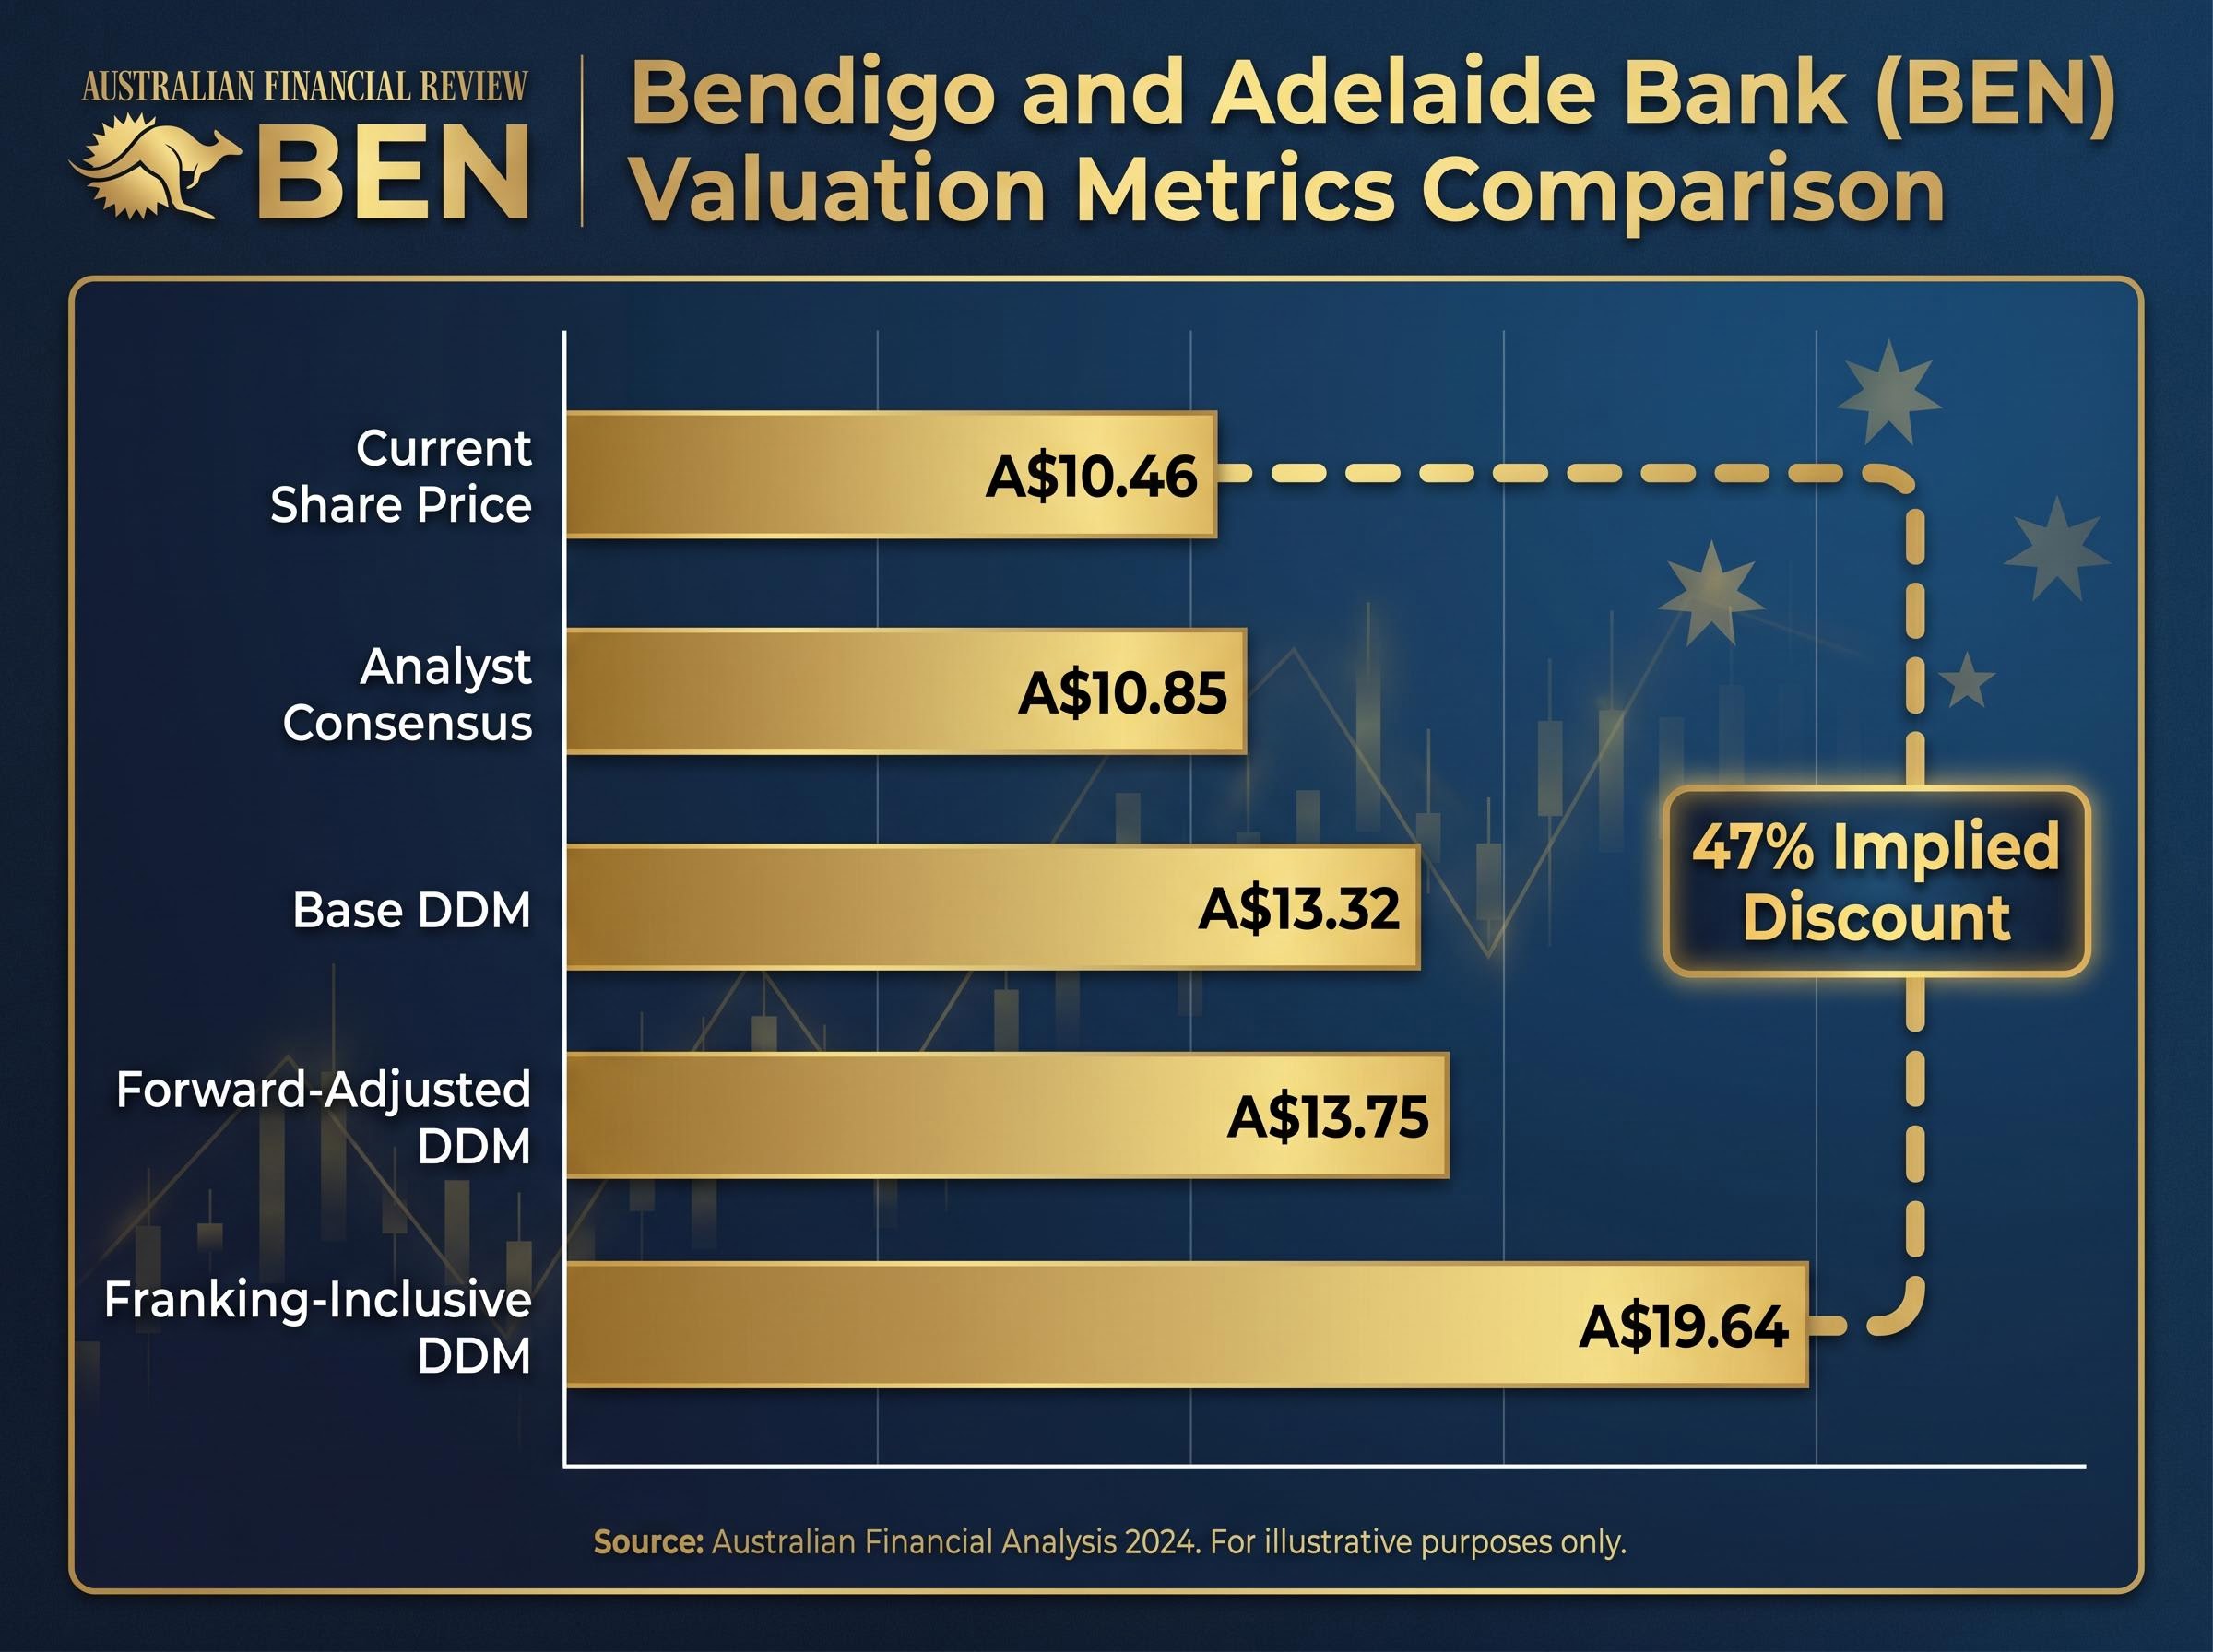
| Scenario | Dividend Input | Method | Est. Fair Value |
|---|---|---|---|
| Base DDM | A$0.63 | Historical dividend | ~A$13.32 |
| Forward-Adjusted DDM | A$0.65 | Projected forward dividend | ~A$13.75 |
| Franking-Inclusive DDM | A$0.63 (grossed up) | Including franking credits | ~A$19.64 |
At a current share price of A$10.46, the franking-inclusive DDM estimate of A$19.64 implies the market is pricing BEN at a 47% discount to the grossed-up value of its dividend stream.
For Australian resident investors who can access franking credit refunds or offsets, the gross dividend yield is materially higher than the headline yield. The DDM framework puts a structured number on that advantage, even if the output range is wide.
The franking credit calculation follows the standard 30/70 formula: a fully franked dividend of A$0.63 grosses up to A$0.90, adding A$0.27 in attached tax credits that eligible investors can offset against their personal tax liability or receive as a direct ATO cash refund, which is precisely why the franking-inclusive DDM scenario produces a materially higher fair value estimate than the base case.
Why DDM outputs should be treated as a range, not a verdict
Small changes in the growth and risk rate assumptions produce large swings in DDM output. A 1 percentage point shift in either input can move the fair value estimate by several dollars. The model also does not capture capital allocation quality, cost-efficiency trajectory, or credit cycle risks, all of which are material for BEN.
The analyst consensus target of approximately A$10.85 (with a high of A$11.90 across 12 analysts) is far more conservative than any DDM scenario. Analysts typically apply earnings-based or price-to-book multiples rather than DDM, embedding more conservative assumptions on growth and risk. That gap between DDM output and analyst consensus is itself informative: it suggests the market is pricing BEN on near-term earnings power, not on the long-run value of its dividend stream.
The regional bank discount: already priced in, or a structural ceiling?
The three-metric analysis produces a coherent picture. BEN earns above-average NIM but converts that into below-average ROE because of higher costs and smaller scale. Its capital position provides adequate but not generous flexibility. The investment question is whether the resulting discount is overdone or justified.
The case for the discount being overdone
- BEN’s NIM of 1.90% exceeds the major bank average of 1.78%, demonstrating competitive pricing power in regional retail and agribusiness lending.
- Fully franked dividends generate a real cash tax benefit for Australian resident investors. The DDM-implied discount to intrinsic value is significant across all three scenarios.
- Management’s cost-efficiency programme targets a cost-to-income ratio “towards the low-50s,” which, if delivered, would directly address the ROE gap.
- Fund managers have been reported as selectively increasing exposure to BEN and BOQ at current valuations, according to AFR reporting in May 2025.
The structural constraints that justify a valuation gap
- BEN’s ROE of 7.9% trails the sector average by 1.45 percentage points, and its CET1 of approximately 11.3% sits below the sector average, limiting capital flexibility.
- The interim dividend stepped down from A$0.32 to A$0.30 year-on-year, while cash earnings declined from A$265.3 million to A$256.4 million.
- Scale and technology disadvantages relative to the majors remain structural. J.P. Morgan described BEN in December 2024 as an “income stock with structural headwinds,” noting that fully franked yields provide a floor for total returns but that the valuation discount to majors is broadly justified.
- BEN’s workplace culture score of 2.9 out of 5 (below the banking sector average of 3.1) serves as a soft indicator of potential long-term operational risk.
BEN shares in 2026: a yield play with a conditions-attached upgrade thesis
BEN’s fundamentals present a mixed picture. An above-peer NIM and fully franked dividends sit on one side; below-peer ROE and a modest capital position sit on the other. The DDM framework identifies material implied value, but the gap between that framework’s output and the analyst consensus target of A$10.85 reflects how differently the market prices near-term earnings power versus long-run income streams.
The single most important variable for investors to monitor is management’s progress on the cost-to-income ratio. That metric is the primary mechanism linking operational improvement to ROE recovery and, ultimately, to any share price re-rating.
For investors tracking whether BEN’s cost-to-income improvement is translating into tangible results, our dedicated guide to BEN’s Q3 FY26 cost programme update covers the A$65 million to A$75 million annualised savings target, the Infosys and Genpact outsourcing partnerships underpinning it, and the A$85 million to A$95 million in transition costs that analysts expect to concentrate in FY2027.
Investors may benefit from applying the DDM framework with their own tax situation and risk rate assumptions, treating the franking-inclusive valuation as a ceiling scenario rather than a base case. Key data points to track going forward:
- NIM trajectory in the FY26 full-year result
- Cost-to-income ratio progress against the “low-50s” target
- CET1 trend and its implications for dividend flexibility
Research gaps remain: the 1H FY26 NIM and CET1 figures were not independently verified for this analysis. Updating the framework when BEN’s next full result is released would strengthen any investment view built on these inputs.
This article is for informational purposes only and should not be considered financial advice. Investors should conduct their own research and consult with financial professionals before making investment decisions. Past performance does not guarantee future results. Financial projections are subject to market conditions and various risk factors.