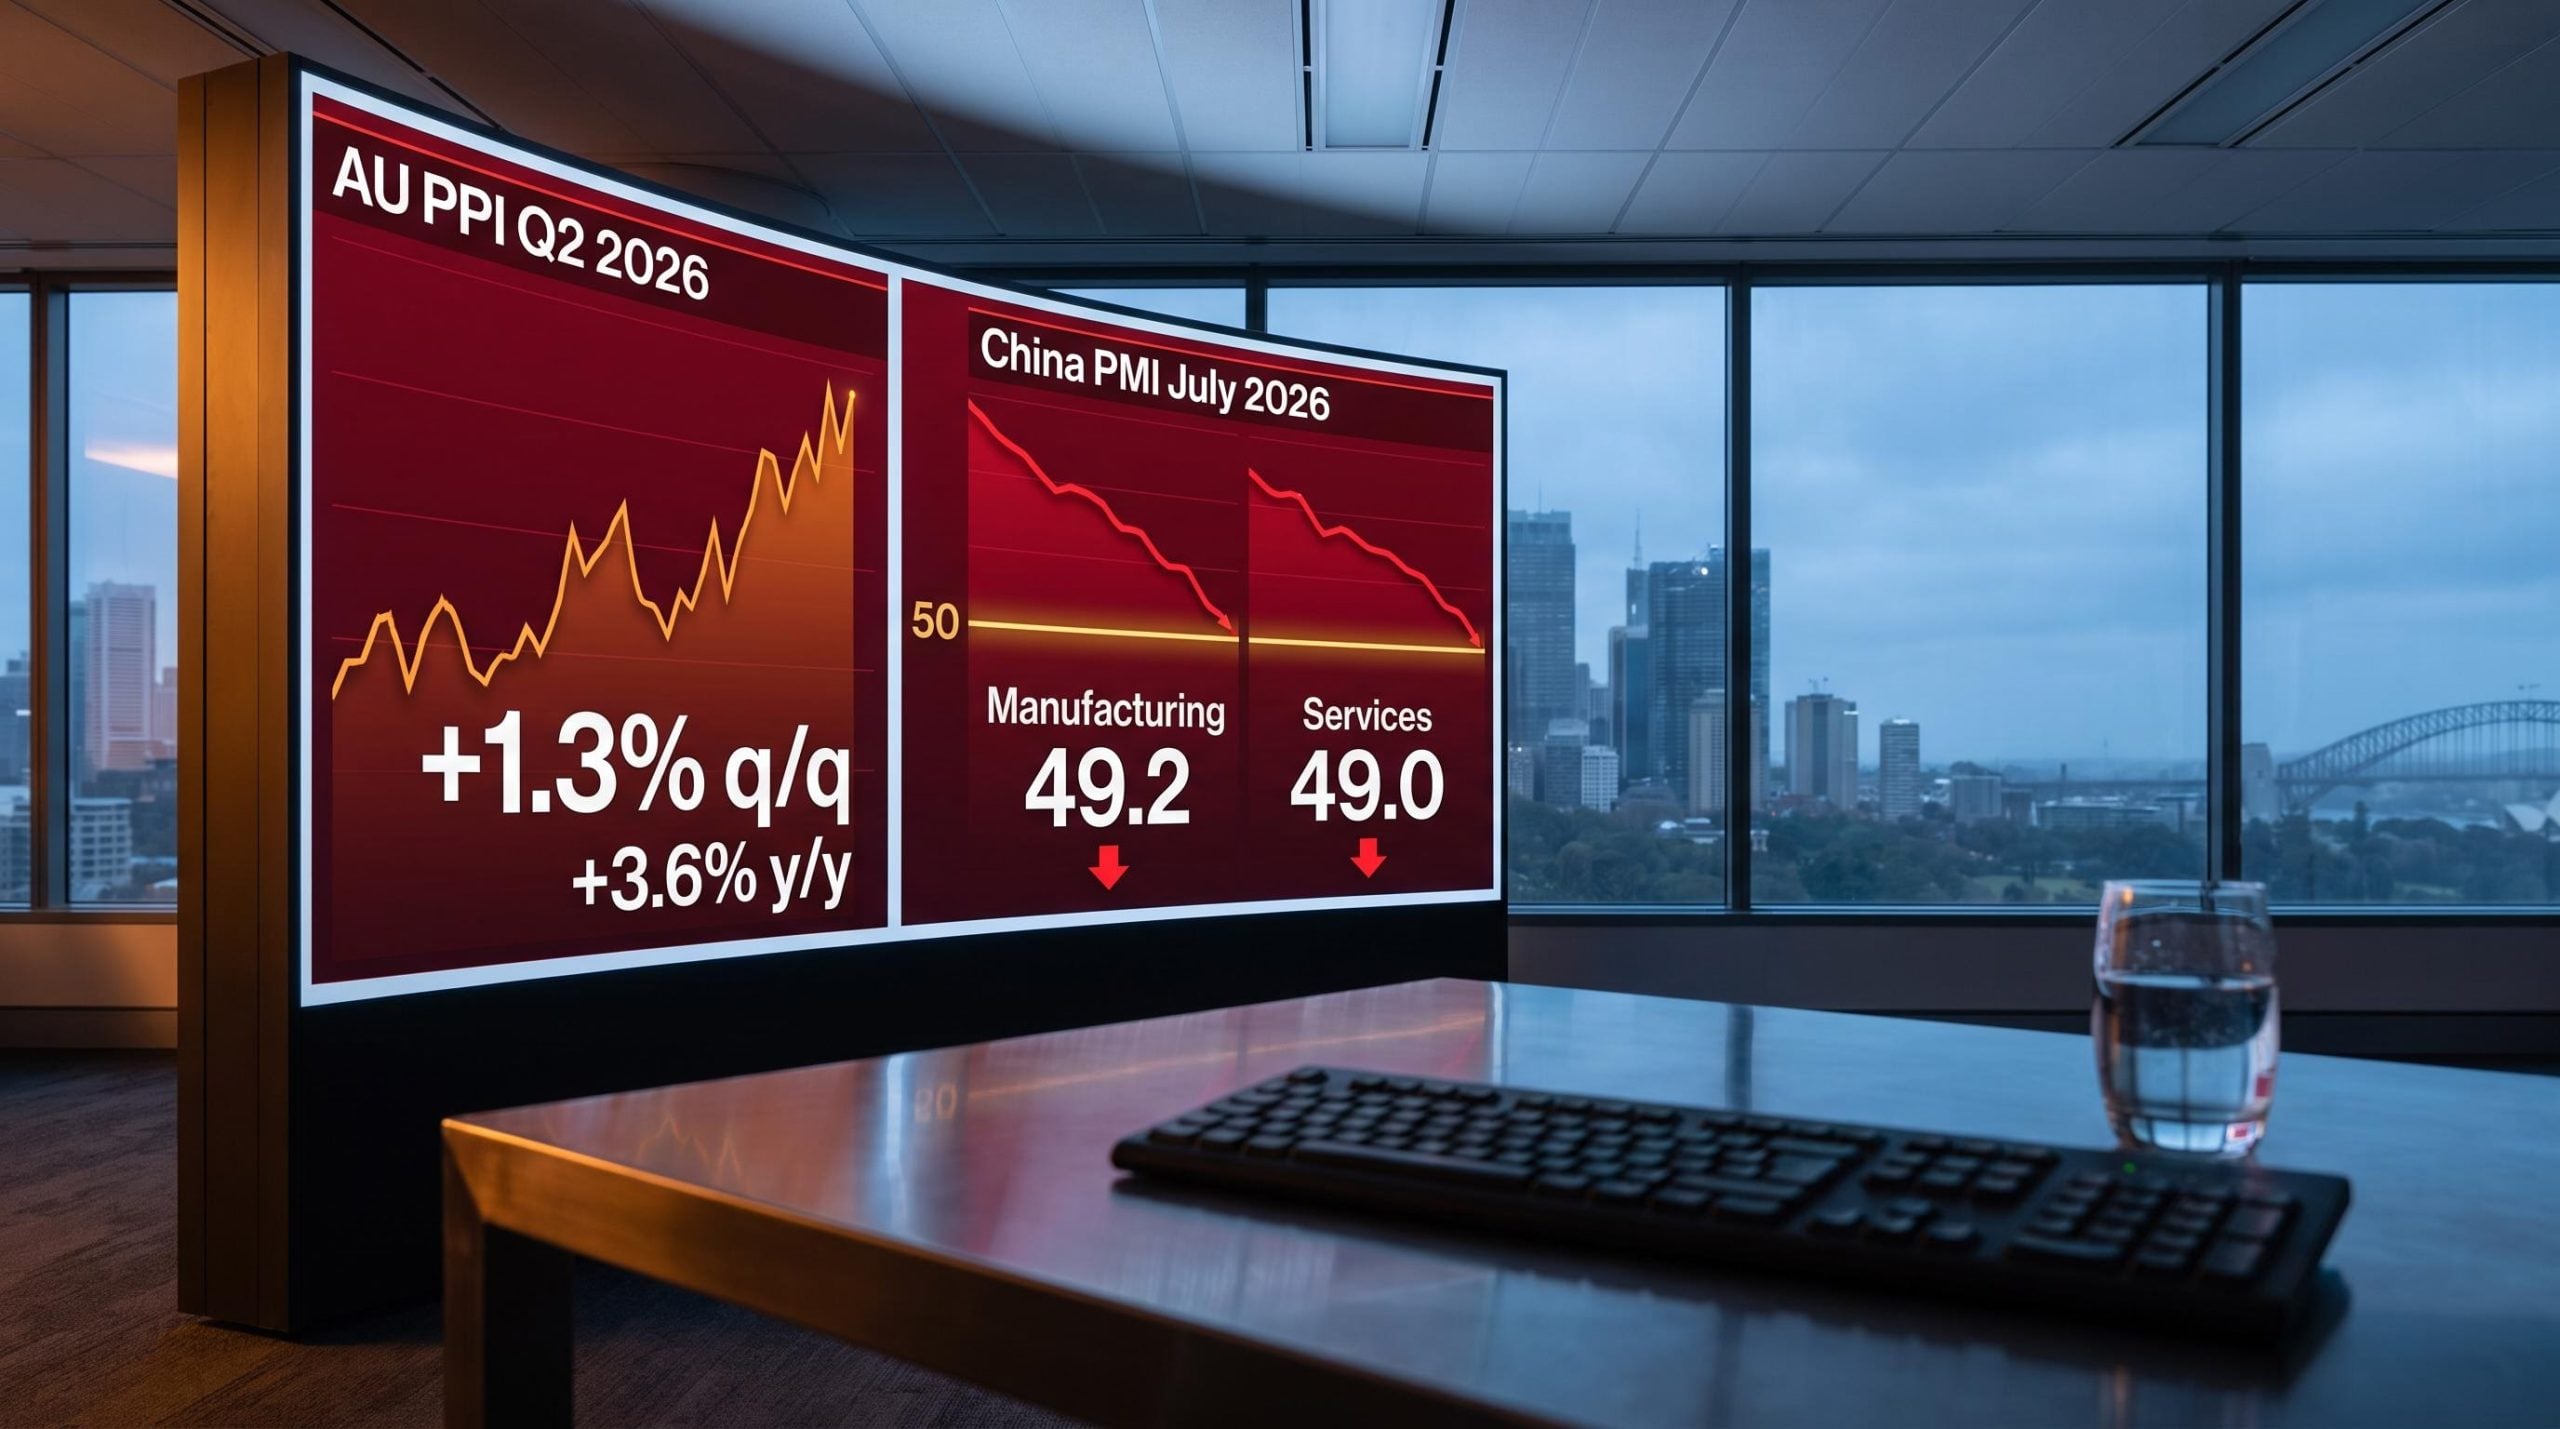
Two data releases landed on the same morning on 31 July 2026, and they pointed in opposite directions for the same economy. Australia’s upstream inflation accelerated at its fastest pace in three years, just as its largest trading partner signalled a broad economic slowdown across both manufacturing and services. Neither fact alone is the story. Their simultaneous arrival is.
The Producer Price Index (PPI) print received almost no mainstream attention because a better-than-expected Consumer Price Index earlier in the week dominated coverage. China’s purchasing managers’ index (PMI) results attracted some headlines but were reported mostly as isolated data points rather than as a transmission-channel story for Australian assets. What neither report gave investors on its own was an integrated read of what both indicators together mean for the ASX.
Here is a framework for reading the macro setup that now sits beneath ASX valuations. Not a prediction about what markets will do, but a map of where risks have shifted and which sectors feel them most directly.
What PPI actually measures, and why the June quarter result matters
Most retail investors track the Consumer Price Index. Fewer track the Producer Price Index, and that gap matters, because PPI sits upstream of consumer prices and often signals where inflation is heading before CPI confirms it.
PPI measures price changes from the perspective of the producer, not the consumer. It captures wholesale and intermediate-stage costs: raw materials, energy, freight, and construction inputs. The Australian Bureau of Statistics (ABS) publishes it on a quarterly basis, so the 31 July 2026 release covers Q2 2026, the June quarter, not a single monthly reading. Its value as a leading indicator comes from a straightforward pipeline logic: cost pressures that hit producers today typically take one or more quarters to flow through to consumer-facing prices.
The ABS Producer Price Indexes release for Q2 2026 confirms both the headline quarterly figure and the sub-index composition that makes this print structurally significant, rather than a one-quarter statistical artefact driven by a single volatile category.
Three things to understand about PPI:
- It captures input costs at the wholesale and intermediate stage, before they reach consumers
- The ABS publishes it quarterly, making each release a three-month aggregate rather than a snapshot
- It functions as an early-warning system for future CPI acceleration, because producer costs flow downstream with a lag
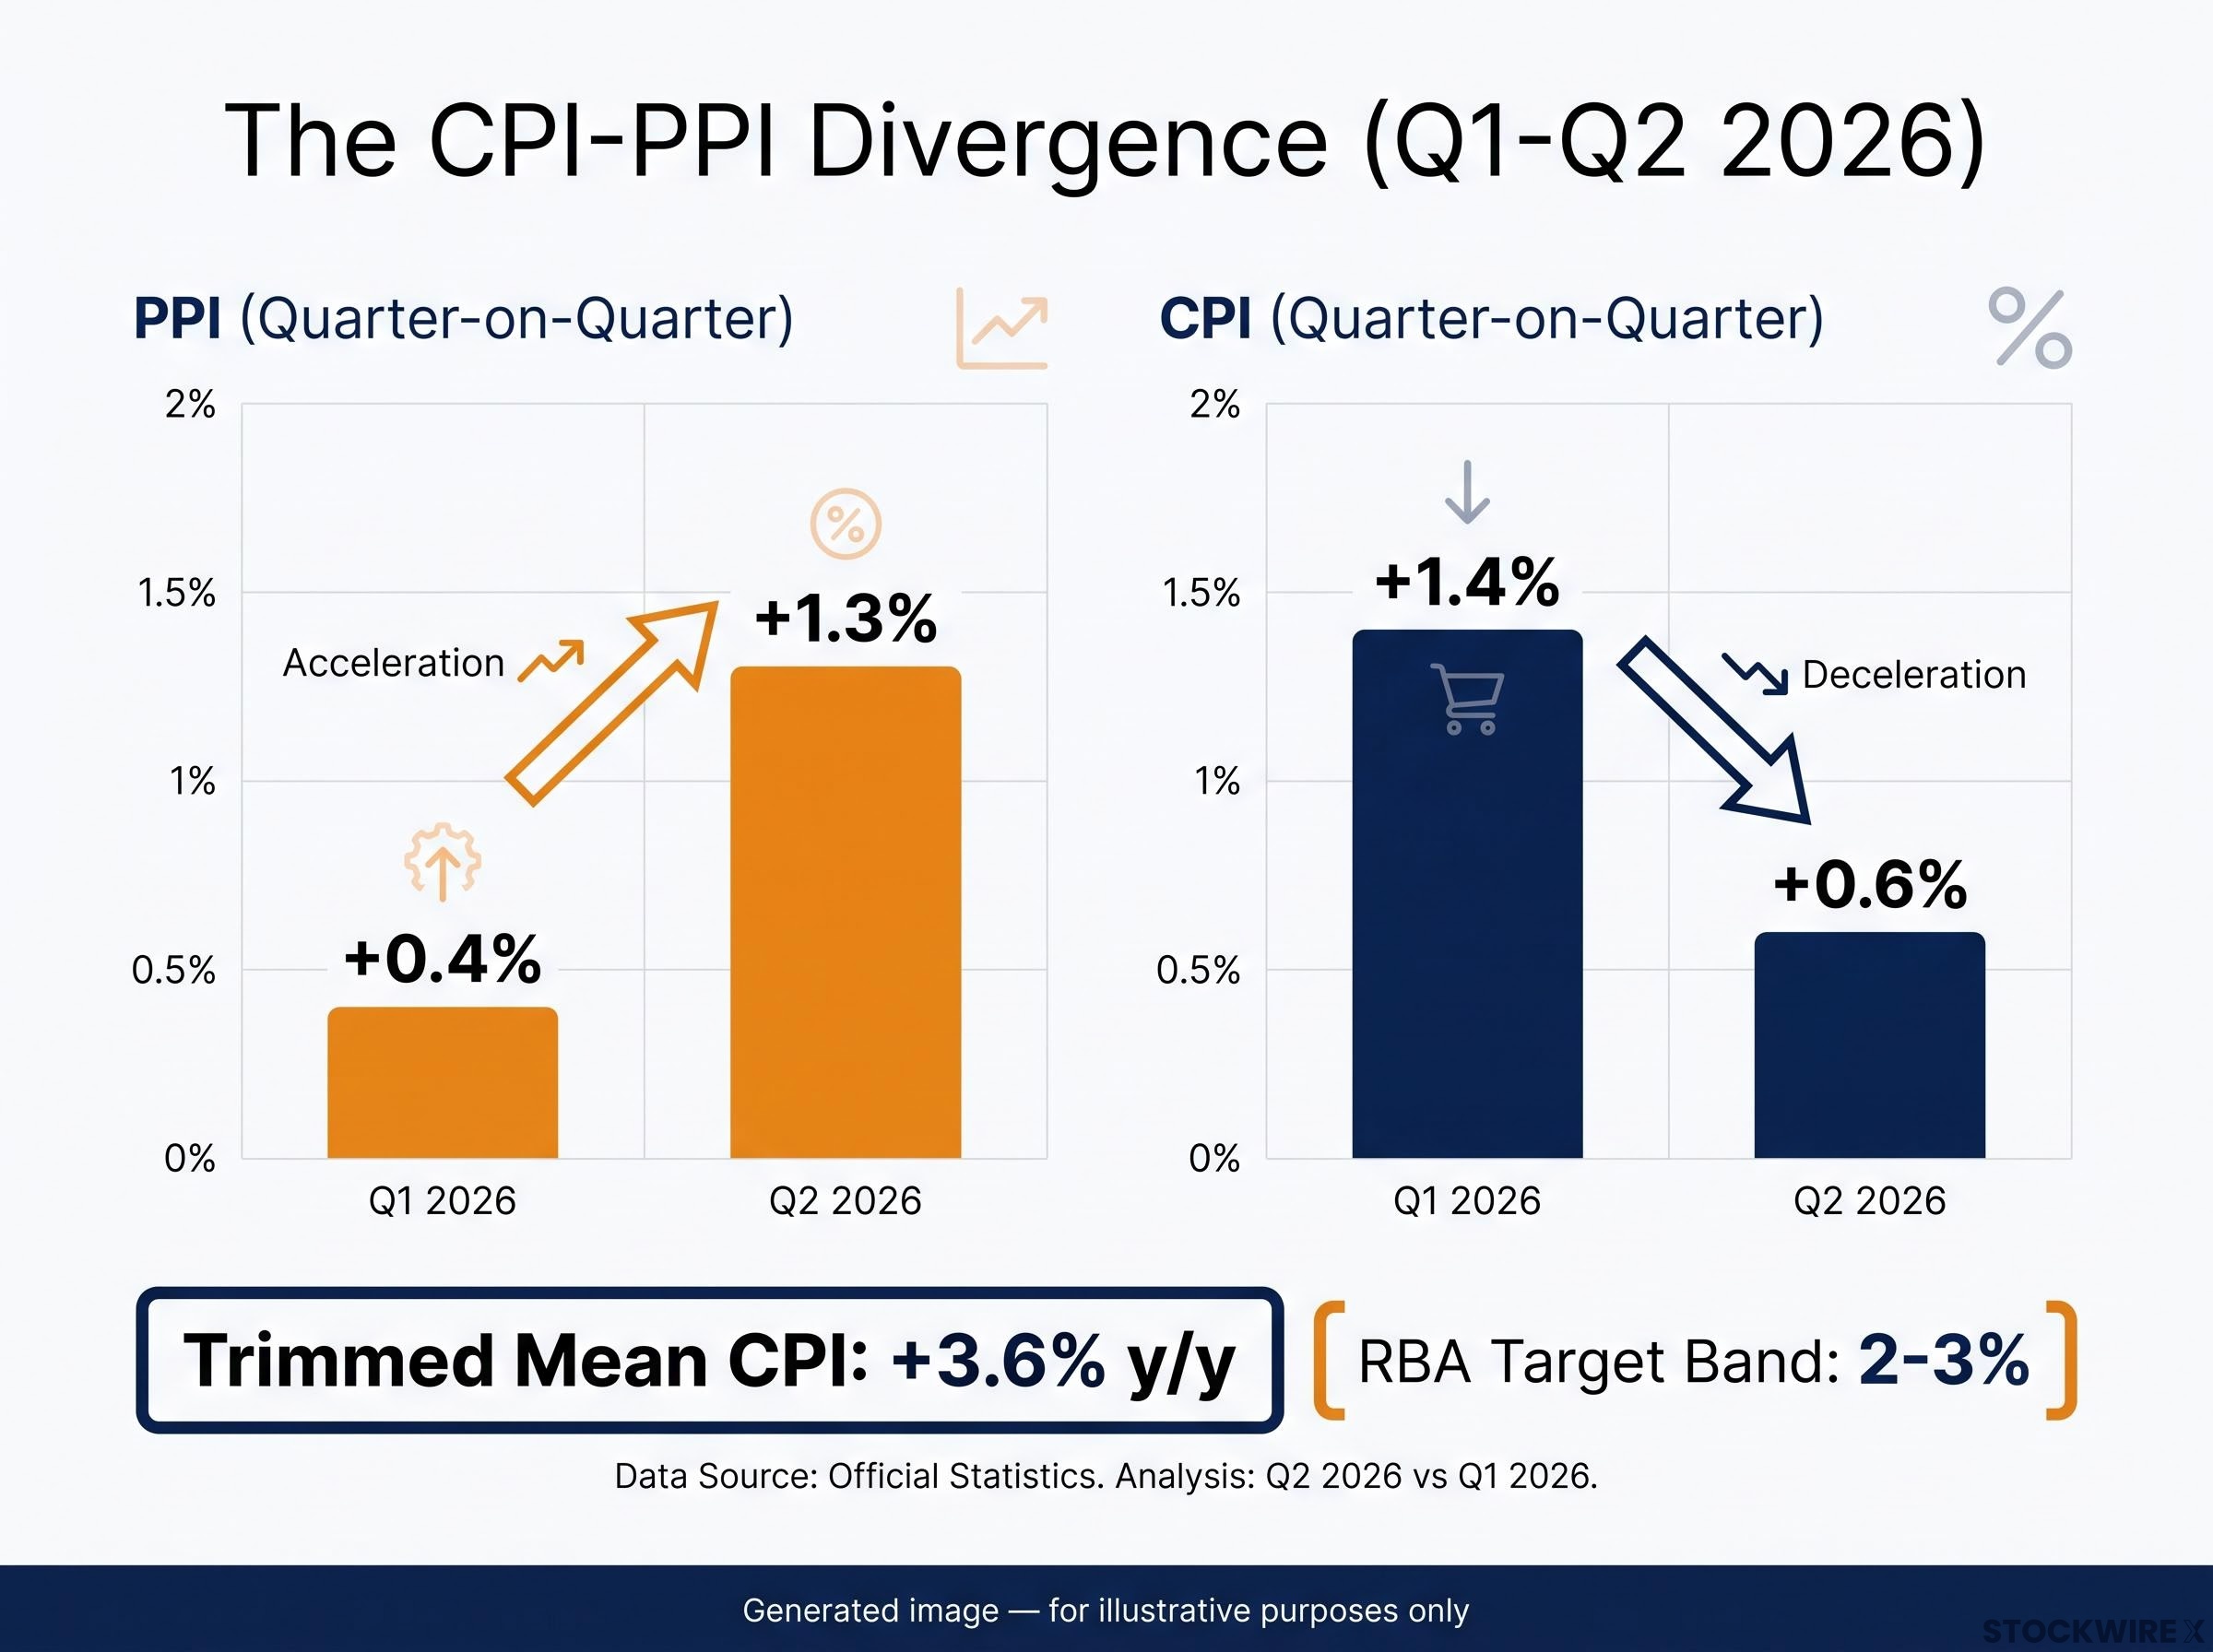
Q2 2026 PPI (final demand): +1.3% quarter-on-quarter, versus +0.4% in Q1 2026 and consensus of approximately +0.3%. On an annual basis, PPI accelerated to +3.6% year-on-year, up from +3.0% in Q1 and the highest since early 2025. This was the fastest quarterly acceleration since Q3 2023.
That +1.3% quarterly jump, more than four times the consensus expectation, tells you that cost pressures are building in the supply chain at a pace that, if it persists, will eventually challenge the narrative that consumer inflation is durably cooling. The pipeline matters as much as the current reading.
When big ASX news breaks, our subscribers know first
Where the cost pressure is coming from in Q2 2026
The size of the PPI surprise is one thing. Its composition is what tells you whether the pressure is likely to fade or persist.
| Contributor | Q2 2026 Change | Direction | Transmission Note |
|---|---|---|---|
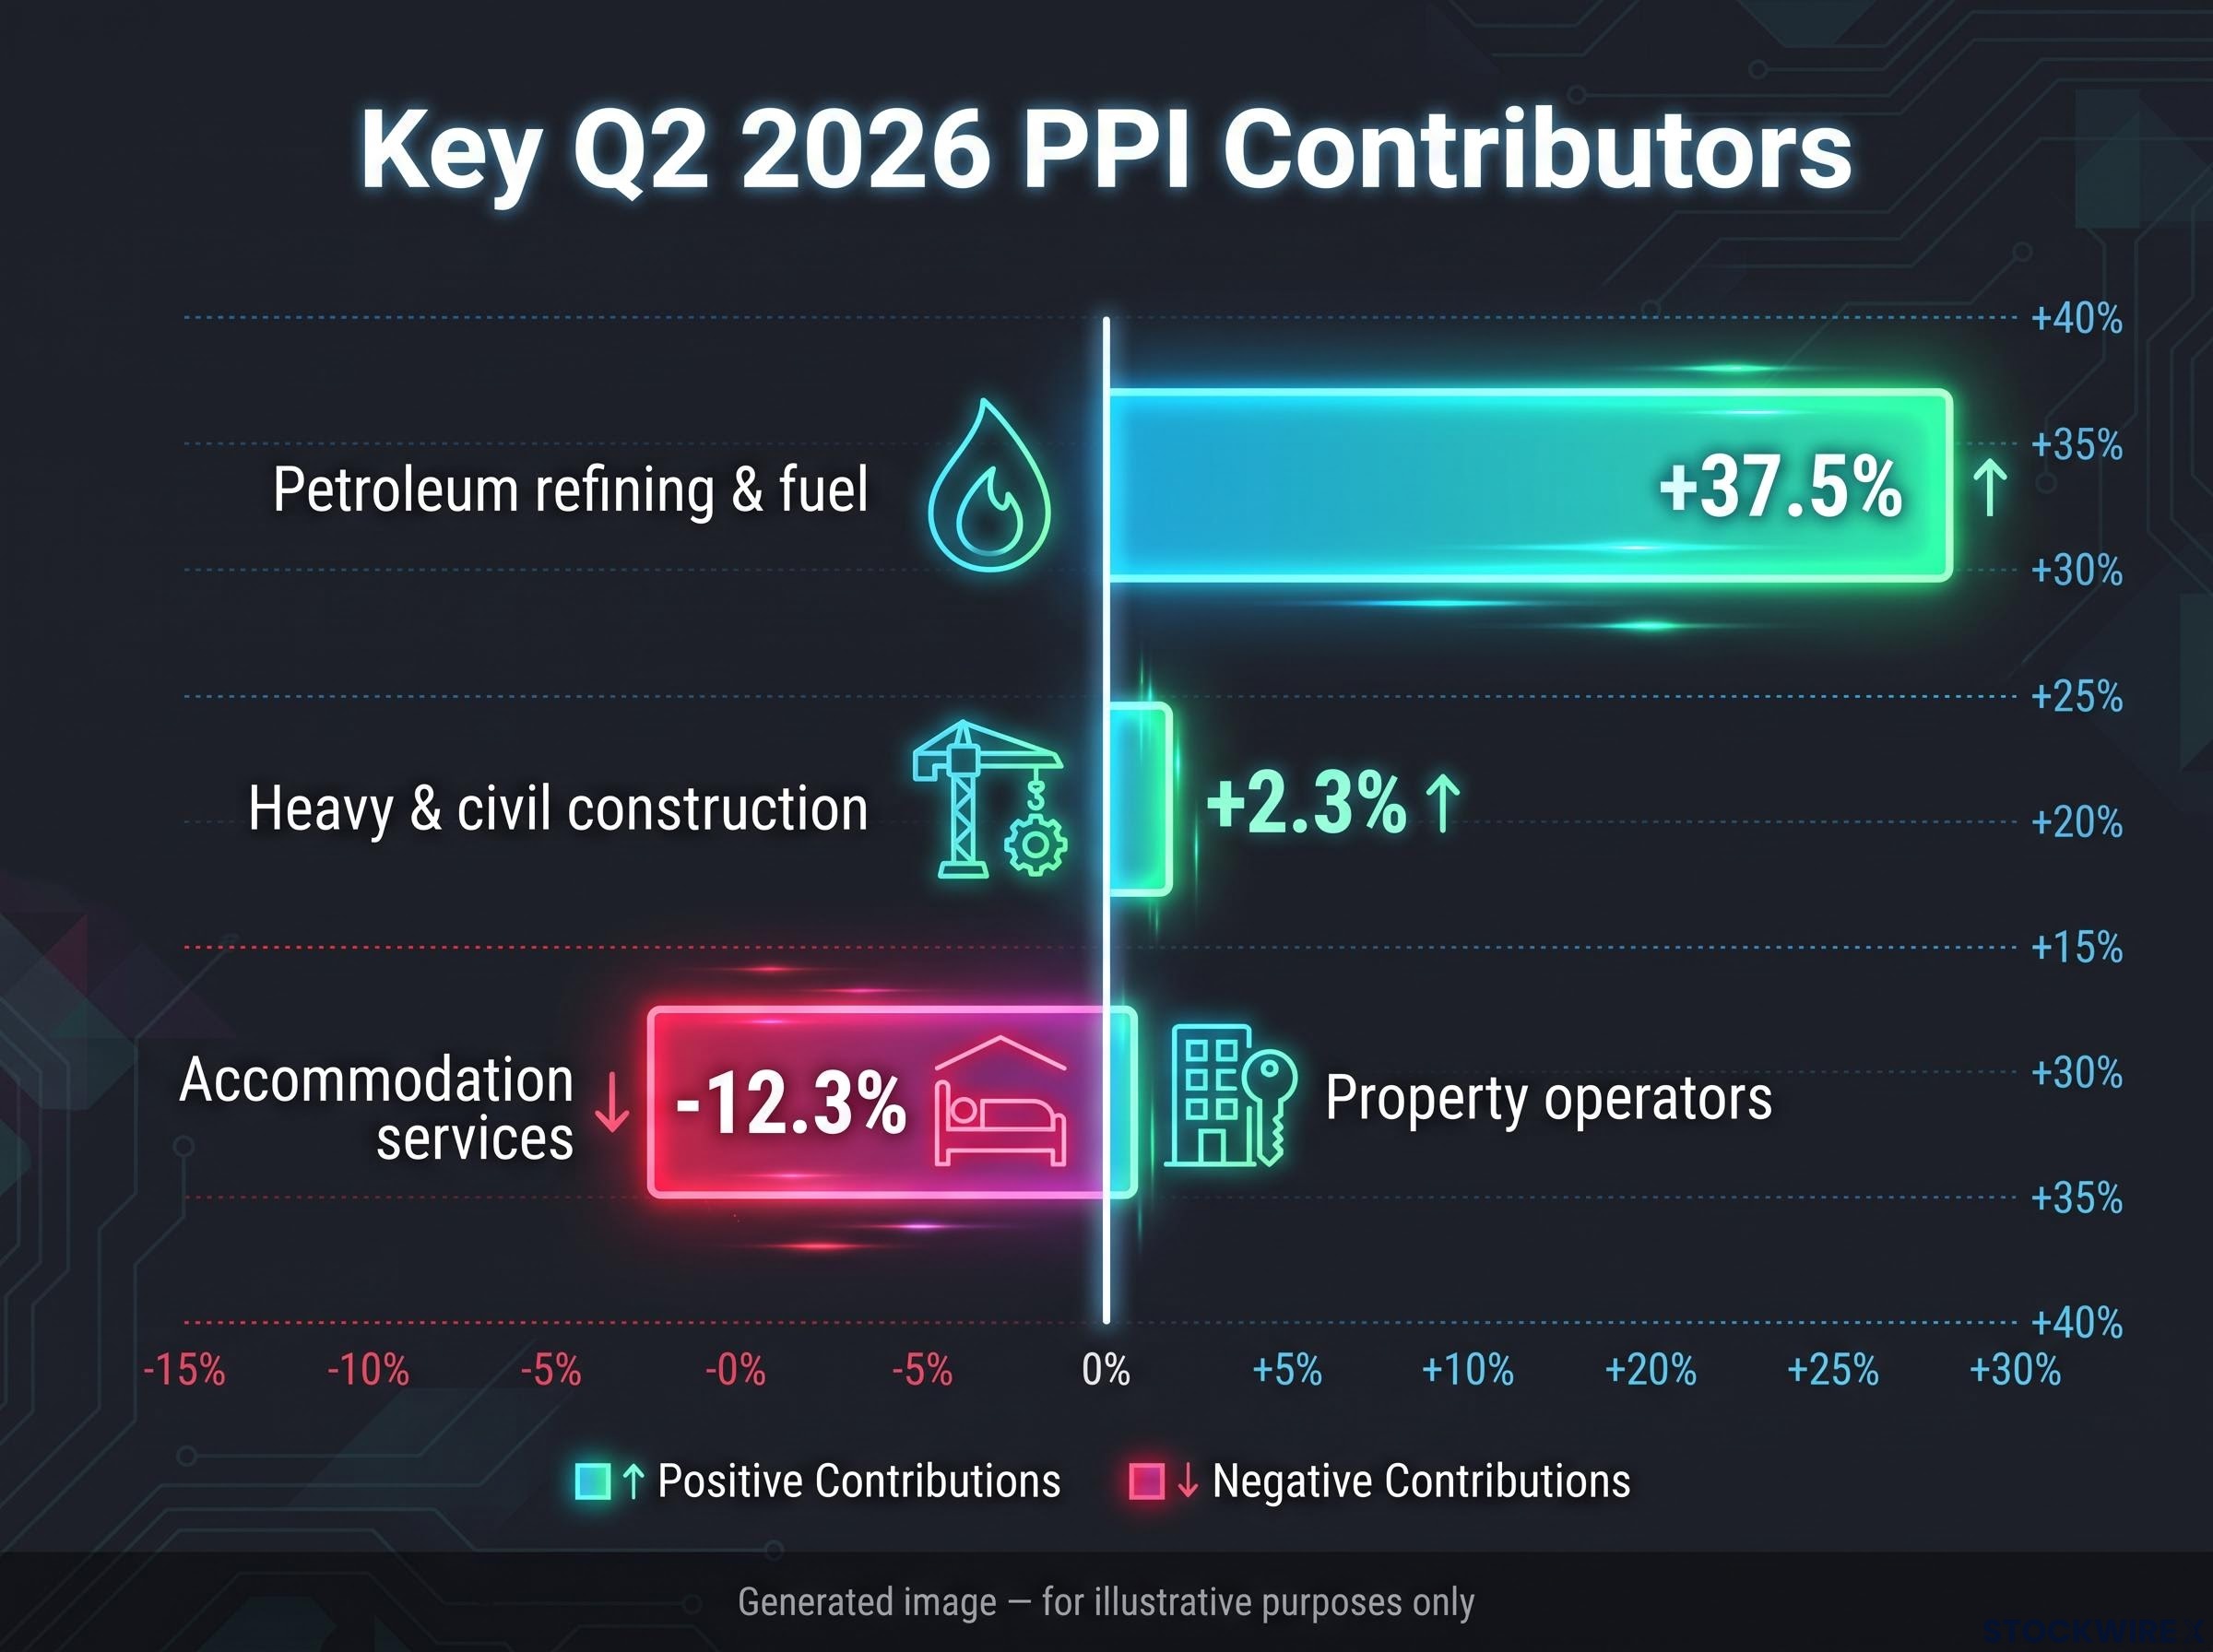
| Petroleum refining and fuel manufacturing | +37.5% | Upward | Flows into freight, transport, and energy costs economy-wide |
| Heavy and civil construction | +2.3% | Upward | Raises infrastructure and housing project costs |
| Property operators | +1.0% | Upward | Feeds into residential rents and CPI housing component |
| Transport, manufacturing inputs, childcare, takeaway food | Various increases | Upward | Broad-based cost pressure across consumer-facing categories |
| Accommodation services | -12.3% | Downward | Seasonal winter weakness; partial offset only |
The petroleum figure stands out at +37.5%, driven by higher oil prices linked to Middle East supply disruptions. But the construction and property operator contributions are arguably more consequential for the medium-term outlook, because those costs are structural rather than volatile.
Why energy and construction costs make this PPI print harder to dismiss
Energy and construction input costs do not unwind quickly. Unlike an agricultural price spike caused by a single weather event, fuel manufacturing costs are tied to global crude markets and geopolitical dynamics, while construction costs reflect labour shortages, materials demand, and freight pricing that shift slowly. These same cost categories feed into non-tradable inflation, the component of CPI the RBA watches most carefully when assessing domestically driven price pressure. That makes the composition of this PPI print harder for the central bank to look past.
Fuel and energy cost pass-through into broader CPI categories was already flagged as a second-round risk in Q1 2026, when automotive fuel prices surged 32.8% monthly and electricity costs rose 25.4% annually, establishing the pipeline that the Q2 PPI petroleum figure is now extending.
The CPI-PPI gap and what it tells the RBA
Earlier in the same week, the Q2 CPI print arrived and was widely described as benign. The two releases, read side by side, tell a more complicated story.
| Indicator | Period | Result | Prior Period | Consensus |
|---|---|---|---|---|
| PPI (final demand, q/q) | Q2 2026 | +1.3% | +0.4% (Q1) | ~+0.3% |
| PPI (final demand, y/y) | Q2 2026 | +3.6% | +3.0% (Q1) | N/A |
| CPI (headline, q/q) | Q2 2026 | +0.6% | +1.4% (Q1) | N/A |
| CPI (headline, y/y) | Q2 2026 | +4.0% | ~4.1-4.2% | ~4.4% |
| Trimmed mean CPI (y/y) | Q2 2026 | +3.6% | N/A | 3.7-3.8% |
Headline CPI slowed to +0.6% quarter-on-quarter, down from +1.4% in Q1, and annual headline CPI came in at +4.0%, below the consensus of approximately +4.4%. Taken alone, that looked like progress.
But trimmed mean CPI, the RBA’s preferred measure of underlying inflation, printed at +3.6% year-on-year. That is slightly below the RBA’s own forecast of 3.7-3.8%, but still comfortably above the 2-3% target band.
Trimmed mean CPI at +3.6% year-on-year remains above the RBA’s 2-3% target band, a constraint that persists regardless of what headline CPI printed this quarter.
The gap between upstream and downstream inflation is widening, not closing. PPI at +1.3% quarter-on-quarter versus CPI at +0.6% quarter-on-quarter means producer costs are accelerating faster than consumer prices, which implies either margin compression ahead for businesses or eventual pass-through to consumers, or both. For investors pricing in early RBA rate cuts, this data combination is a direct challenge. The RBA cannot confidently ease while upstream costs are accelerating and core CPI remains outside the target band, regardless of one softer headline CPI quarter.
The higher-for-longer rate path framing is reinforced by the RBA’s own published forecasts, which placed a return to the 2-3% target band no earlier than 2028, and the Q2 2026 PPI data does nothing to shorten that timeline.
China’s dual PMI contraction and why both sectors crossing below 50 matters
A PMI (Purchasing Managers’ Index) is a monthly survey of purchasing managers that synthesises new orders, output, employment, and supplier delivery times into a single index. The number 50 is the expansion-contraction boundary: above 50 signals growth, below 50 signals contraction.
Single-sector dips below 50 are routine and often temporary. Markets absorb them regularly. What is far less common is a simultaneous manufacturing and services contraction, which signals that the slowdown is broad-based rather than confined to one part of the economy.
| Indicator | July 2026 | June 2026 | Consensus |
|---|---|---|---|
| China Manufacturing PMI | 49.2 | 50.3 | 49.9 |
| China Services (Non-Manufacturing) PMI | 49.0 | 50.2 | 50.0 |
Both readings missed forecasts. Both reversed from expansion (above 50 in June) to contraction (below 50 in July) in a single month.
Both China’s manufacturing and services PMIs moved from expansion to contraction in a single month, reversing June’s readings. This is not a sector-specific wobble but a simultaneous, broad-based slowdown.
The dual contraction tells you this is not a manufacturing inventory adjustment or a services-only demand dip. It is a simultaneous broad-based slowdown, and that changes how commodity demand and export pricing assumptions should be treated in ASX models. China is Australia’s largest trading partner. The character of its slowdown, whether broad or narrow, demand-driven or supply-driven, determines how quickly and how deeply the pressure propagates into Australian commodity prices and earnings.
How China’s slowdown transmits to ASX sectors
The PMI contraction does not affect the ASX as a single aggregate force. It moves through specific commodity chains, each with its own speed and mechanism:
- Iron ore and steel chain (immediate): Weaker manufacturing and construction activity correlates directly with softer steel output growth, weighing on iron ore demand and pricing. ASX-listed iron ore producers and mining services names feel this first.
- Thermal and metallurgical coal (medium-term): Industrial contraction reduces thermal burn and can soften metallurgical coal demand over time. Contract structures create a lag, but forward pricing and sentiment react faster.
- Base metals and battery commodities, including copper, nickel, zinc, and lithium (medium-term): Heavily tied to Chinese industrial production, infrastructure, and property. A dual PMI contraction is a broad demand-softening signal across this group.
- Agricultural and premium food exports (lagged): Services PMI weakness can weigh on Chinese consumer spending on premium food imports. The effect is more indirect and slower than for bulk commodities, but relevant for Australian producers targeting the Chinese consumer.
Financial markets often price in these PMI signals faster than the underlying physical commodity markets adjust. Share prices of exposed names may move before the physical supply-demand balance shifts, meaning the risk can arrive in portfolios before it appears in commodity spot prices.
ASX sector rotation during oil shocks does not affect the index uniformly: energy producers captured around 40% gains year-to-date as LNG contract revenues repriced, while miners absorbed higher diesel and freight costs without a corresponding iron ore uplift, a split that the current PPI petroleum contribution sharpens rather than resolves.
The distinction between direct China volume exposure (bulk commodity exporters) and indirect thematic exposure (such as global EV supply chain participants) matters here. The risk profiles differ, and investors should not treat the PMI data as a binary sell signal but as a prompt to review how earnings models hold up under lower commodity price decks or reduced Chinese demand volumes.
Rate-sensitive and margin-sensitive sectors feel the domestic side
The domestic transmission of hotter PPI runs through a different set of names entirely. REITs, infrastructure, and utilities face cap rate and discount rate pressure if rates stay higher for longer, because their valuations are mechanically sensitive to the cost of capital. Consumer discretionary and industrial names face a different risk: margin compression if energy, freight, and construction input cost increases cannot be fully passed through to customers.
These sectors are not directly China-exposed. They are vulnerable to the domestic side of the macro squeeze that the PPI data describes.
Where the macro setup leaves ASX investors today
The 31 July 2026 data combination describes a two-sided squeeze. Domestically, re-accelerating producer prices complicate RBA easing and raise upstream cost risk for margin-sensitive businesses. Externally, China’s dual contraction raises downside risk for commodity demand and resource-sector earnings. The probability of a clean scenario, rapidly falling inflation, quick RBA cuts, and strong external demand, has decreased.
The probability of a clean goldilocks scenario has decreased. The risk of a period featuring sticky domestic cost pressures alongside weaker external demand has increased.
Four practical considerations for ASX investors:
- Reassess rate-cut timing assumptions baked into valuations, particularly for REITs and infrastructure. Stress-test these names under slower and smaller rate-cut paths; prioritise those with manageable debt profiles and long-dated fixed-rate funding.
- Focus on pricing power and demonstrated ability to pass through cost increases. In consumer and industrial names, favour businesses that have shown they can raise prices without losing volume, especially where input costs are clearly rising.
- Review China commodity exposure and distinguish between direct volume exposure and thematic exposure. Consider how earnings and valuation multiples look under lower commodity price decks or weaker Chinese demand scenarios.
- Avoid over-concentration in single macro narratives such as “the RBA will cut quickly” or “China stimulus resolves everything” when leading indicators are pointing in a more cautious direction.
What would change this picture: a meaningful moderation in Q3 PPI, a sustained rebound in China’s PMI back above 50, or a shift in RBA language that explicitly discounts pipeline PPI pressure. Until one of those materialises, the burden of proof has shifted. Assets priced for an optimistic macro scenario now need to demonstrate why these signals should not be weighted in the analysis.
For investors wanting to translate the macro setup described here into specific portfolio tilts, our dedicated guide to ASX inflation positioning maps the risk and opportunity profile of banks, REITs, resources, and inflation-linked bonds, with concrete ETF vehicles for each sector.
This article is for informational purposes only and should not be considered financial advice. Investors should conduct their own research and consult with financial professionals before making investment decisions. Past performance does not guarantee future results. Financial projections are subject to market conditions and various risk factors.