
A level that UOB had called “strong resistance” for weeks has given way, and the bank did not turn bullish on the Australian dollar. It moved to neutral. With AUD/USD sitting near 0.6970 on 7 October 2026, according to the Reserve Bank of Australia (RBA), the shift raises a question for anyone tracking the AUD/USD outlook: why did a break above 0.6985 produce a shrug rather than a cheer?
UOB had held a negative view on the Aussie since mid-September. That view did not collapse overnight. It eroded over several sessions, with each update giving a little more ground.
How a strategist changes their mind can teach you more than the call itself. Here is how to read the levels behind the shift, and what would need to happen for neutral to become something firmer.
From 0.6930 to 0.6985: how UOB’s view gave way in a week
Last Friday, the pair traded at 0.6930 and the bearish case looked settled. Within three sessions, the condition UOB had set for abandoning it had been met.
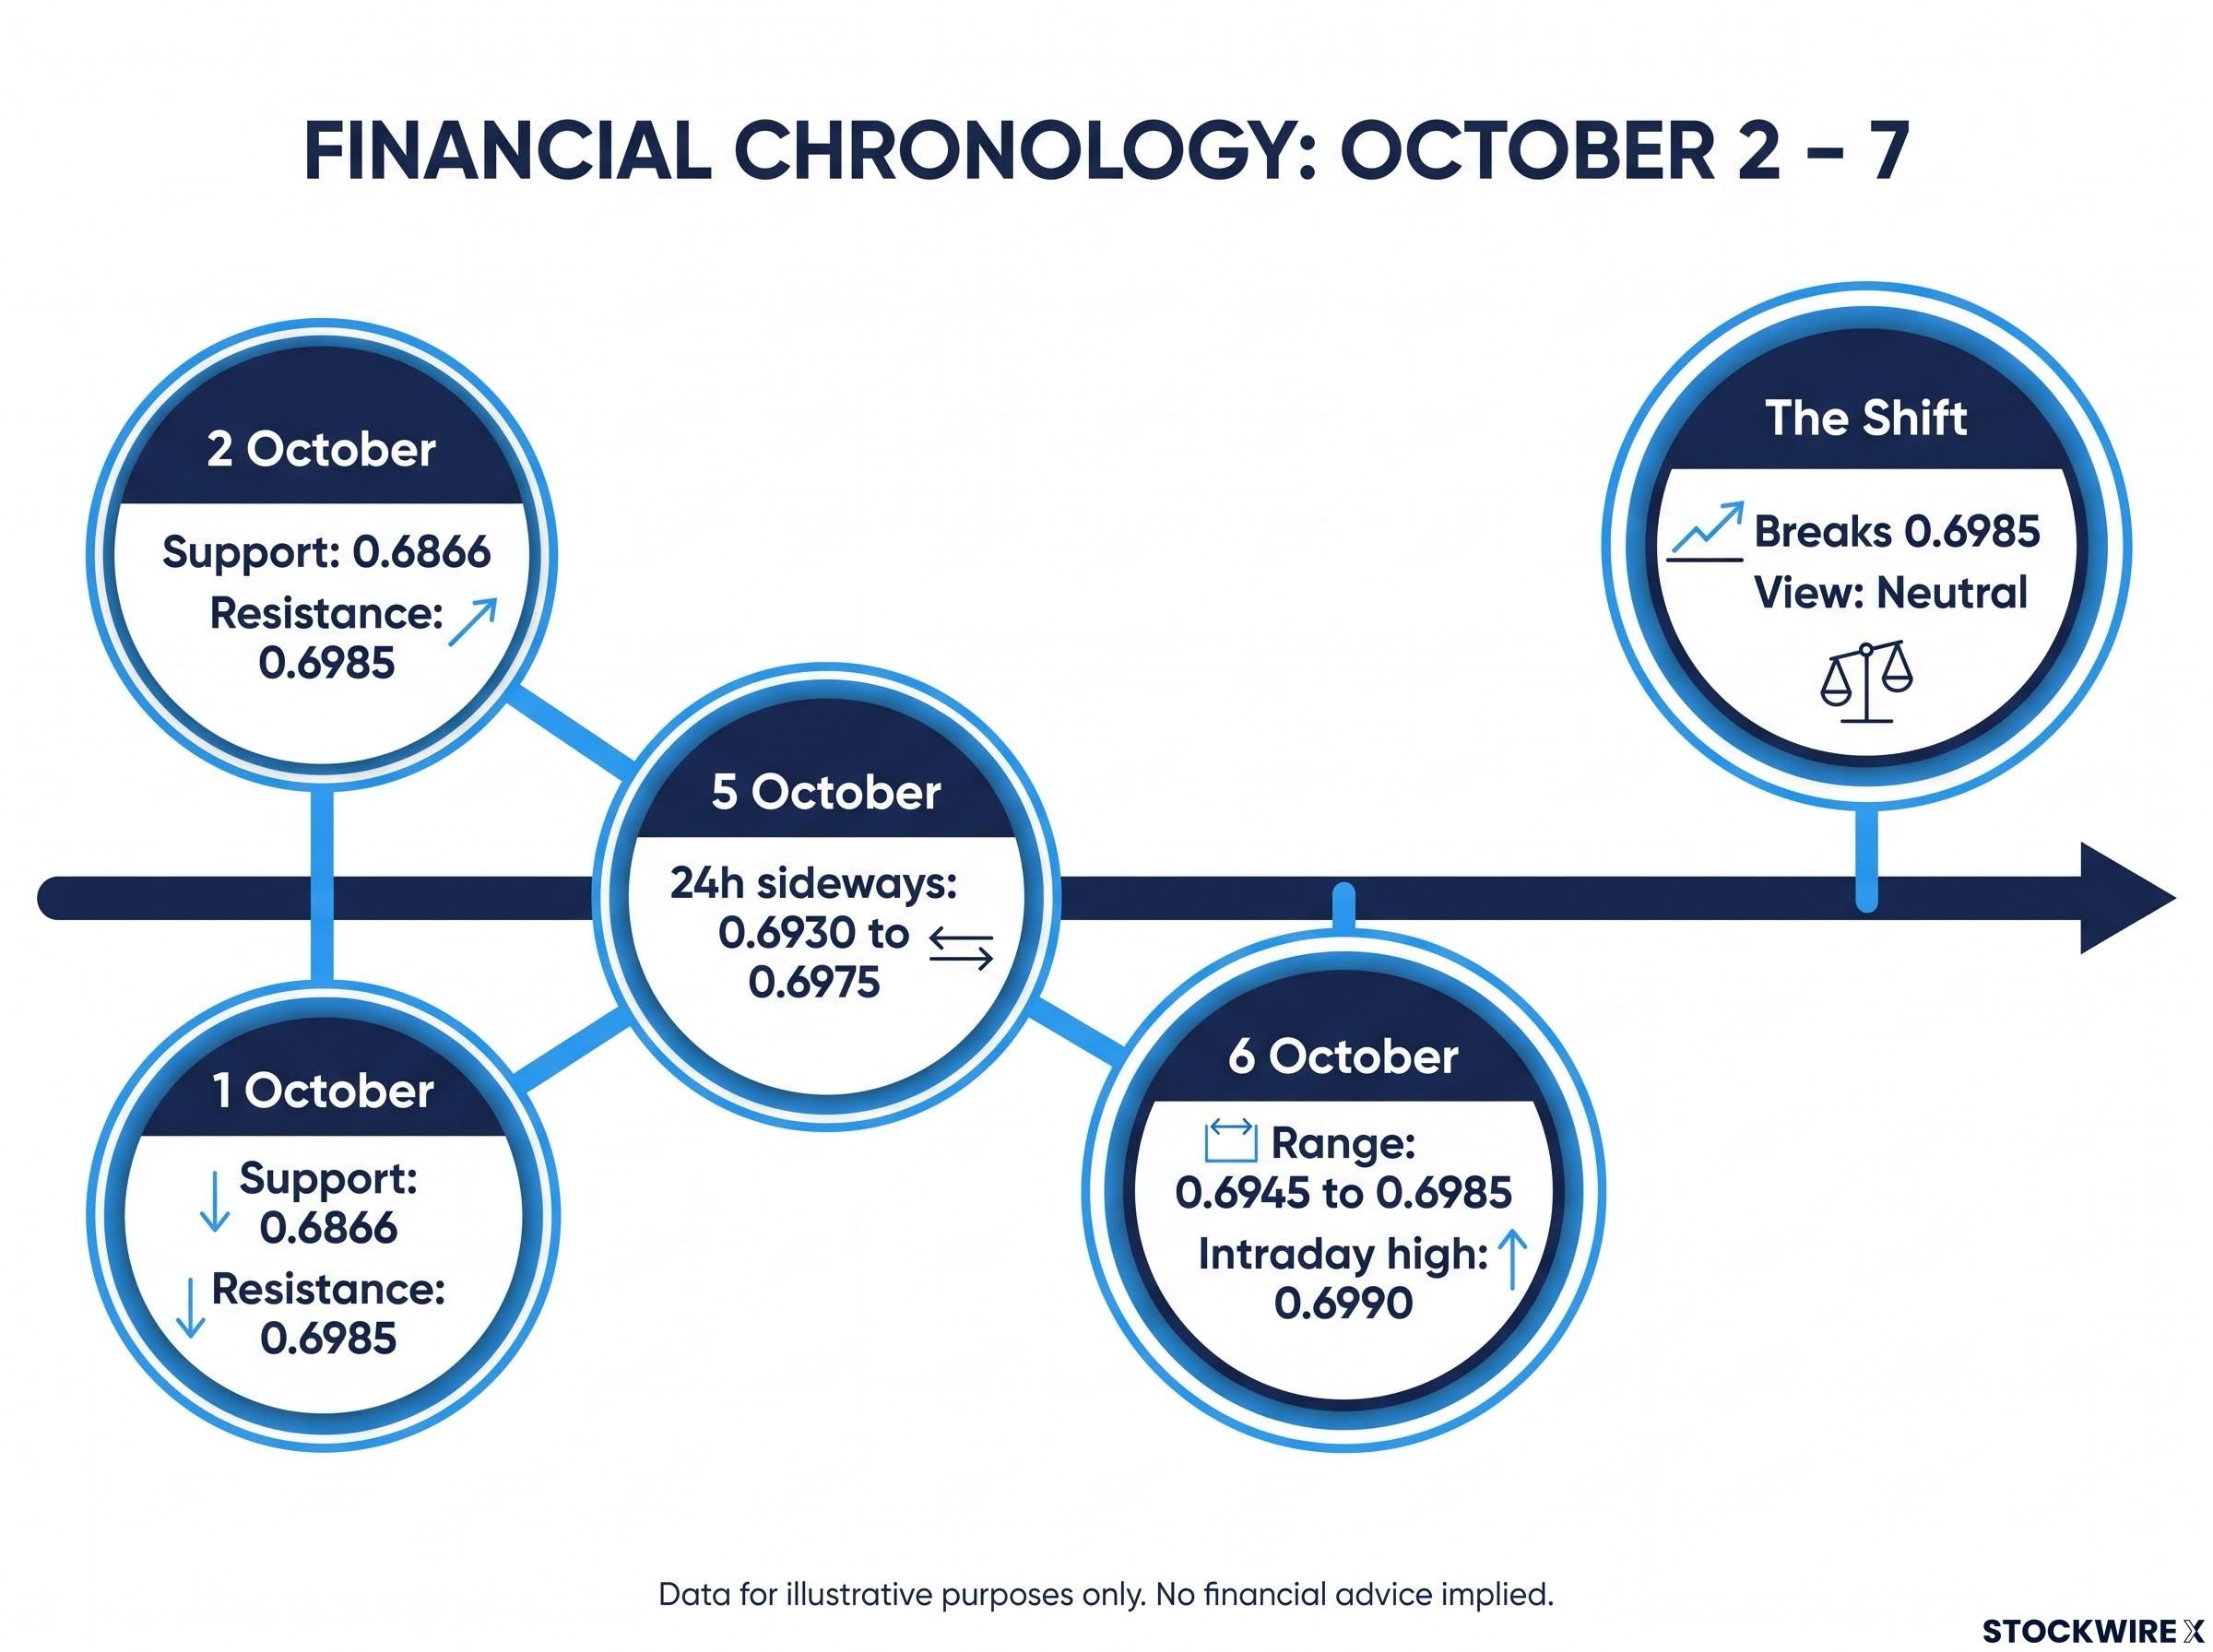
The sequence, drawn from commentary by UOB strategists Quek Ser Leang and Lee Sue Ann via the FXStreet Insights Team, ran like this:
- 2 October: The weakness that began in mid-September remained intact. However, the pair was deeply oversold, so further declines might fall short of the next major support at 0.6866.
- 5 October: The 24-hour view called for sideways trade between 0.6930 and 0.6975. The 1-3 week view was unchanged.
- 6 October: UOB expected the pair to edge higher within 0.6945-0.6985, and saw a clear break above 0.6985 as unlikely for the day. It also noted that downward momentum was starting to slow.
- The shift: AUD then pushed above 0.6985, and UOB moved to neutral.
The trigger had been spelled out from the start.
The line in the sand On 2 October, UOB said only a breach of 0.6985, which it labelled “strong resistance”, would indicate the weakness was stabilising.
The remark about slowing momentum on 6 October was the quiet early warning. Improved risk appetite helped the pair extend its gains that day, and it briefly topped 0.6985 despite UOB’s forecast that it would stay below. Sources differ on the exact closing levels for 5 and 6 October, but reporting puts the 6 October high at 0.6990.
This tells you the view was conditional all along. By naming the invalidation level in advance, UOB turned the break into a planned exit from the thesis rather than a surprise. You get more from a forecast when you read it as a set of if-then conditions instead of a prediction.
When big ASX news breaks, our subscribers know first
How to read the levels and ranges behind the call
Plot UOB’s numbers on a chart and they form a ladder. Each rung has a different job.
| Level | Role | What it signals |
|---|---|---|
| 0.6866 | Major support | Prior downside target, now seen as out of reach |
| 0.6923 | July trough | Earlier focus for the medium-term bearish case |
| 0.6935 | Lower bound of 1-3 week range | Potential new support |
| 0.6985 | Former strong resistance | Broken; now a reference point for the recovery |
| 0.6990 | 6 October intraday high | Highest point reached during the break |
| 0.7020 | Upper bound of 1-3 week range | First test of any upside case |
Support is a price level where buying has tended to stop a decline. Resistance is a level where selling has tended to cap a rise. When a resistance level breaks, traders often watch it as a reference floor, because a fall back below it would suggest the break did not hold.
Oversold describes a market that has fallen quickly enough that sellers may be running out of steam. That condition is why UOB doubted the pair would reach 0.6866 even before the break. Once 0.6985 gave way, the bank said the major support was out of reach, meaning the path lower now requires reversing the entire recovery first.
The two ranges answer different questions. The 24-hour range of 0.6965-0.6995, with a slight rise expected, is about today’s trade. The 1-3 week range of 0.6935-0.7020 sets a neutral, sideways frame running through late October.
Width and position are the read. The longer range spans roughly 85 pips, and spot sits closer to the top than the bottom, so UOB sees room in both directions without favouring either. That lets you judge whether your own entry or exposure sits inside the expected zone or is betting on a breakout from it.
Treating a forecast as a set of if-then conditions is the core of forex technical analysis, where support, resistance and momentum readings become scenario branches that are acted on only when price confirms a trigger.
Why ranges are probabilities, not promises
A range is a guide to likely trade, not a ceiling or floor. Surprise data, such as a US inflation reading or a growth shock from China, can push the pair outside it within hours.
UOB’s own language signals this caution. Calling the upward momentum “tentative” is a strategist telling you how much weight the range can bear.
Why neutral and not bullish? The logic of revising a view
The natural instinct is simple: resistance breaks, so you buy. UOB’s response suggests the instinct skips a few steps.
Three forces drove the move from bearish to neutral. Momentum slowed, conditions were oversold, and the line in the sand at 0.6985 broke. Together they weakened the case for selling, but none of them builds a case for buying.
Oversold signals deserve caution in a macro downtrend, since momentum indicators can stay depressed while price keeps falling, which is why UOB treated the stretched condition as a reason to doubt the downside target rather than as a buy trigger.
The caveat UOB describes the rise in upward momentum as “still tentative”.
The bank’s medium-term framework had leaned bearish, citing a bearish EMA crossover and the July trough near 0.6923. An exponential moving average (EMA) is an average of recent prices that gives more weight to the latest data; a bearish crossover occurs when a shorter EMA falls below a longer one. A single session above resistance does not erase that signal.
The difference between a lasting break and a false one usually shows up in what happens next:
- True breakout: a close above resistance, follow-through buying in later sessions, and rising volume
- False breakout: price pierces resistance intraday, then falls back below it
- Confirmation: strategists often want multiple closes above the level before trusting it
History points the same way, though the research does not identify specific dated episodes. AUD/USD has staged multi-month rallies after clean breaks of barriers such as 0.7000, typically when confirmed by multiple daily closes and a weaker US dollar. Breaks driven by one-off news, or followed by rising US yields, have tended to reverse.
The language has changed from “sell rallies” to “trade the range”. For you, neutral means the downside case has weakened without an upside case being proven. Neither direction deserves full conviction yet, and chasing a single-session break is the trade this framework warns against.
What could push the AUD/USD outlook back down?
The technical repair is genuine. The pair has cleared the level UOB said mattered, and the bank’s downside target has dropped out of view.
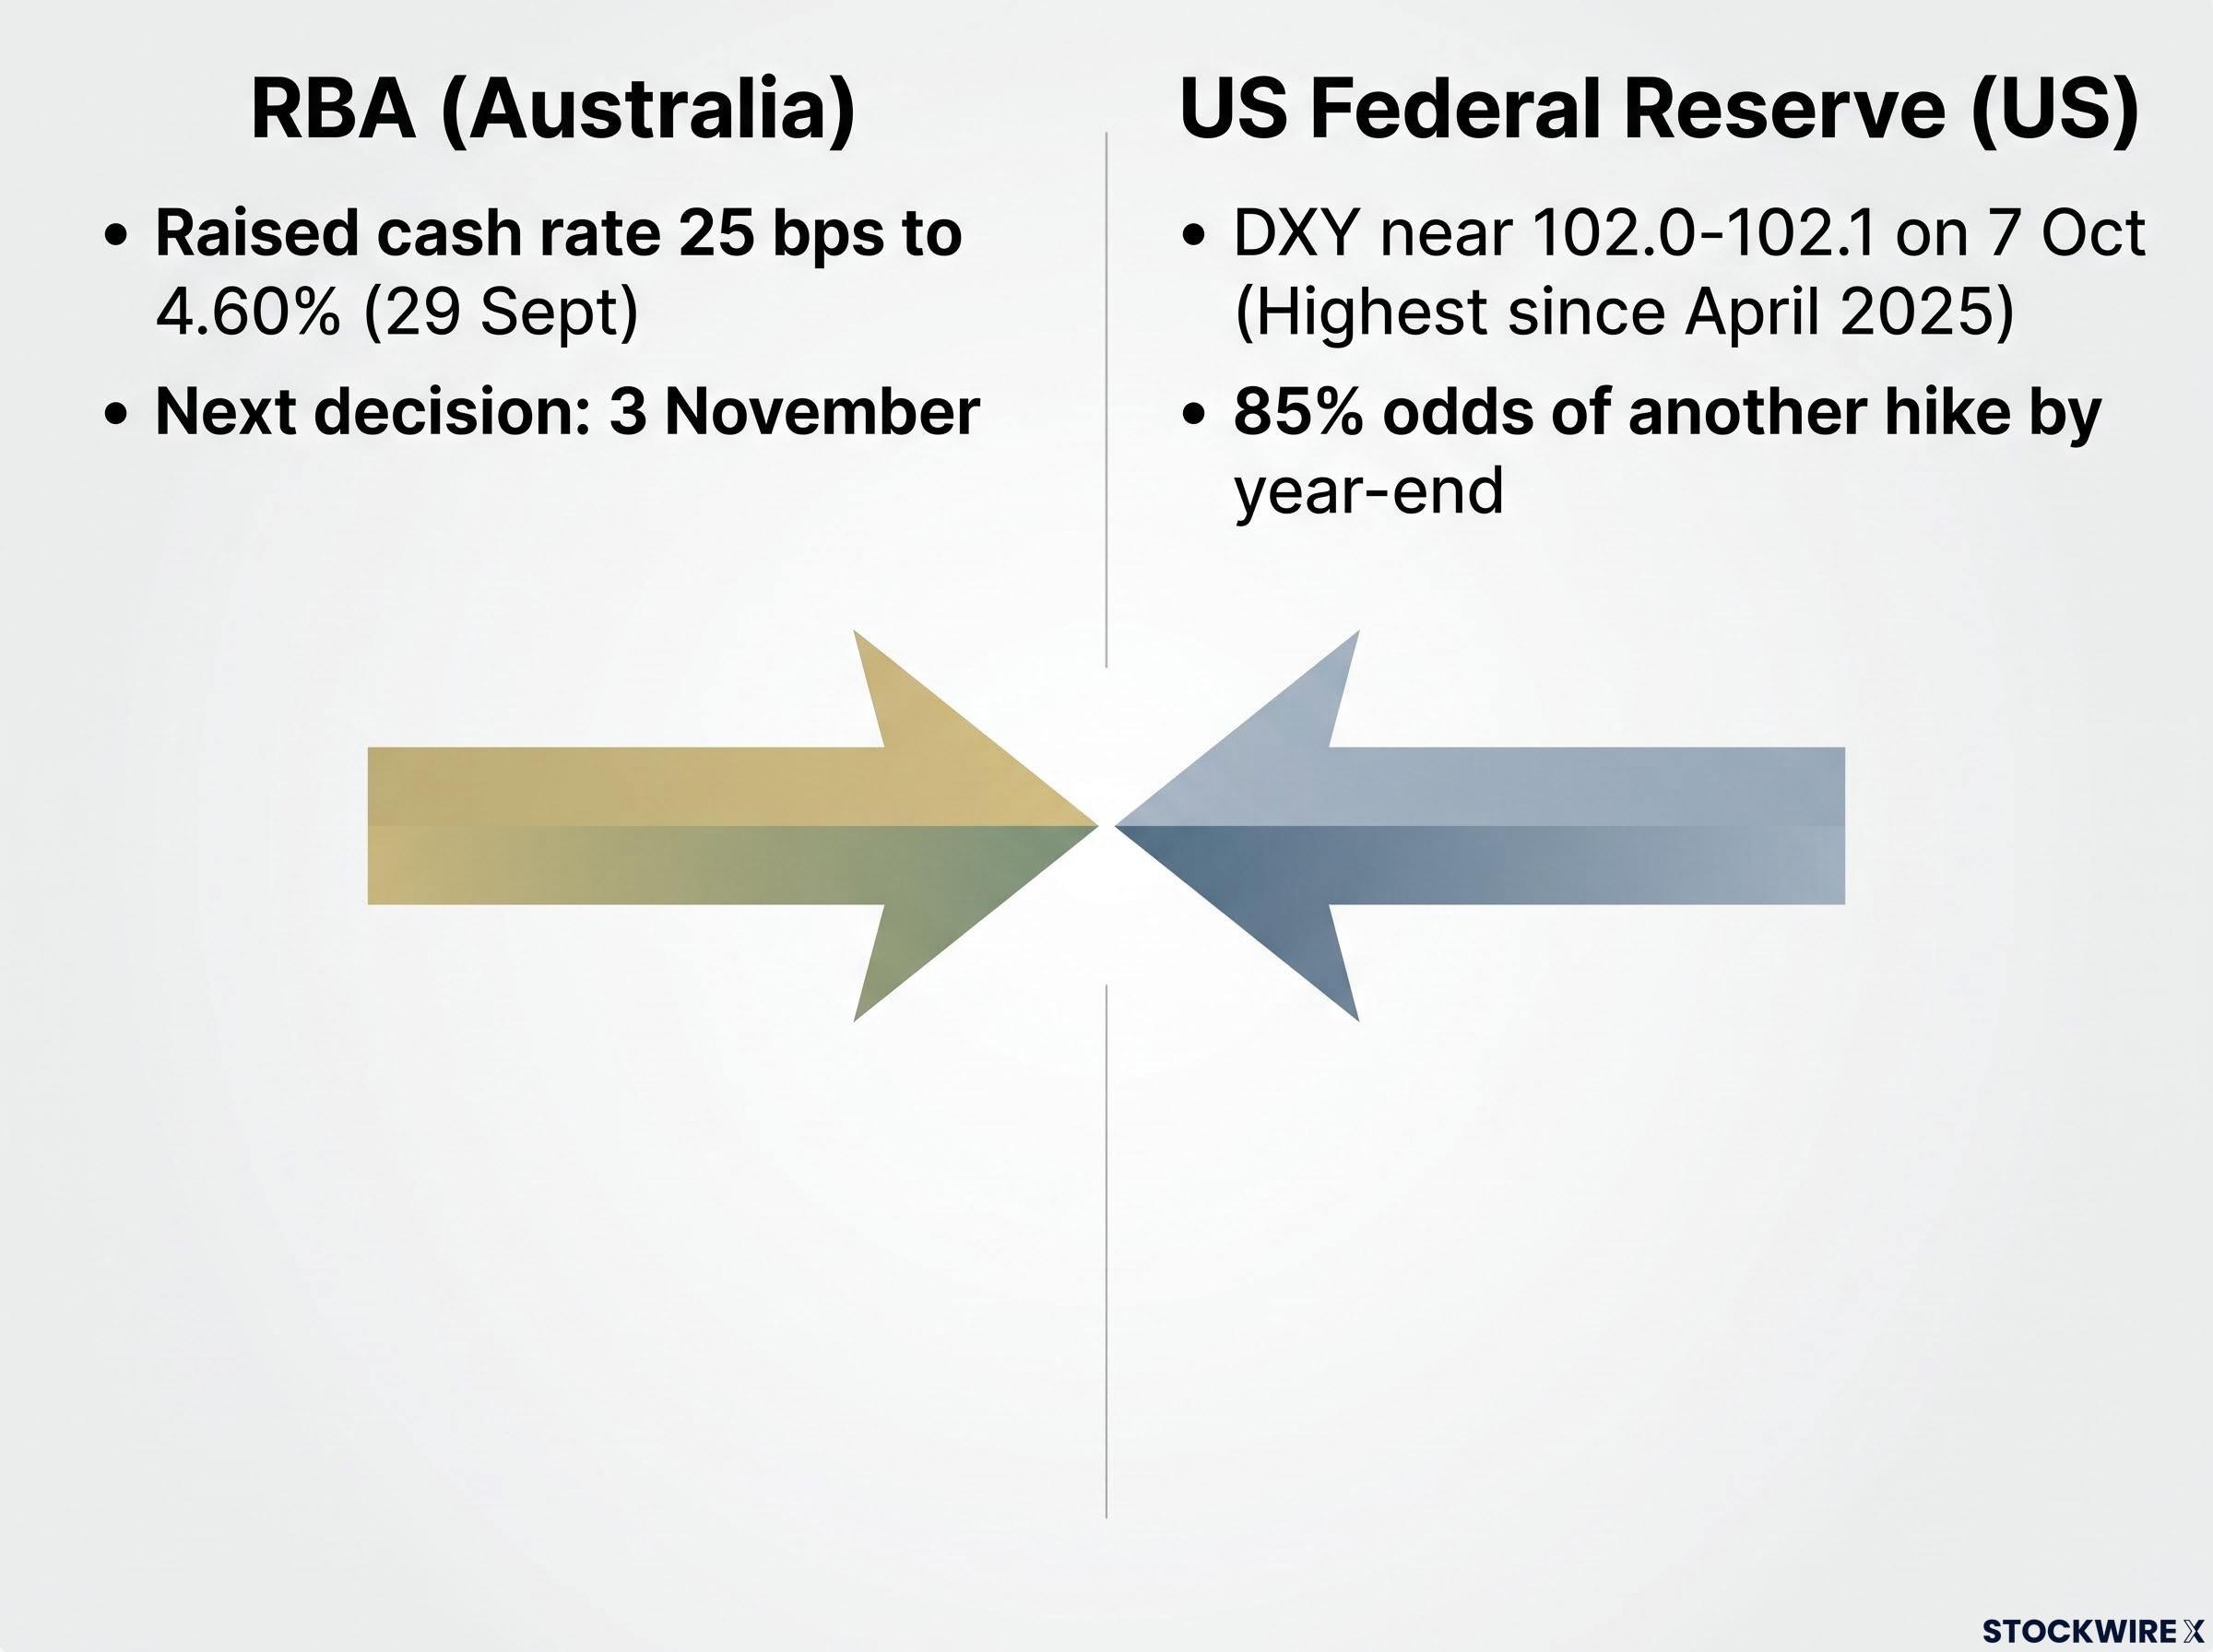
The macro backdrop is less forgiving. The RBA raised its cash rate by 25 basis points (0.25 percentage points) to 4.60% on 29 September, a hawkish move that typically supports a currency by lifting the yield it offers. Its next decision is due on 3 November.
The US dollar is pulling the other way. The US Dollar Index (DXY), which tracks the dollar against a basket of major currencies, traded near 102.0-102.1 on 7 October, close to its highest since April 2025, according to FXStreet and TradingKey. Its annual high of 102.54 came on Monday, with support cited near 101.80.
Futures markets are reportedly pricing about 85% odds of another US Federal Reserve hike by year-end, though this figure has not been independently confirmed. The latest Australian inflation and jobs data, the current Fed funds rate, specific Treasury yields and forecasts from rival banks were not available. UOB is the only institution with structured commentary found.
The main risks to the recovery:
- USD and yields: a fresh rise in US bond yields could lift the dollar regardless of Australian data
- Fed expectations: strong US labour or inflation figures could keep rate differentials wide
- RBA repricing: softer Australian growth could narrow the yield advantage
- China: AUD remains sensitive to Chinese construction, steel demand and commodity prices
- Risk-off: geopolitical escalation or equity sell-offs usually push money into the dollar and out of AUD
- Technical failure: a quick drop back below 0.6985 would validate the earlier caution
With the dollar near multi-month highs, treat any AUD gain as vulnerable to US yield moves, however solid the Australian numbers look.
What would confirm the recovery
The first test is the floor. Holding above 0.6935 support, with repeated closes above 0.6985, would turn a one-off break into a pattern.
A move toward 0.7020, the top of UOB’s range, would then be the first real test of an upside case.
For readers weighing what a genuine upside move needs, our detailed coverage of AUD/USD breakout conditions sets out the weekly close, Asian FX and Treasury yield tests analysts apply.
What the neutral call changes, and what it does not
The break above 0.6985 ended UOB’s bearish thesis. It did not start a bullish one. The 0.6935-0.7020 range through late October is the working frame.
The skill carries over to any currency forecast. Find the invalidation level, measure the range width and its position, then wait for confirmation rather than reacting to a single session.
Three variables now decide which way neutral resolves: the RBA’s decision on 3 November, the direction of US yields, and whether the pair holds above 0.6935.
The RBA’s tightening bias is the variable to watch before 3 November, because a softer statement could narrow the yield advantage supporting the Australian dollar within a single session.
This article is for informational purposes only and should not be considered financial advice. Investors should conduct their own research and consult with financial professionals before making investment decisions. Past performance does not guarantee future results. Forecasts and ranges cited are speculative and subject to change based on market developments.