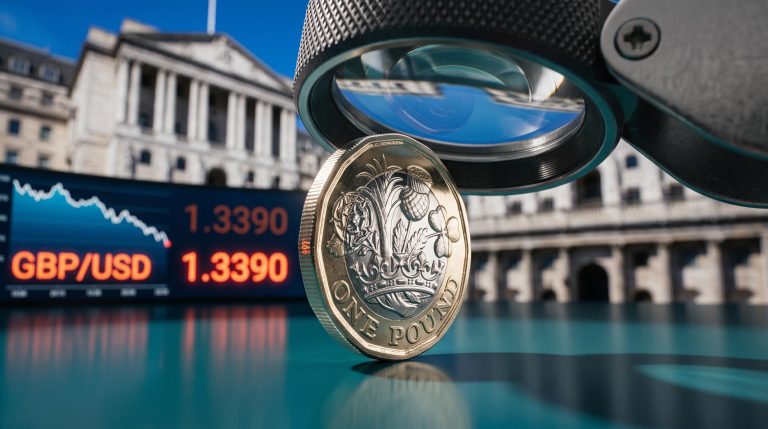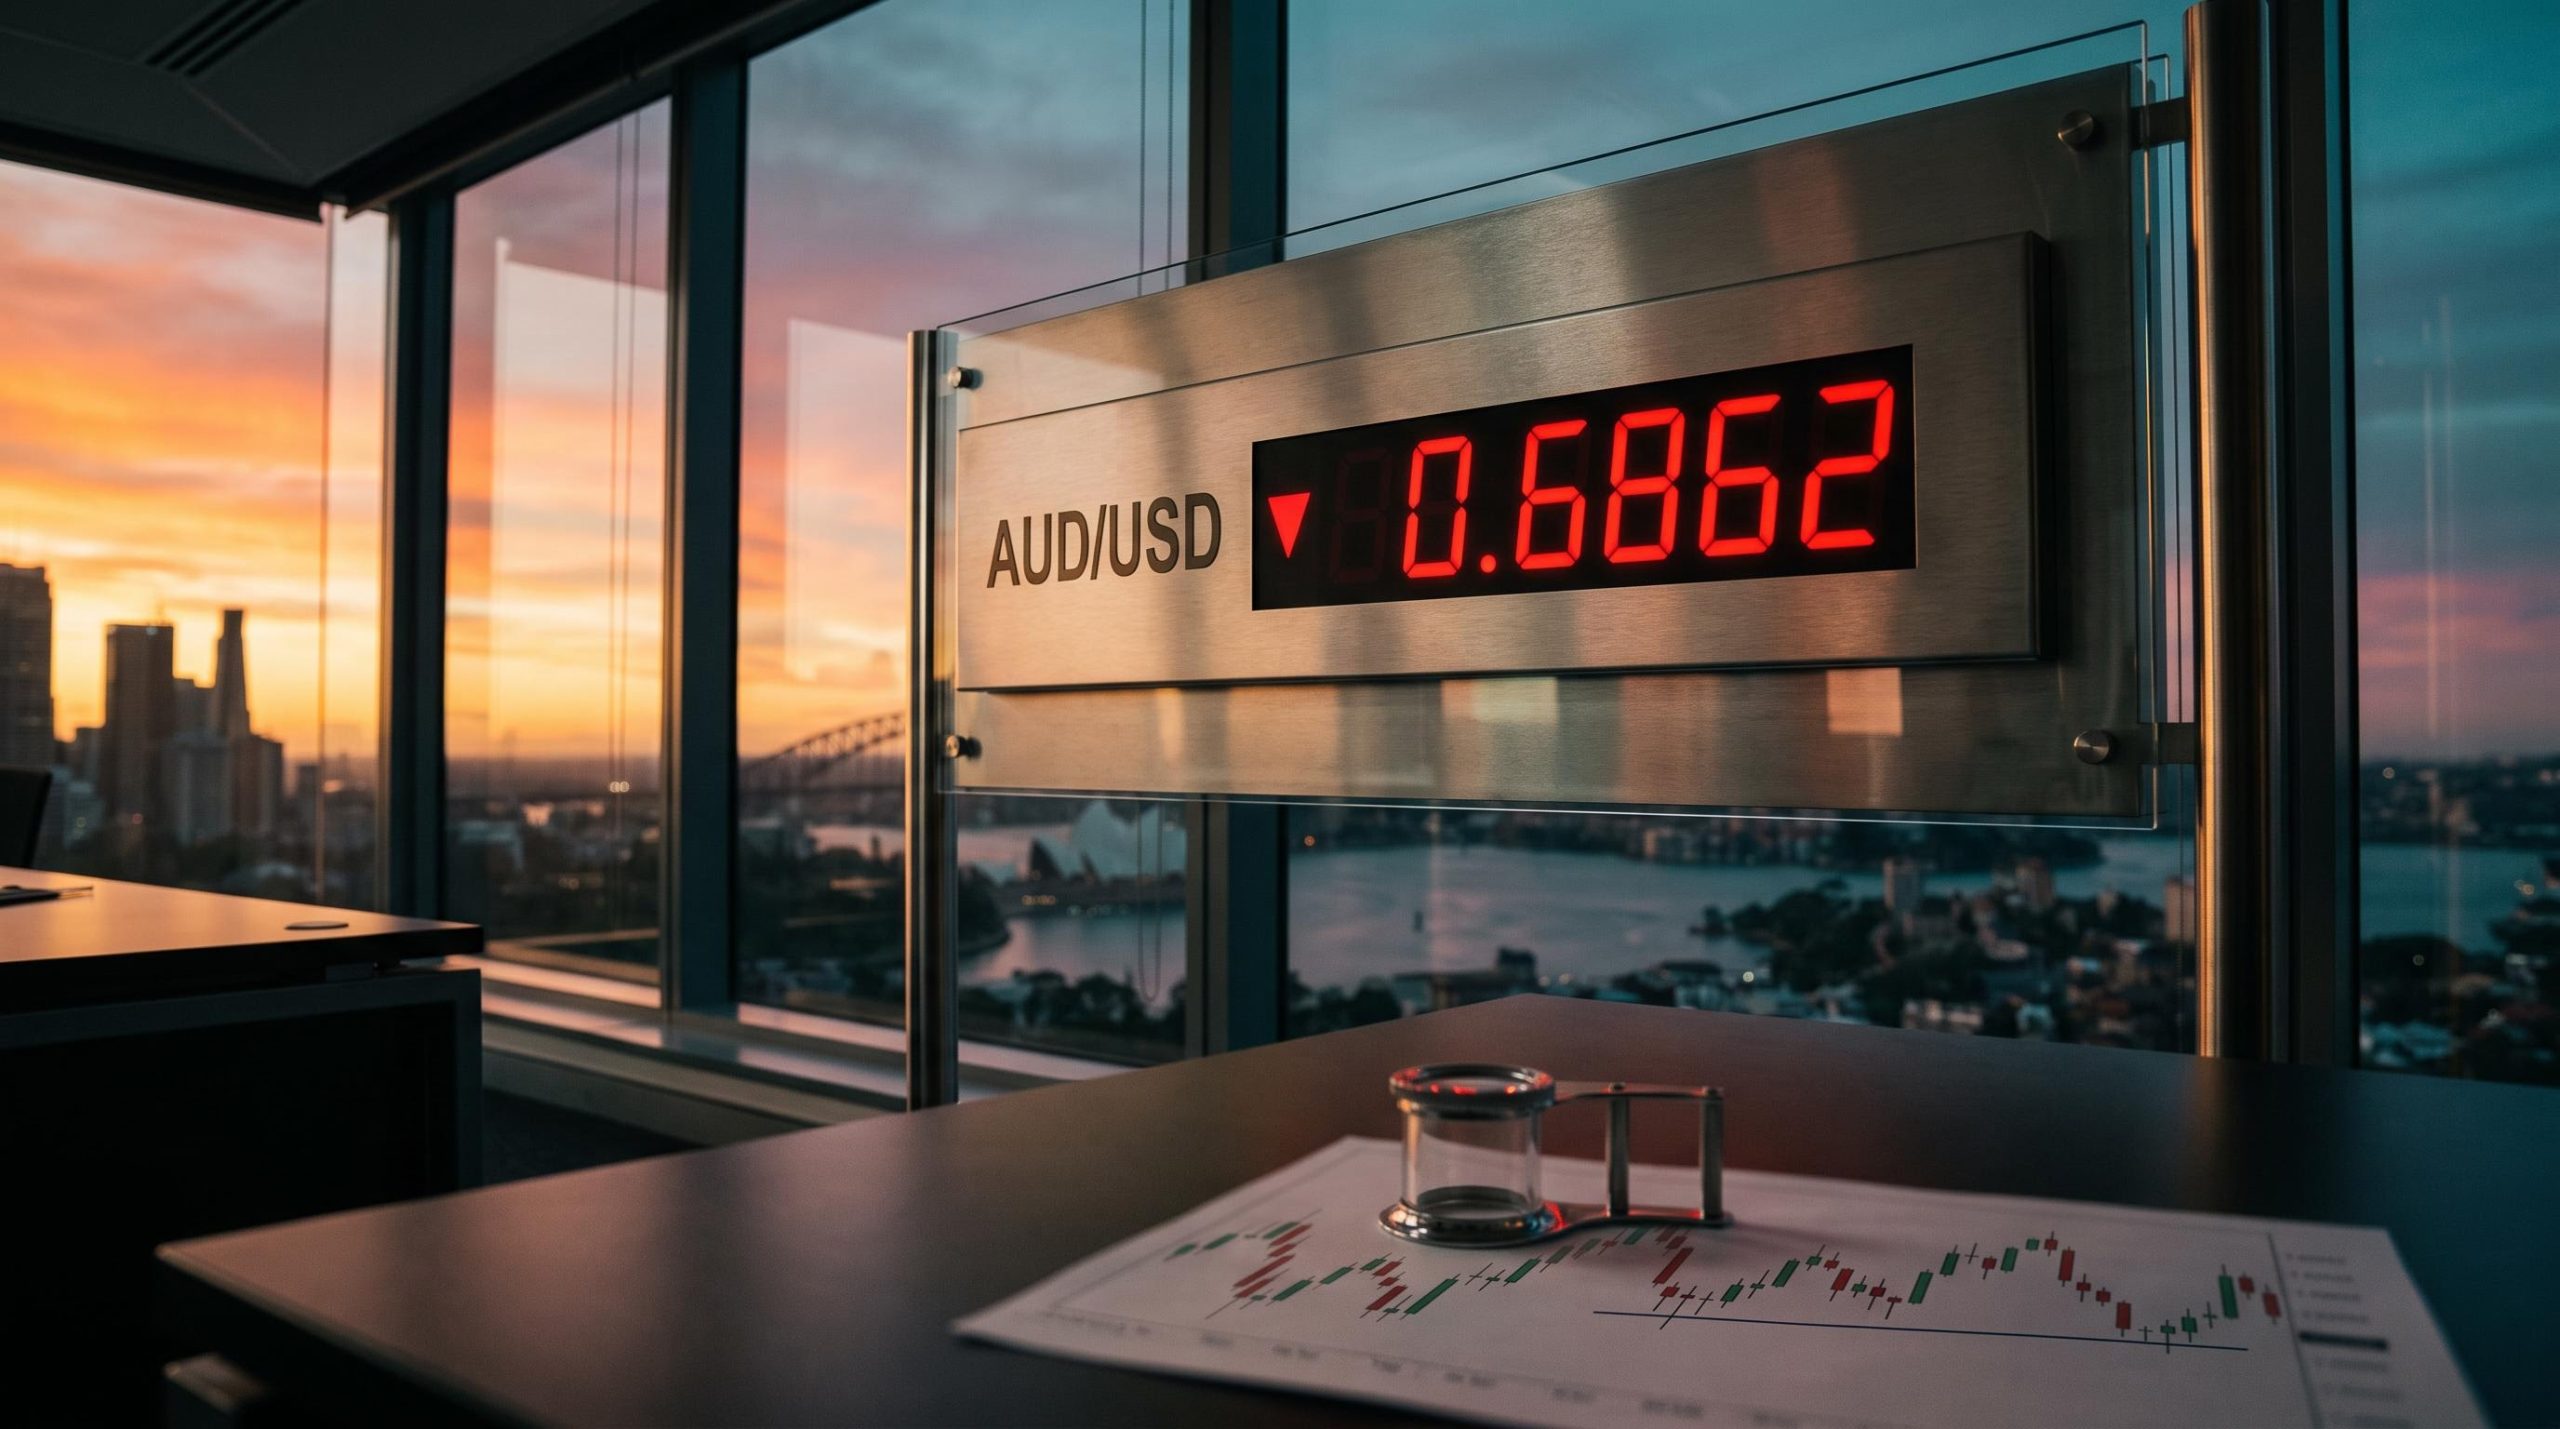
The Reserve Bank of Australia (RBA) raised its cash rate to 4.85% on 3 November. Three days later, on Friday 6 November, AUD/USD slid to 0.6862, a seven-month low. The higher rate did not protect the currency, and the reason matters for any AUD/USD forecast you read from here.
Three forces collided in a single week. A selloff in AI-infrastructure shares sent investors toward safety. A far stronger US jobs report revived talk of another Federal Reserve hike. The RBA’s decision arrived with a split vote and softer guidance. All figures here are as reported on 6-7 November 2026.
The value in this episode goes beyond one week’s price action. It shows how to read rate expectations, risk sentiment and chart levels together, and it gives you a method you can apply the next time a currency moves against what the headline rate seems to suggest.
Why did the US dollar rally while the AI selloff hit risk assets?
The dollar’s gains did not arrive all at once. They came in two stages, and the order matters.
The risk-off leg
The first push came from equities. As AI-infrastructure stocks fell, investors cut exposure to high-beta assets, meaning assets that tend to swing more than the broader market. Leveraged carry trades and equity positions were unwound, and the money moved into US dollars and Treasuries. Reuters had already linked the AI-driven slump to weaker risk sentiment and a firmer dollar on 3 November.
By the European session on Friday, the US Dollar Index (DXY), which measures the dollar against a basket of major currencies, was up 0.42% near 102.00, according to FXStreet. AUD/USD touched 0.6862, with Trading Economics recording 0.6864.
MUFG offers the counterweight. Its analysts called the spillover from the AI selloff into currency markets “surprisingly modest”, yet said the dollar had erased its post-midterm losses. The DXY had dropped to a monthly low near 101.00 after the Democrats won both the House and Senate earlier in the week.
The payrolls leg
Then the US jobs data landed, and the conversation shifted from risk-off to rate expectations.
| Measure | Consensus | Actual | Prior |
|---|---|---|---|
| October nonfarm payrolls | +65,000 | +165,000 | +60,000 (revised from +29,000) |
| Unemployment rate | 4.2% | 4.1% | 4.2% |
Reuters reported that the data gave the Fed more scope to raise rates in December, and the DXY extended its gain to about 0.7% at 102.18. The two DXY figures do not conflict. One reflects the European session and the other the move after payrolls. The day’s US dollar gains, per FXStreet, were:
The Fed rate hike in September had already shifted the backdrop, with Chair Kevin Warsh dropping forward guidance and leaving inflation prints and jobs data as the main drivers of expectations, which helps explain why one strong payrolls report moved pricing so sharply.
- About 0.91% vs NZD
- About 0.85% vs AUD
- 0.38% vs GBP
- 0.36% vs EUR and CAD
- 0.30% vs JPY
- 0.15% vs CHF
The ranking is the real signal. The Australian and New Zealand dollars sat at the bottom of the table, while the Swiss franc barely moved. That tells you this was a risk-sensitivity trade as much as a dollar trade, so look at who fell most rather than only at the dollar’s rise. A bid built on flows and repricing can fade faster than one built on a clean US growth story.
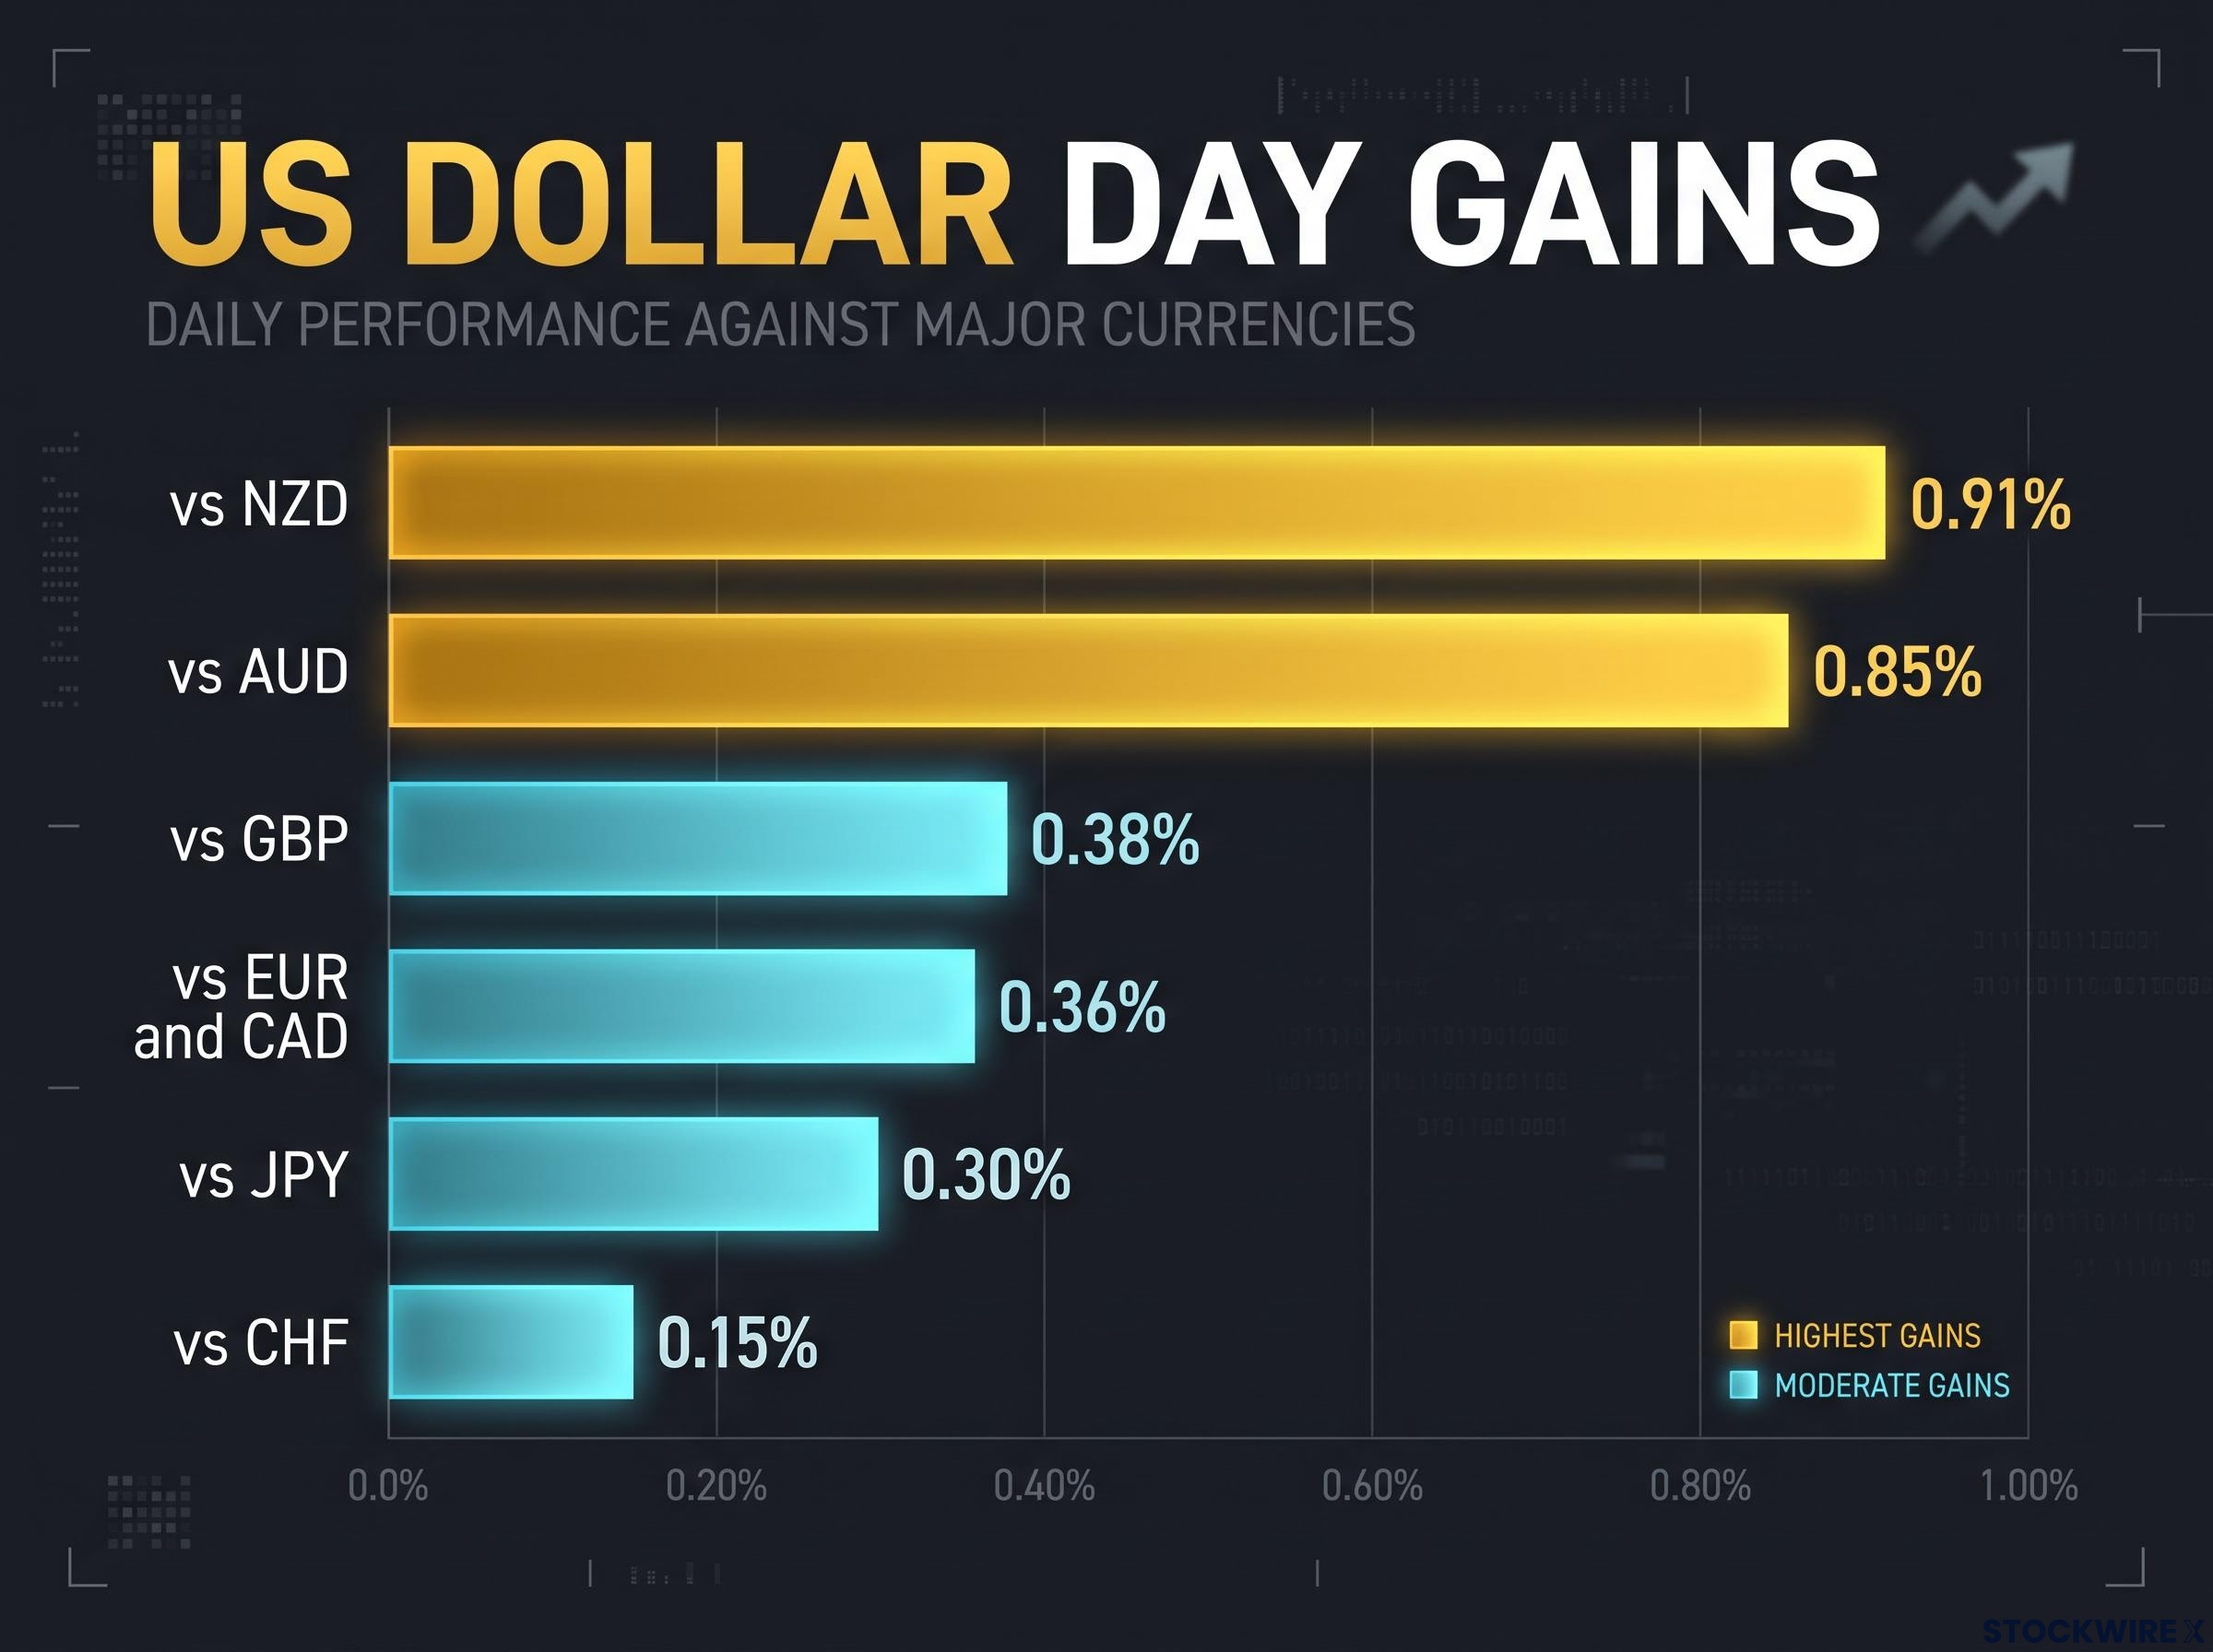
The US dollar posted its largest daily gains against the New Zealand dollar at 0.91% and the Australian dollar at 0.85%.
When big ASX news breaks, our subscribers know first
Why did a rate hike fail to lift the Australian dollar?
Normally, a rate hike makes a currency more attractive because it raises the return on holding it. This one did the opposite.
The RBA lifted the cash rate by 25 basis points to 4.85%, its fifth hike of 2026. The vote was 6-3, however, and the Board removed its earlier explicit reference to raising rates further if necessary. Governor Michele Bullock chose her words carefully at the press conference:
Michele Bullock, RBA Governor “I’d not be interpreting this as saying we’re not going up. I wouldn’t be interpreting this saying we definitely are going up. We’re basically preserving our options.”
That is deliberate ambiguity, and markets read it as dovish. Forward guidance, meaning what a central bank signals about future moves, now leaned toward waiting. Reuters reported that the Australian dollar weakened after the hike because the split vote raised doubts about further increases.
Earlier in 2026 the same dynamic was visible, when Bullock’s forward guidance language was priced as capable of shifting terminal rate expectations by up to 25 basis points on the futures curve, moving the Australian dollar without any change in the cash rate itself.
The three dissenters, who preferred to hold, pointed to:
- An unemployment rate drifting higher
- The housing market’s sensitivity to rates
- The absence of accelerating wage growth
The RBA also flagged that AI-related data-centre investment was lifting demand and could raise the neutral rate, the level at which policy neither stimulates nor restrains the economy. The productivity payoff, it said, remains uncertain.
The decision was hawkish in level and relatively dovish in guidance. A currency responds to the expected next move, so a hike that hints at a possible peak can weaken the currency rather than strengthen it. Headline rates alone are a poor guide to direction.
The bullish case has not disappeared. A 4.85% cash rate still preserves Australia’s rate advantage, and Bullock left further hikes on the table.
How do rate expectations, risk sentiment and the dollar combine to move AUD/USD?
Look at Friday’s screen: the Australian dollar had a higher interest rate, yet it was among the weakest major currencies. That apparent contradiction makes sense once you see what a currency pair actually measures.
A currency pair is a relative price. AUD/USD tells you how many US dollars one Australian dollar buys, so its direction depends on both central banks’ expected paths and on global appetite for risk. Strength in one currency means little until you compare it with the other side.
Here is how the safe-haven transmission chain played out:
- AI-infrastructure shares fall sharply and investors cut exposure to high-beta, growth-sensitive assets.
- The AUD, a risk-sensitive currency because of Australia’s commodity and China exposure, comes under pressure.
- Leveraged carry and equity positions unwind, which can involve selling AUD.
- Funds move into US dollars and Treasuries, or repay dollar funding.
- The dollar’s rise pushes AUD/USD lower even with Australian rates above US policy rates.
Set the week’s forces side by side and the balance becomes clear.
| Force | Direction for AUD/USD | Evidence this week | Likely durability |
|---|---|---|---|
| Risk sentiment | Lower | AI selloff, safe-haven demand for dollars | Can reverse quickly if equities stabilise |
| Fed expectations | Lower | Payrolls +165,000 vs +65,000; higher December hike odds | Depends on revisions and further data |
| RBA guidance | Lower in the near term | 6-3 vote; tightening language removed | Open, as Bullock kept hikes on the table |
| Rate level and medium-term view | Higher | 4.85% cash rate; MUFG expects dollar weakness | Slower-moving, longer horizon |
The sources disagree on one point. MUFG argues that tighter financial conditions could make a December Fed hike less likely, while Reuters and the payrolls data point to higher odds in the short term. Both can hold true on different timeframes.
A Fed rate decision matters most through its forward roadmap, because markets pricing rates near 4.25% by mid-2027 sit well above the Fed’s own neutral estimate, which makes disappointment on guidance a risk for the dollar and for gold.
Two general patterns help here, although no earlier episode matching these exact levels was found. Risk-off periods tend to hurt AUD even when Australian rates are higher. Hikes also carry different weight at different stages of a cycle: early on they widen the rate gap, and near a perceived peak they can read as the last move.
You can use this three-force checklist on any currency pair. Ask which central bank’s path is moving, whether risk appetite is rising or falling, and which force is dominant this week.
What do the chart levels say, and what would change the AUD/USD forecast?
The macro forces explain why the pair fell. The chart shows where its next decisions sit.
Reading the levels
FXStreet’s AI-assisted technical analysis placed the pair at 0.6874 on the daily chart, with a bearish short-term bias.
| Level | Type | What it means |
|---|---|---|
| 0.6828 | Support | A decisive break would open the way to further losses |
| 0.6913 | Resistance (former trend line) | Old support now acting as a ceiling |
| 0.6989 | Resistance (20-day EMA) | A higher barrier that caps any rebound |
| 34 | RSI (14) | Weak momentum, but not capitulation |
The EMA, or exponential moving average, is an average price that gives more weight to recent sessions. The RSI, or relative strength index, measures momentum on a scale of 0 to 100. Earlier in the week, RSI readings were about 42 and 46, with support near 0.6833-0.6834, so momentum deteriorated as the days passed.
These levels are conditional, not predictions. Holding above 0.6828 would point to consolidation rather than a confirmed reversal. An RSI near 34 is not low enough to rule out further losses. Treat 0.6828 and 0.6913 as decision lines that tell you which scenario is playing out, not as price targets.
What could change the picture
MUFG’s longer-term view sits against this bearish chart. The bank forecasts the DXY at 101.98 in Q4 2026, 100.14 in Q1 2027 and toward 97 by Q3 2027. On its numbers, AUD/USD reaches 0.7000 in Q4 2026, then 0.7100, 0.7200 and 0.7300 over the following three quarters. Past performance does not guarantee future results, and financial projections are subject to market conditions and various risk factors.
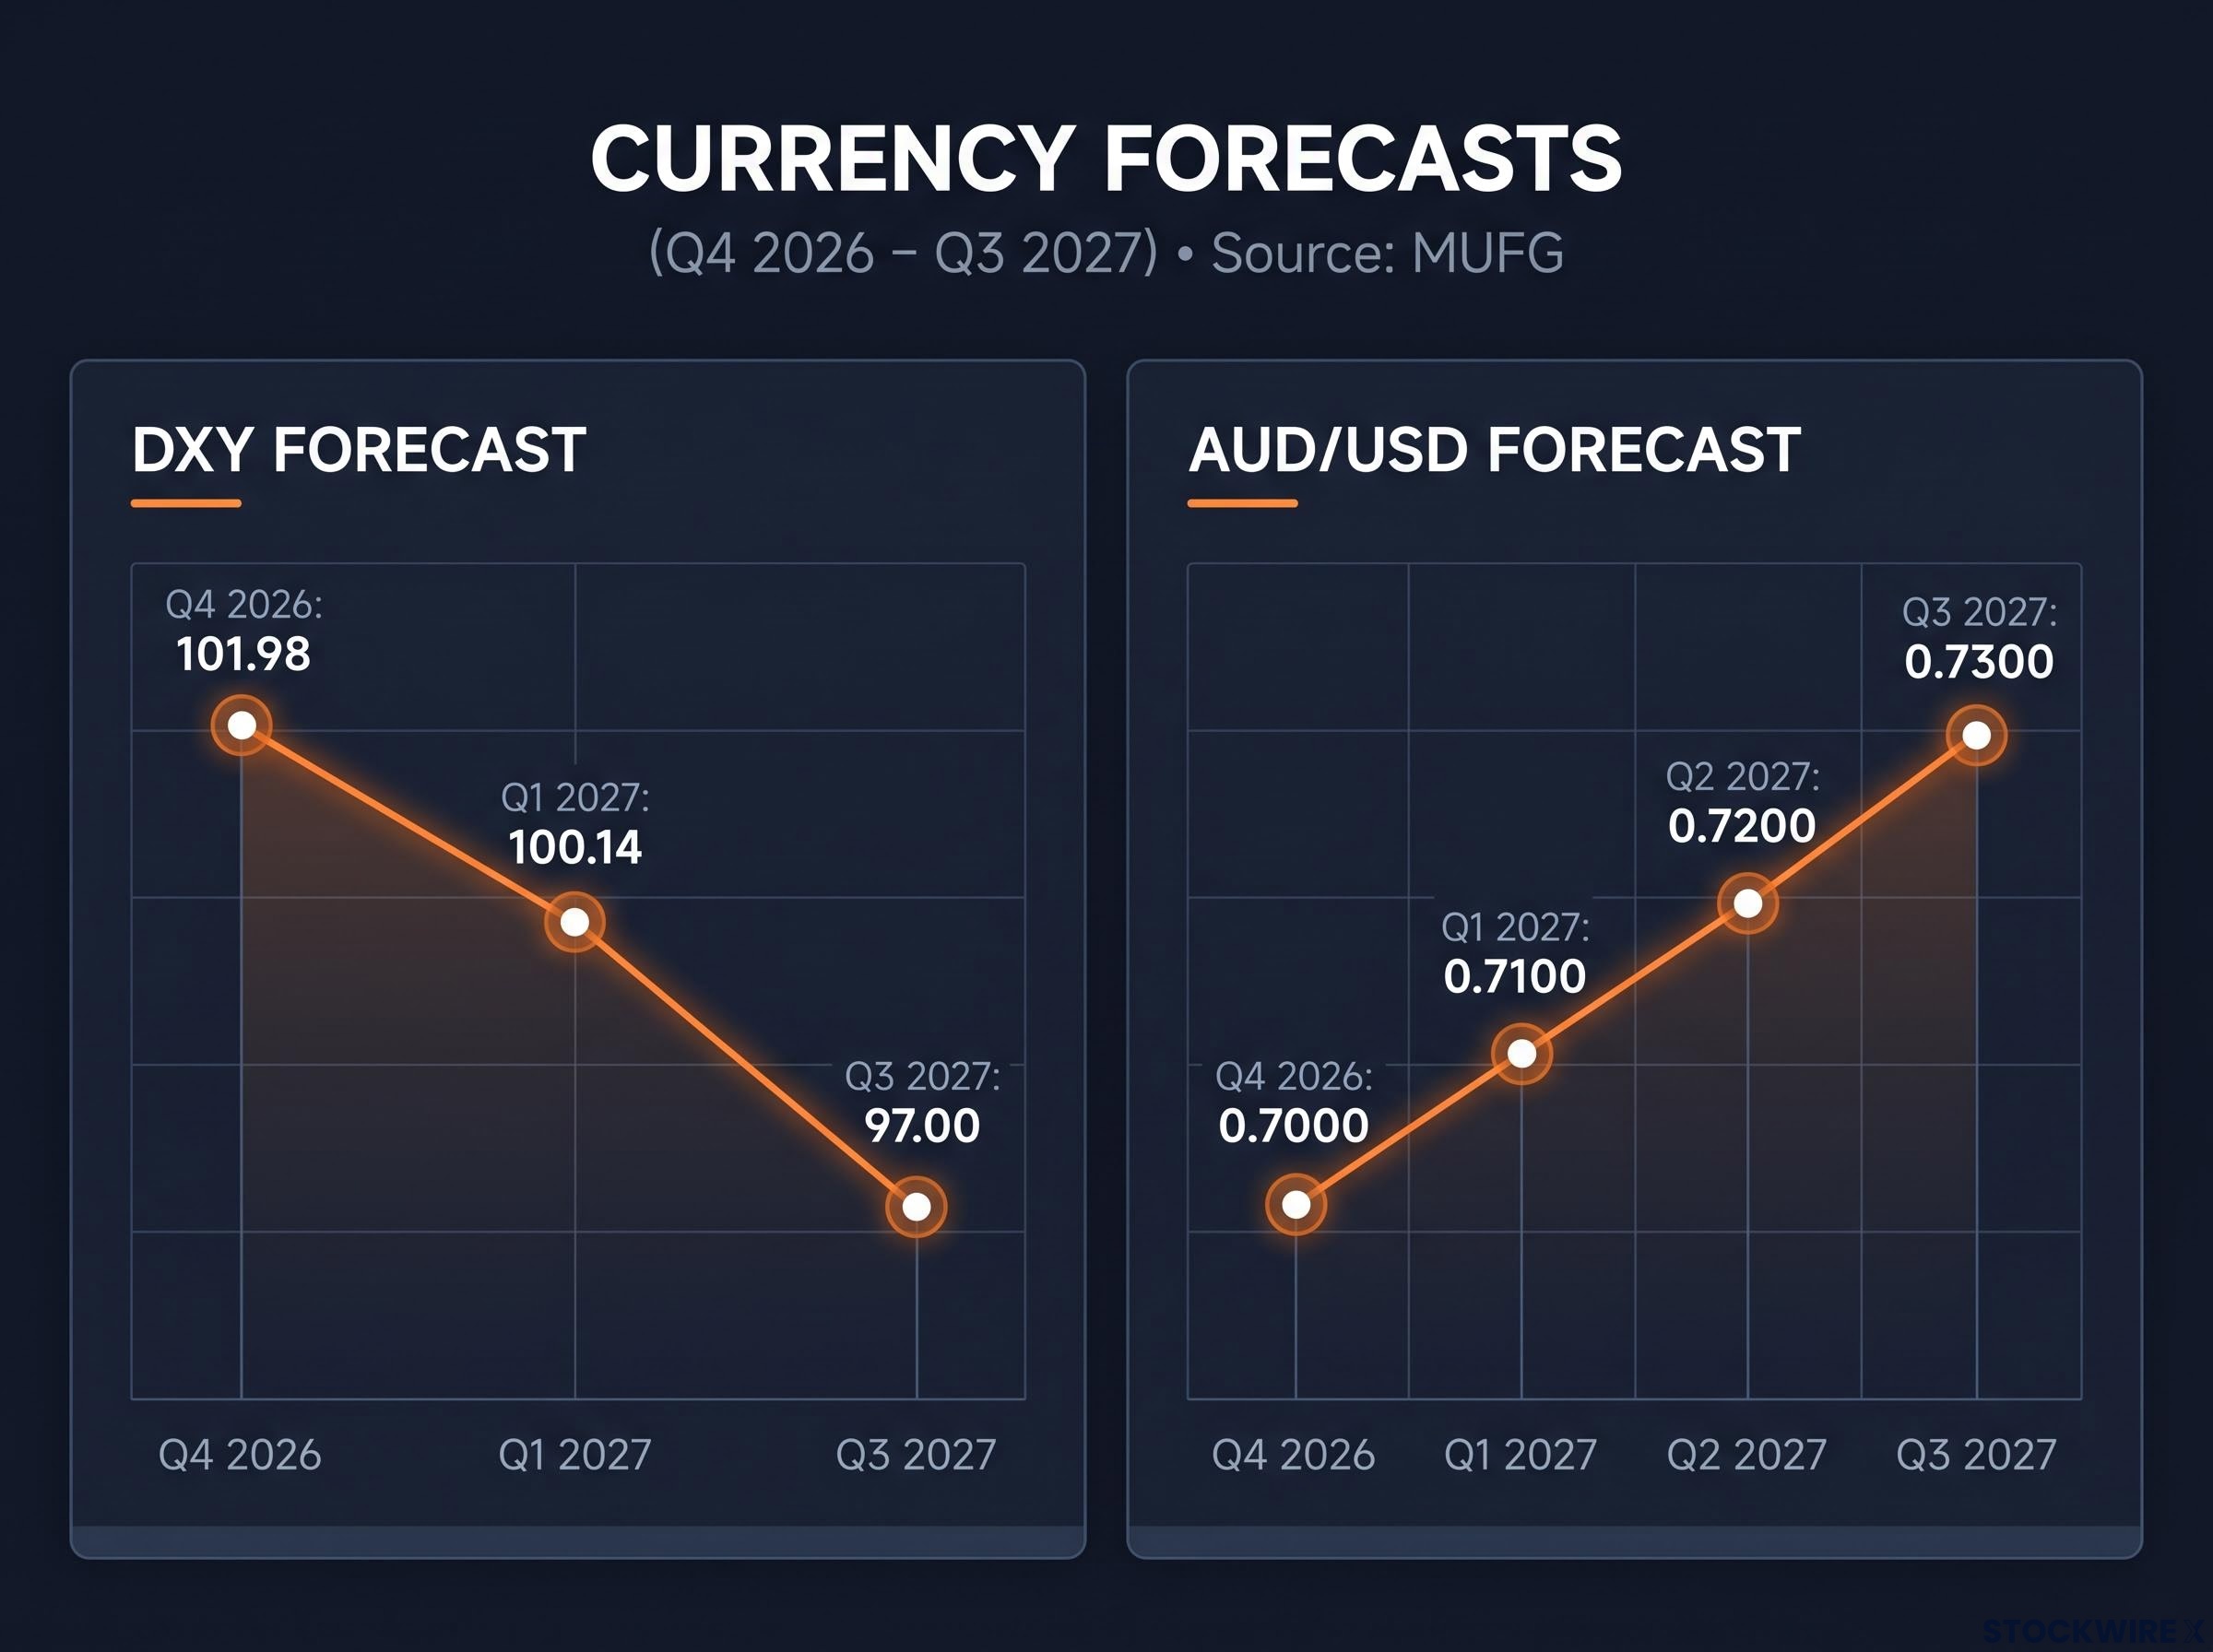
MUFG forecasts the DXY to decline to 97 by Q3 2027, while the AUD USD pair is projected to rise steadily to 0.7300.
Several developments could turn the short-term picture:
- Safe-haven flows can reverse quickly if the AI selloff stabilises.
- The RBA may still hike, given Bullock’s focus on upside inflation risks.
- October payrolls could be revised, as September was.
- The AI shock could become dollar-negative if it weakens US investment or growth.
Holding a short-term technical view alongside a longer-term macro one is not a contradiction. The chart tells you about the coming weeks, while MUFG’s path describes the coming quarters.
Three signals that will decide whether the slide continues
The fall to 0.6862 came from risk flows and Fed repricing outweighing an RBA that was higher at 4.85% but hesitant about what comes next. Three signals will tell you whether that balance holds.
- The AI-equity selloff. If it stabilises, the safe-haven bid could unwind and a move back above 0.6913 would confirm it.
- December Fed hike odds. Rising odds favour the dollar, and a break below 0.6828 would show it.
- The RBA’s next communication. A firmer tightening signal would support the case toward MUFG’s 0.7000 for Q4 2026.
Any AUD/USD forecast is a conditional judgment on these three signals, not a fixed number.
This article is for informational purposes only and should not be considered financial advice. Investors should conduct their own research and consult with financial professionals before making investment decisions.