
Why Imugene’s Fast Track Win in Marginal Zone Lymphoma Matters
44 mins ago

The S&P/ASX 200 Information Technology Index fell 48% between 29 August 2025 and 30 March 2026, one of the sharpest sector drawdowns on the Australian sharemarket in recent memory. Yet during that same window, one stock rose 242%.
Recovery from the trough has been equally fractured. Megaport surged 79% while WiseTech Global posted zero. The sector index rebounded 12%; the broader ASX 200 managed just 2.1%. These numbers tell very different stories depending on which ASX tech stock an investor held.
What follows maps where each of the ten largest ASX tech companies sat in both the rout and the rebound, explains why the divergence was so extreme, and draws out what the split recovery signals for investors thinking about how to hold tech exposure going forward.
The XIJ’s 48% decline from 29 August 2025 to 30 March 2026 is the structural frame. It was severe by any measure, and it set the terms for everything that followed.
The BetaShares Australian Technology ETF (ATEC) fell 42% over the same period, a six-percentage-point gap that offers the first clue: composition and diversification affected outcomes from the very start.
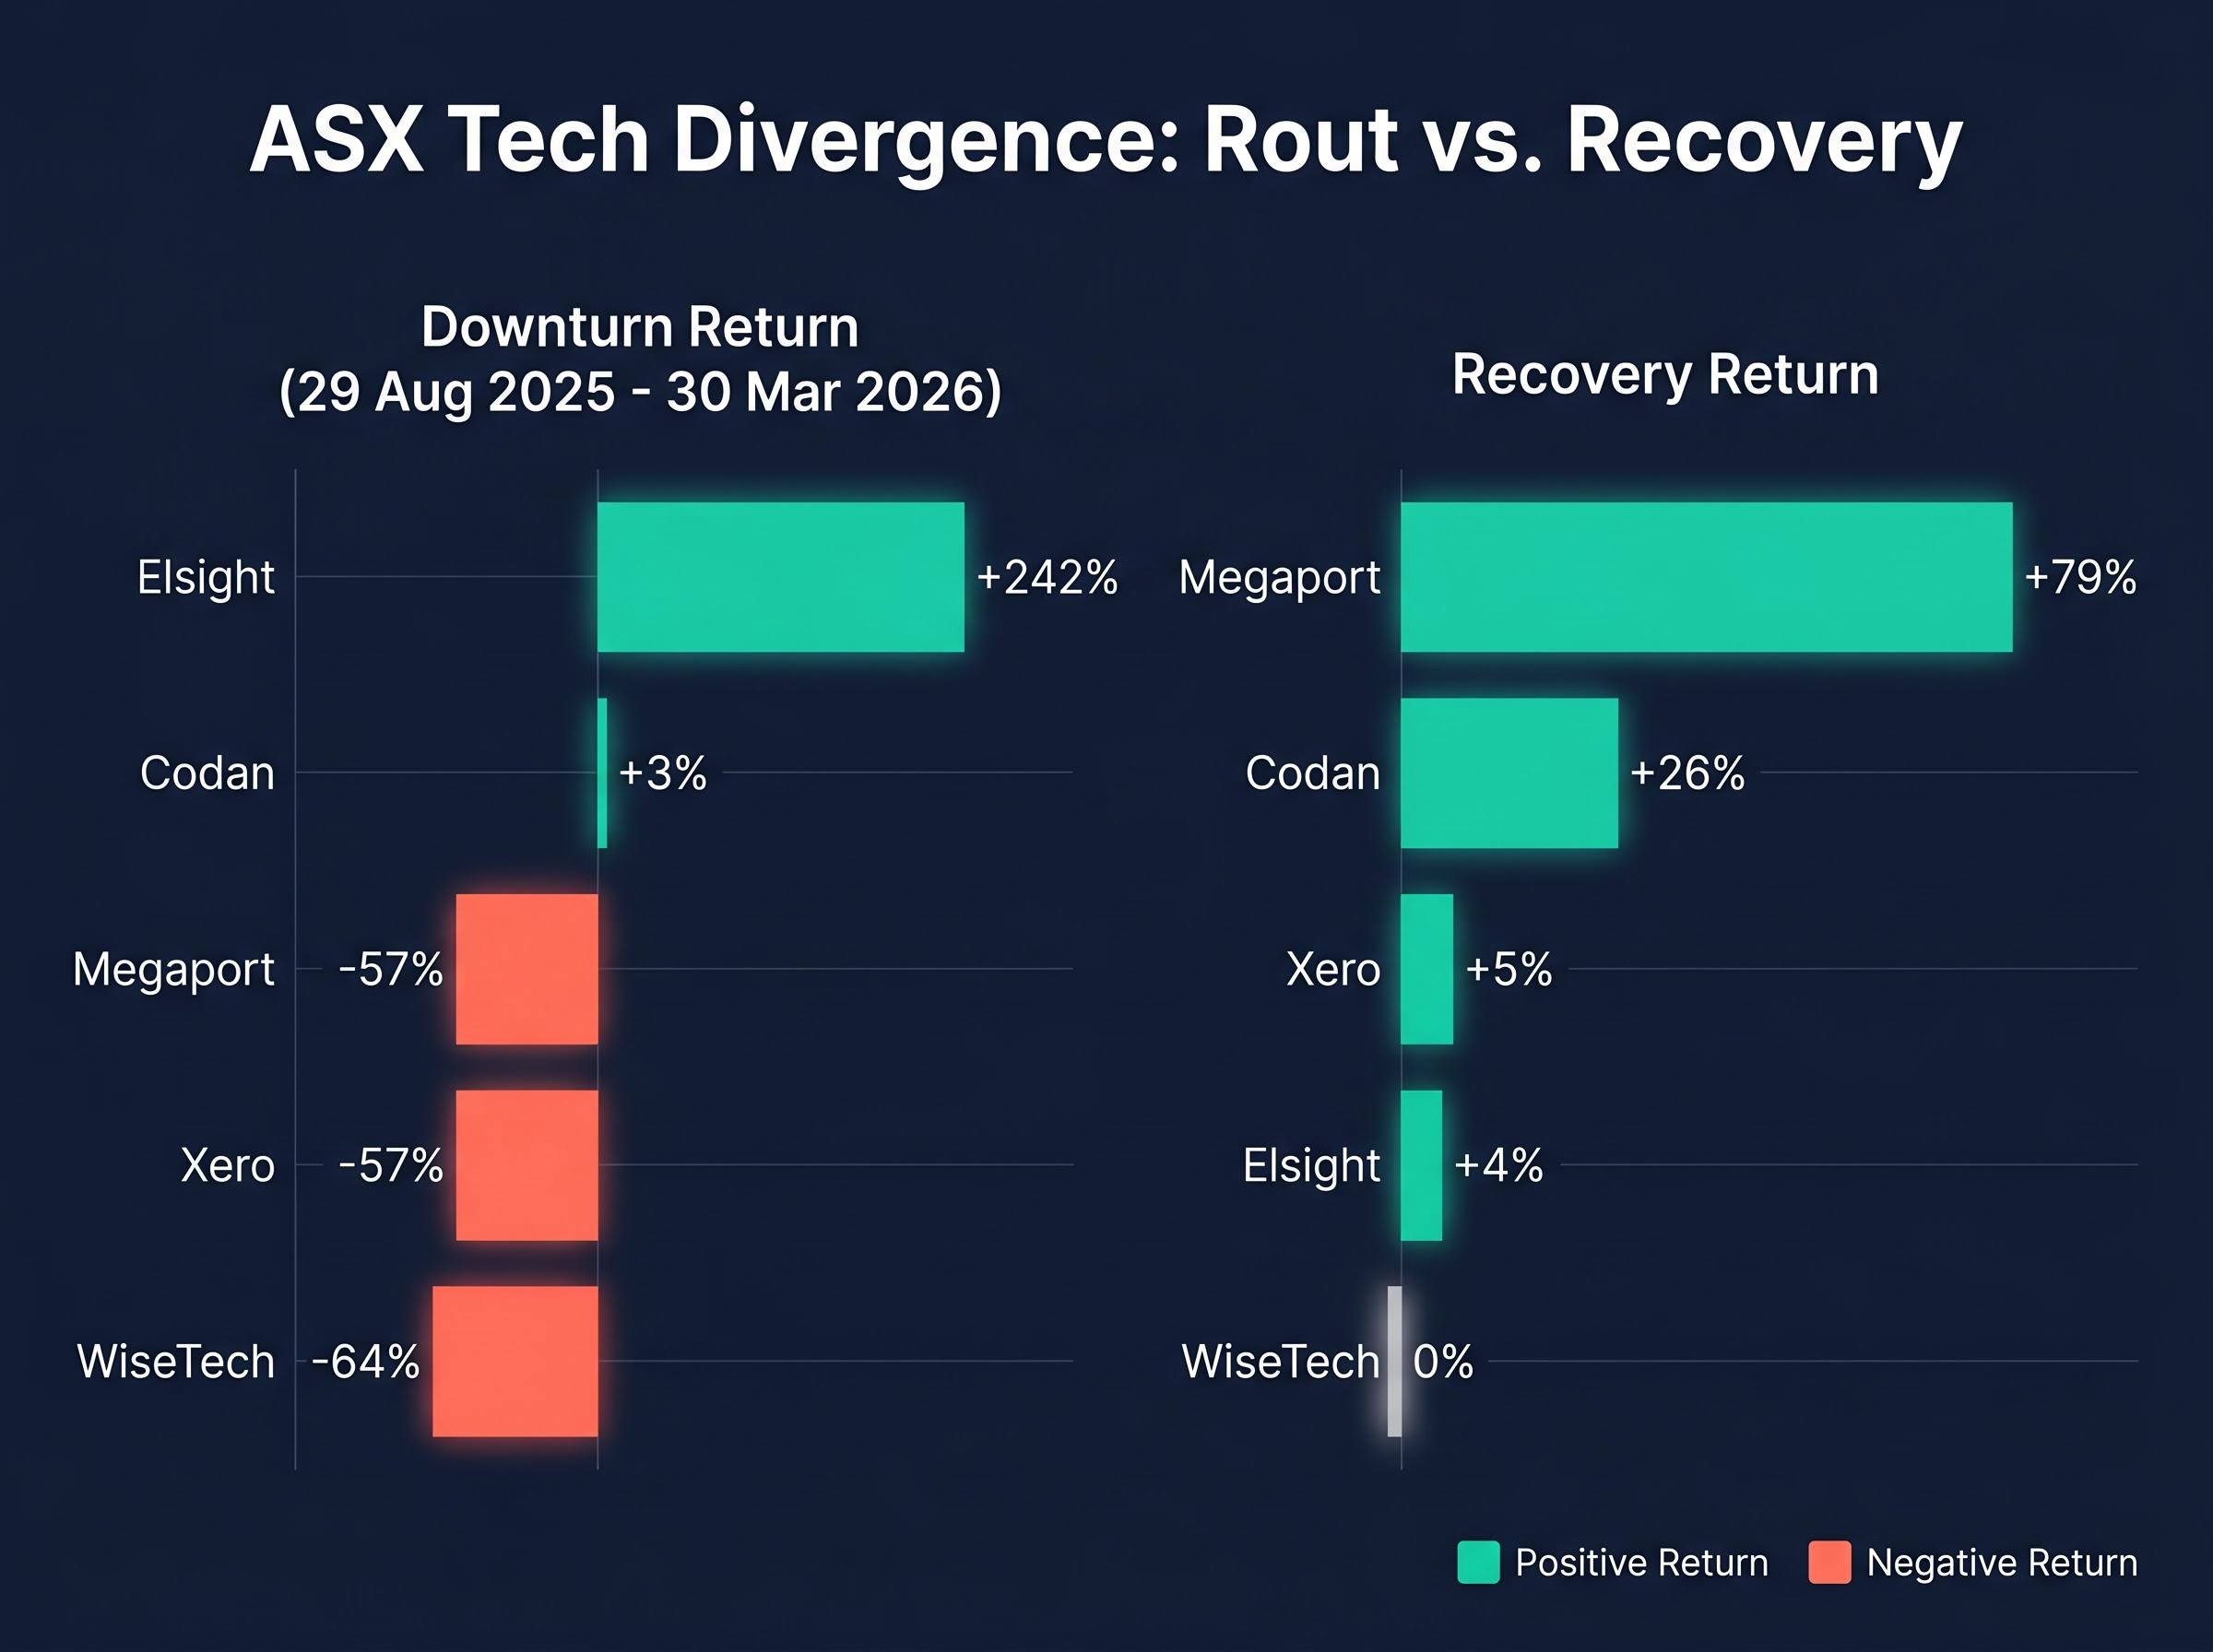
At the individual stock level, the 48% headline dissolves. Most of the top ten holdings fell materially, but the range ran from a 3% gain (Codan) to a 64% loss (WiseTech Global). For investors who used the index as a mental benchmark for their portfolio losses, the actual drawdown may have been sharply different depending on which names they owned.
Elsight (ELS) rose 242% during the same period the sector index fell 48%, a counter-trend move driven by contract-specific catalysts entirely disconnected from the macro forces dragging the sector lower.
That single data point signals the core problem with sector-level thinking: the same index contained both a 64% loser and a 242% winner.
The selloff was not random. Three macro forces drove the initial compression, and they hit different companies with different severity depending on each business’s revenue model, earnings visibility, and valuation starting point.
The high-duration, high-multiple names absorbed the worst of it. Xero fell 57%, Life360 dropped 61%, and WiseTech lost 64%. Each carried stretched valuations into a rising-rate environment, and each faced company-specific amplifiers: WiseTech’s governance concerns and emerging AI disruption risk compounded the macro pressure.
At the other end, Codan gained 3%, Dicker Data fell just 8%, and Macquarie Technology lost only 2%. These businesses carried lower valuation multiples and more defensive revenue profiles, insulating them from the rate-driven de-rating that defined the selloff for their peers.
The distinction matters for what came next. Macro-driven compression is, in principle, recoverable as rates normalise. Structural re-rating, where the market has genuinely reassessed a company’s earnings power or risk profile, requires earnings evidence to reverse. These are very different investment situations.
The recovery data makes the divergence visible at a glance.
| Company (ASX Code) | Downturn Return | Recovery Return | Key Driver | Broker Consensus |
|---|---|---|---|---|
| Xero (XRO) | -57% | +5% | Quality compounder; margin focus | Buy, ~$135.97 target |
| WiseTech (WTC) | -64% | 0% | AI restructuring; 2,000 job cuts | Strong Buy |
| NextDC (NXT) | -32% | +33% | AI infrastructure demand; $2.2B raise | ~$19.76 target |
| TechnologyOne (TNE) | -34% | +4% | Defensive SaaS; public sector stickiness | Outperform, ~$30.97 target |
| Codan (CDA) | +3% | +26% | Lower multiple; defensive revenue | Positive |
| Life360 (360) | -61% | +1% | High-multiple compression | Mixed |
| Macquarie Technology (MAQ) | -2% | +29% | Data centre demand; stable earnings | Positive |
| Megaport (MP1) | -57% | +79% | Improving unit economics; profitability path | Positive |
| Dicker Data (DDR) | -8% | +7% | Defensive distributor model | Neutral |
| Elsight (ELS) | +242% | +4% | Contract-driven; defence/UAV pipeline | Speculative |
Megaport’s 79% post-trough surge stands as the strongest recovery among the group. The stock, trading at approximately $9.98 as of mid-May 2026 (up over 90% from January lows), has been re-rated on improving unit economics and a clearer path to profitability, with FY26 annual recurring revenue guidance of approximately $243.8 million.
NextDC’s 33% rebound ties directly to the AI infrastructure thematic. The company’s $2.2 billion capital raise and a 60% increase in contracted utilisation to 667MW since December 2025 provided the specific catalysts.
WiseTech posted a 0% recovery despite a broker Strong Buy consensus. The stock sits down approximately 40% over the past year, weighed by the announcement of 2,000 job cuts as part of an AI-driven restructuring programme. Broker conviction and market pricing are telling different stories.
Reuters reporting on WiseTech’s restructuring confirmed the two-year programme involves approximately 2,000 job cuts tied directly to AI-driven process changes, with governance concerns surrounding the company’s founder providing a secondary overhang that compounded the macro-driven de-rating already weighing on the stock.
Within the same index, recovery ranged from zero to nearly 80%. Post-trough outcomes depended almost entirely on which specific stocks an investor held, not on “being in tech.”
Elsight’s 242% counter-trend rally during a 48% sector drawdown belongs to a different category of return entirely. The move was not a function of macro conditions, rate expectations, or sector sentiment. It was driven by contract-specific catalysts in the defence and unmanned aerial vehicle (UAV) communications space, where a single customer win or pipeline development can move a small-cap share price by multiples that have nothing to do with interest rates.
The specific catalyst behind Elsight’s counter-trend surge was the Halo platform’s Blue List approval from the US Defense Contract Management Agency, which opened direct procurement access to a US$75 billion military drone cycle and eliminated the multi-year acquisition delays that typically separate a defence technology win from recognisable revenue.
Codan’s marginal 3% gain during the rout reflected a different kind of insulation. Its lower valuation multiple and more defensive revenue profile meant the rate-driven de-rating that punished high-multiple software names largely passed it by. In the recovery, Codan then gained 26%, suggesting the market was re-weighting toward businesses with earnings visibility.
The general principle these two cases illustrate: within any sector selloff, event-driven and value-oriented names can post entirely different return profiles from the sector average. Sector-level beta is an incomplete guide to portfolio risk when individual holdings operate on fundamentally different return logic.
The instinctive case for holding the BetaShares Australian Technology ETF (ATEC) during a tech drawdown is straightforward: spread the risk, soften the blow. The data partially supports this, but with a symmetrical trade-off that investors should weigh honestly.
ATEC fell 42% during the rout versus the XIJ’s 48%. In the recovery, ATEC gained 8% versus the XIJ’s 12%. Less down, but also less up. The current price sits at approximately $21.78.
| Vehicle | Rout Return | Recovery Return |
|---|---|---|
| XIJ (S&P/ASX 200 IT Index) | -48% | +12% |
| ATEC (BetaShares Tech ETF) | -42% | +8% |
The gap comes down to composition. ATEC tracks the S&P/ASX All Technology Index, which holds approximately 45 companies, only 56% of which are classified as technology. Significant weight sits in industrials (Computershare at 10.7%), communications (CAR Group at 8.36%), and healthcare (Pro Medicus at approximately 6%). Xero holds 10.14% and TechnologyOne 7.92%.
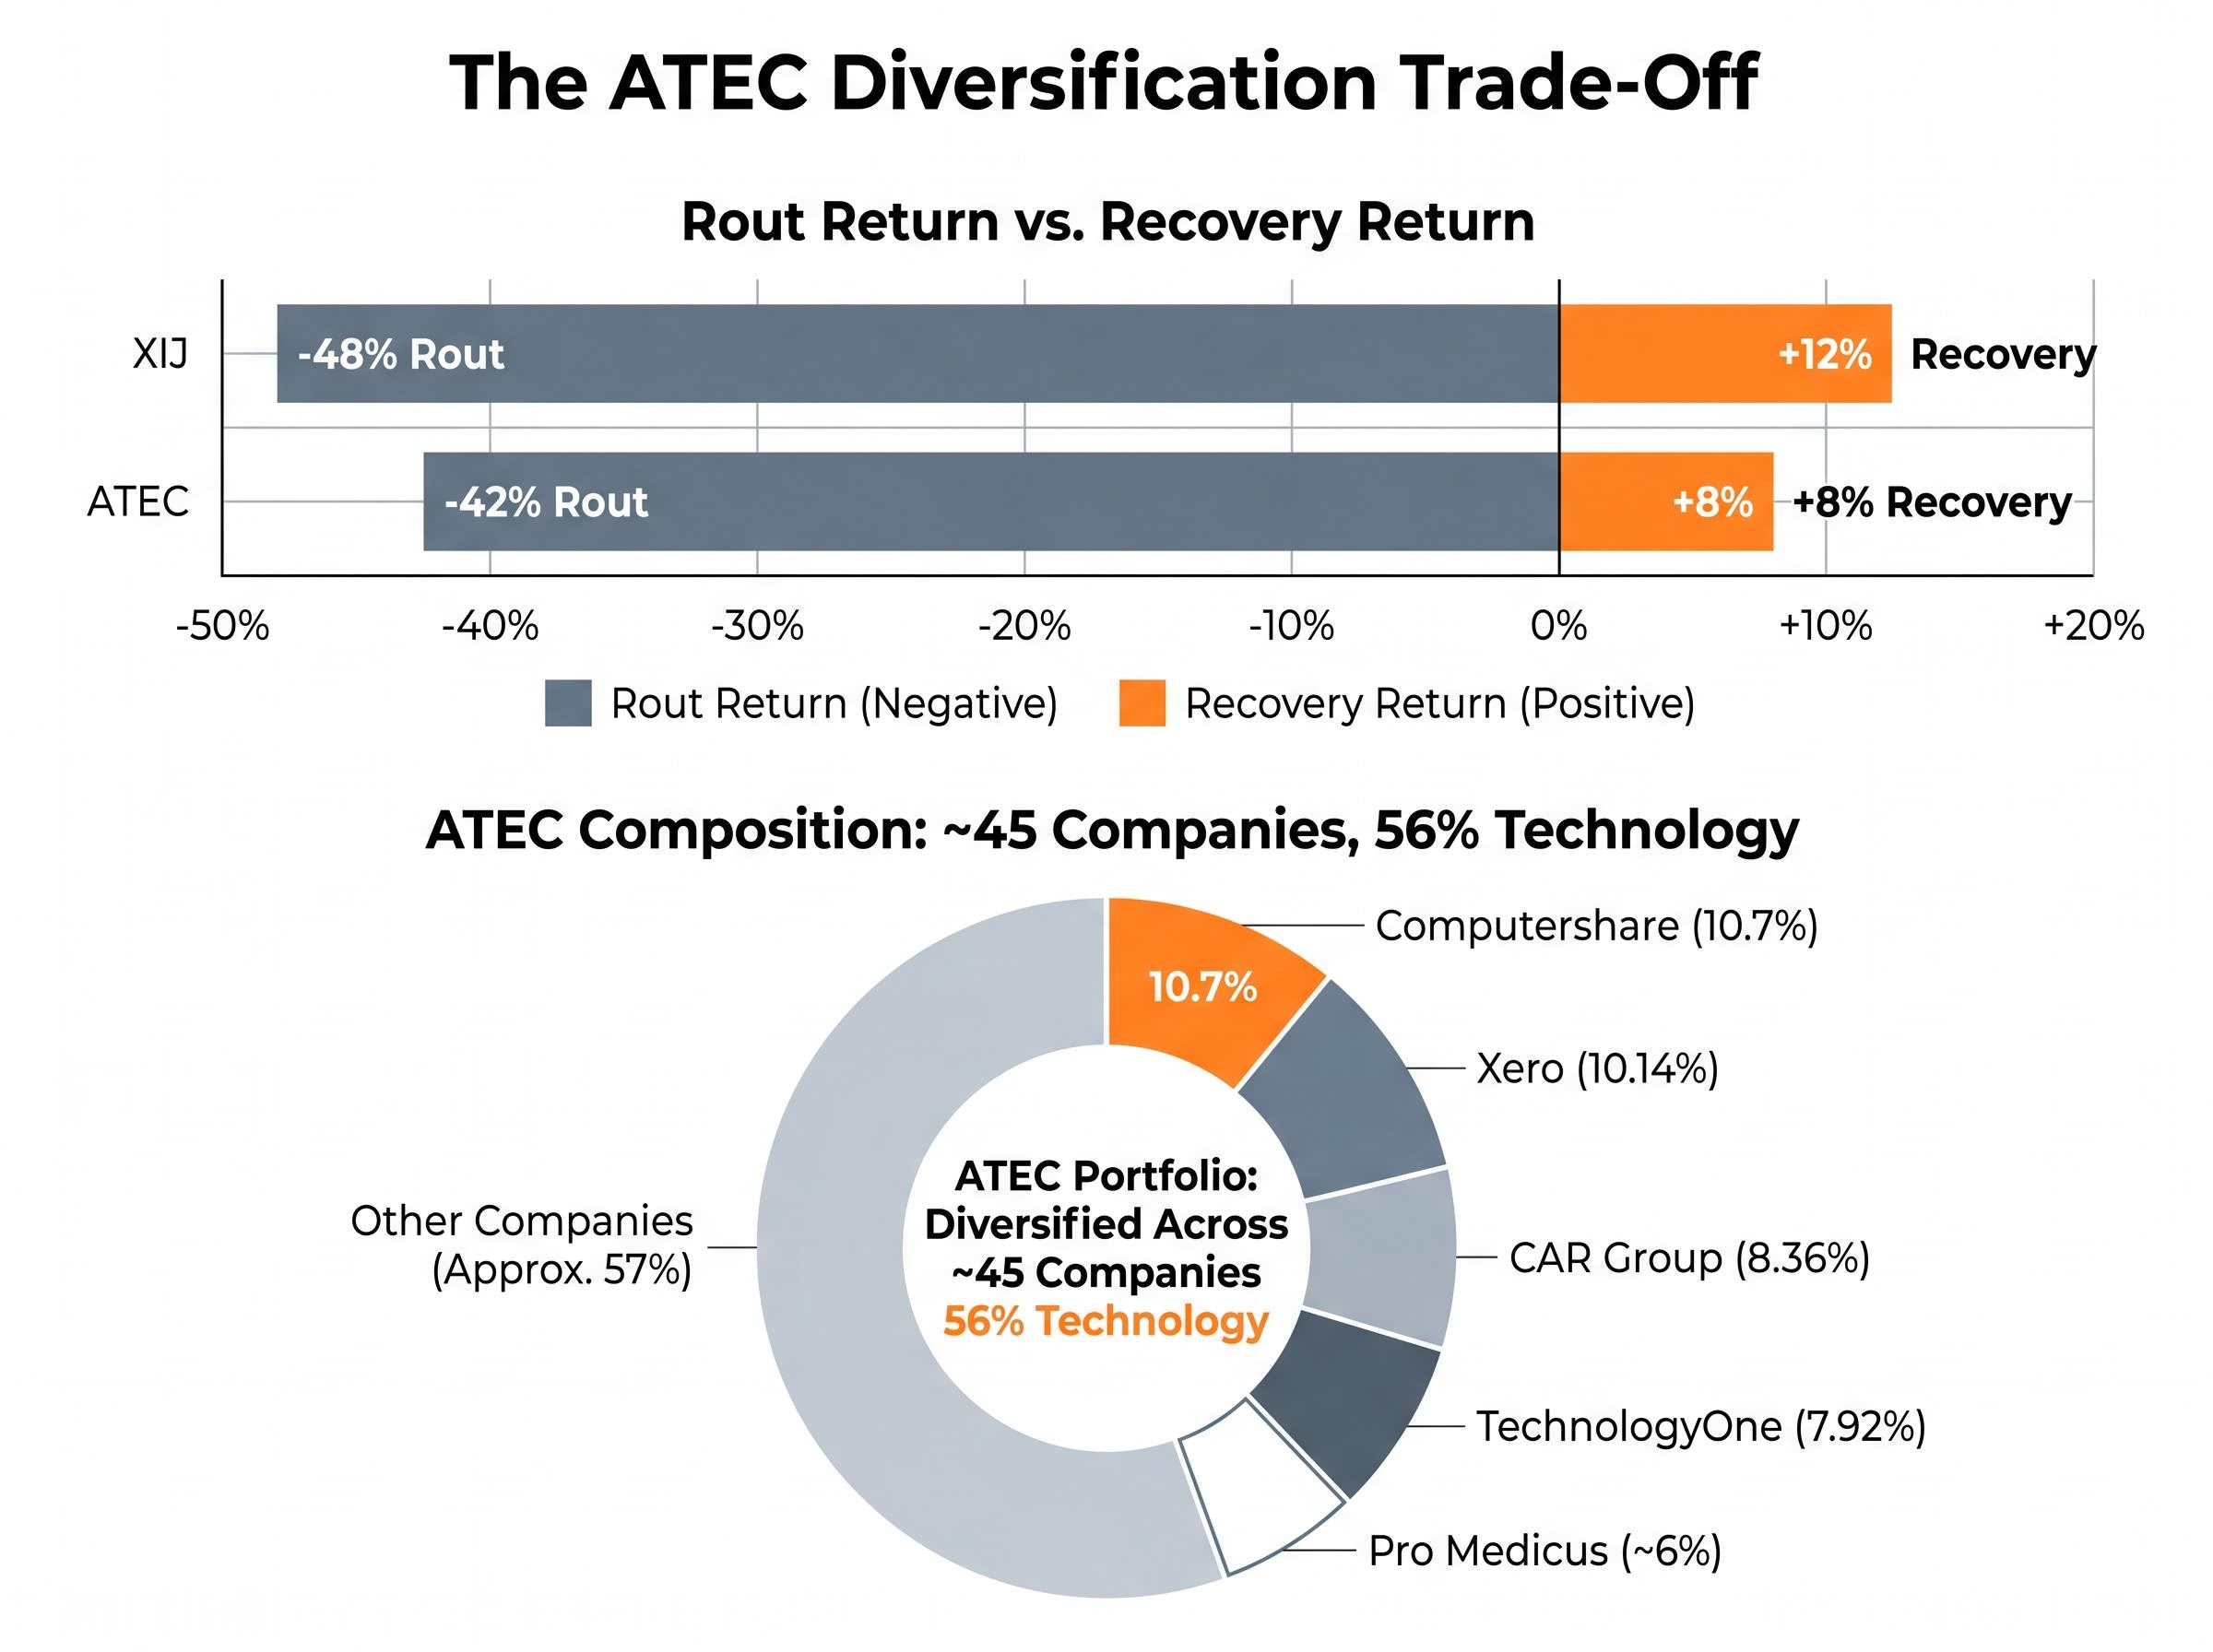
That broader composition muted the downside but also diluted the recovery. An investor who was “right on the sector” but “wrong on the stock” (the WiseTech scenario, down 40% over the past year while the sector rebounded) would have been materially better served by ATEC exposure. The ETF vs single-stock choice is a risk-profile question: which error does the investor most want to protect against? The concentrated upside miss, or the idiosyncratic blow-up?
The ETF vs single-stock choice ultimately comes down to which type of error an investor most wants to protect against: the concentrated blow-up risk of owning a name like WiseTech through a 64% drawdown, or the diversification drag that caps recovery at 8% when the sector rebounds 12%.
The uneven recovery follows a legible pattern rather than random distribution. Companies with clear profitability paths and improving unit economics recovered strongly: Megaport (+79%), NextDC (+33%), Macquarie Technology (+29%). Those carrying execution uncertainty or structural re-rating questions recovered weakly or not at all: WiseTech (0%), Life360 (+1%), Xero (+5%).
Morgan Stanley cut ASX tech price targets by approximately 20% on AI disruption risk, reflecting an institutional view that the sector faces a category of structural challenge the market is only beginning to price.
The legacy software repricing underway in 2026 is not limited to ASX-listed names; a $2 trillion wealth destruction event in US software markets driven by AI displacement of per-user licensing models represents the structural backdrop against which WiseTech’s AI-driven restructuring and the Morgan Stanley price target cuts must be read.
The RBA’s ongoing tightening to 4.35% (its third consecutive hike as of May 2026) means any further recovery in high-multiple names must be earnings-driven. Rate-cut expectations that might have lifted valuations broadly remain absent from the near-term policy outlook. The investors most exposed to further downside are those holding names where the bull case still depends on rate relief that is not arriving soon.
This article is for informational purposes only and should not be considered financial advice. Investors should conduct their own research and consult with financial professionals before making investment decisions. Past performance does not guarantee future results, and financial projections are subject to market conditions and various risk factors.
The rout and its uneven recovery revealed three distinct investor experiences hiding inside the same sector index:
“Being in tech” is not a thesis. The recovery data confirms that sector membership alone explained almost nothing about individual returns during this period. Megaport returned 79% from the trough. WiseTech returned zero. Elsight gained 242% while the index fell.
Before the next drawdown, the practical question for any investor holding ASX tech exposure is whether they can articulate what kind of position they own: rate-sensitive, earnings-driven, or event-dependent. That classification determines how to respond when prices fall, whether the right move is to hold, add, or exit. ATEC remains the alternative for those who cannot or do not want to make that call on individual names.
The 2022-2024 ASX market cycle offers a direct precedent for what is playing out now: Information Technology surged 52% and Financials 34% in the recovery year, while the names that led the drawdown were not always the same names that led the rebound, a pattern that mirrors the fractured recovery visible across the top ten ASX tech stocks today.
The S&P/ASX 200 Information Technology Index, ticker XIJ, tracks the performance of the largest technology-classified companies listed on the ASX. It fell 48% between August 2025 and March 2026, though individual stock returns within the index ranged from a 64% loss to a 242% gain over the same period.
Recovery was driven by the clarity of each company's earnings outlook. Stocks like Megaport (up 79%) and NextDC (up 33%) had visible profitability paths or contracted AI infrastructure demand, while WiseTech (0% recovery) and Life360 (up 1%) still faced execution uncertainty or structural re-rating questions that the market had not resolved.
ATEC fell 42% during the rout compared to the XIJ's 48% decline, and recovered 8% versus the index's 12% rebound. The ETF's broader composition, which includes industrials, communications, and healthcare alongside pure tech names, muted both the downside and the recovery relative to concentrated single-stock positions.
Elsight's counter-trend gain was driven by a contract-specific catalyst: the Halo platform received Blue List approval from the US Defense Contract Management Agency, opening direct procurement access to a US$75 billion military drone cycle. This event had no connection to the macro forces, such as rising rates and multiple compression, that drove the broader sector lower.
Higher interest rates increase the discount rate applied to future earnings, which compresses the present value of long-duration growth stocks most severely. When the RBA raised the cash rate to 4.35% across consecutive hikes, high-multiple names like Xero, Life360, and WiseTech absorbed the steepest share price declines because their valuations depended heavily on distant future earnings.