
The S&P/ASX 200 Real Estate index has shed roughly 12% in six weeks, dragging the sector to its weakest point since January 2024. In the week to 11 September 2026, six Australian property trusts hit new 52-week lows, and not a single one made a new high. That is not a chart glitch. It is an instrument reading, and it demands an explanation.
The RBA historical capital market yield data provides the long-run series showing where the 10-year Commonwealth government bond yield sat in May 2011, giving quantitative weight to the claim that current yields represent a 15-year high for the sector to absorb.
The catalyst sits in the bond market. Australia’s 10-year Commonwealth government bond yield broke to around 5.36-5.40% in early September, the highest level since May 2011, according to Bloomberg. After a period of relief through the middle of the year, yields have snapped back with force.
This is not a broad risk-off move sweeping every corner of the market. It is a mechanism operating specifically, and acutely, on one asset class. What follows is a lens for reading the sector: why REITs are wired to respond this way, which names carry the most exposure, and where the professional debate actually splits.
Twelve percent in six weeks: how bad is the REIT selloff?
Start at the index level. The S&P/ASX 200 Real Estate index has fallen roughly 12% over six weeks, undoing the relief rally that built between mid-May and early August and pushing the sector below its March low. Its lowest level since January 2024 is where things now stand.
Then look at where the pain concentrated. In the week ending 11 September 2026, Real Estate was the only sector on the ASX 200 recording new 52-week lows with zero new highs. Six names hit fresh floors while the rest of the market held firm or climbed.
| Sector | New 52-week highs | New 52-week lows |
|---|---|---|
| Real Estate | 0 | 6 |
| Materials | 4 | 2 |
| Health Care | 2 | 0 |
| Energy | 2 | 0 |
| Consumer Discretionary | 0 | 3 |
| Telecommunications | 0 | 3 |
| Financials | 0 | 2 |
That concentration is the tell. When one sector clusters its worst prints while Materials, Health Care and Energy make new highs, you are not looking at a market-wide correction. You are looking at a targeted repricing of a single asset class.
The individual names put a face on the number:
- Arena REIT (ARF): closed at $2.21, down 6.0% for the week and 45.6% over twelve months
- Charter Hall (CHC): closed at $18.12, down 4.6% for the week and 22.1% over twelve months
- GPT Group (GPT): closed at $4.39, down 4.8% for the week and 19.5% over twelve months
- BWP Trust (BWP): closed at $3.54, down 3.8% for the week and 4.3% over twelve months
The spread across those names is worth holding onto. A 45% annual drop for Arena sits alongside a 4% slide for BWP, which tells you the sector label is doing less work than it appears. Something specific is separating the winners from the wreckage, and it starts with how these businesses are built.
When big ASX news breaks, our subscribers know first
Why rising bond yields hit REITs harder than almost anything else
To understand why a bond-yield move lands so hard here, you have to see two forces at work, not one. They arrive in sequence, and they compound.
The borrowing cost channel
The first force is the debt itself. REITs are among the most heavily leveraged businesses on the market, and that leverage is a feature of the model, not an accident. They borrow to acquire property, then pass rental income through to unitholders.
When base rates rise, that borrowing gets more expensive across the whole debt portfolio. A bank can widen the gap between what it charges borrowers and what it pays depositors to protect its margin. A REIT has no such lever. Higher rates flow straight into finance costs and compress net income with nothing to offset them.
The Reserve Bank cash rate sitting at roughly 4.10-4.35% keeps that pressure live across every trust in the sector.
The RBA tightening cycle that delivered three consecutive 25-basis-point hikes from January 2026 is the proximate driver of the borrowing cost pressure now embedded in every REIT’s finance line, and the board’s preserved optionality on a fourth hike means that channel is not yet closed.
The valuation discount channel
The second force stacks on top of the first. Property is valued by discounting future rental income back to a present-day figure, and the rate used to do that discounting, the capitalisation rate, moves with long-term bond yields.
When yields rise, cap rates rise with them. A higher discount rate shrinks the present value of those future rents, which erodes net tangible assets (NTA), the per-unit value of the underlying property book. That is a valuation hit landing directly on top of the income hit.
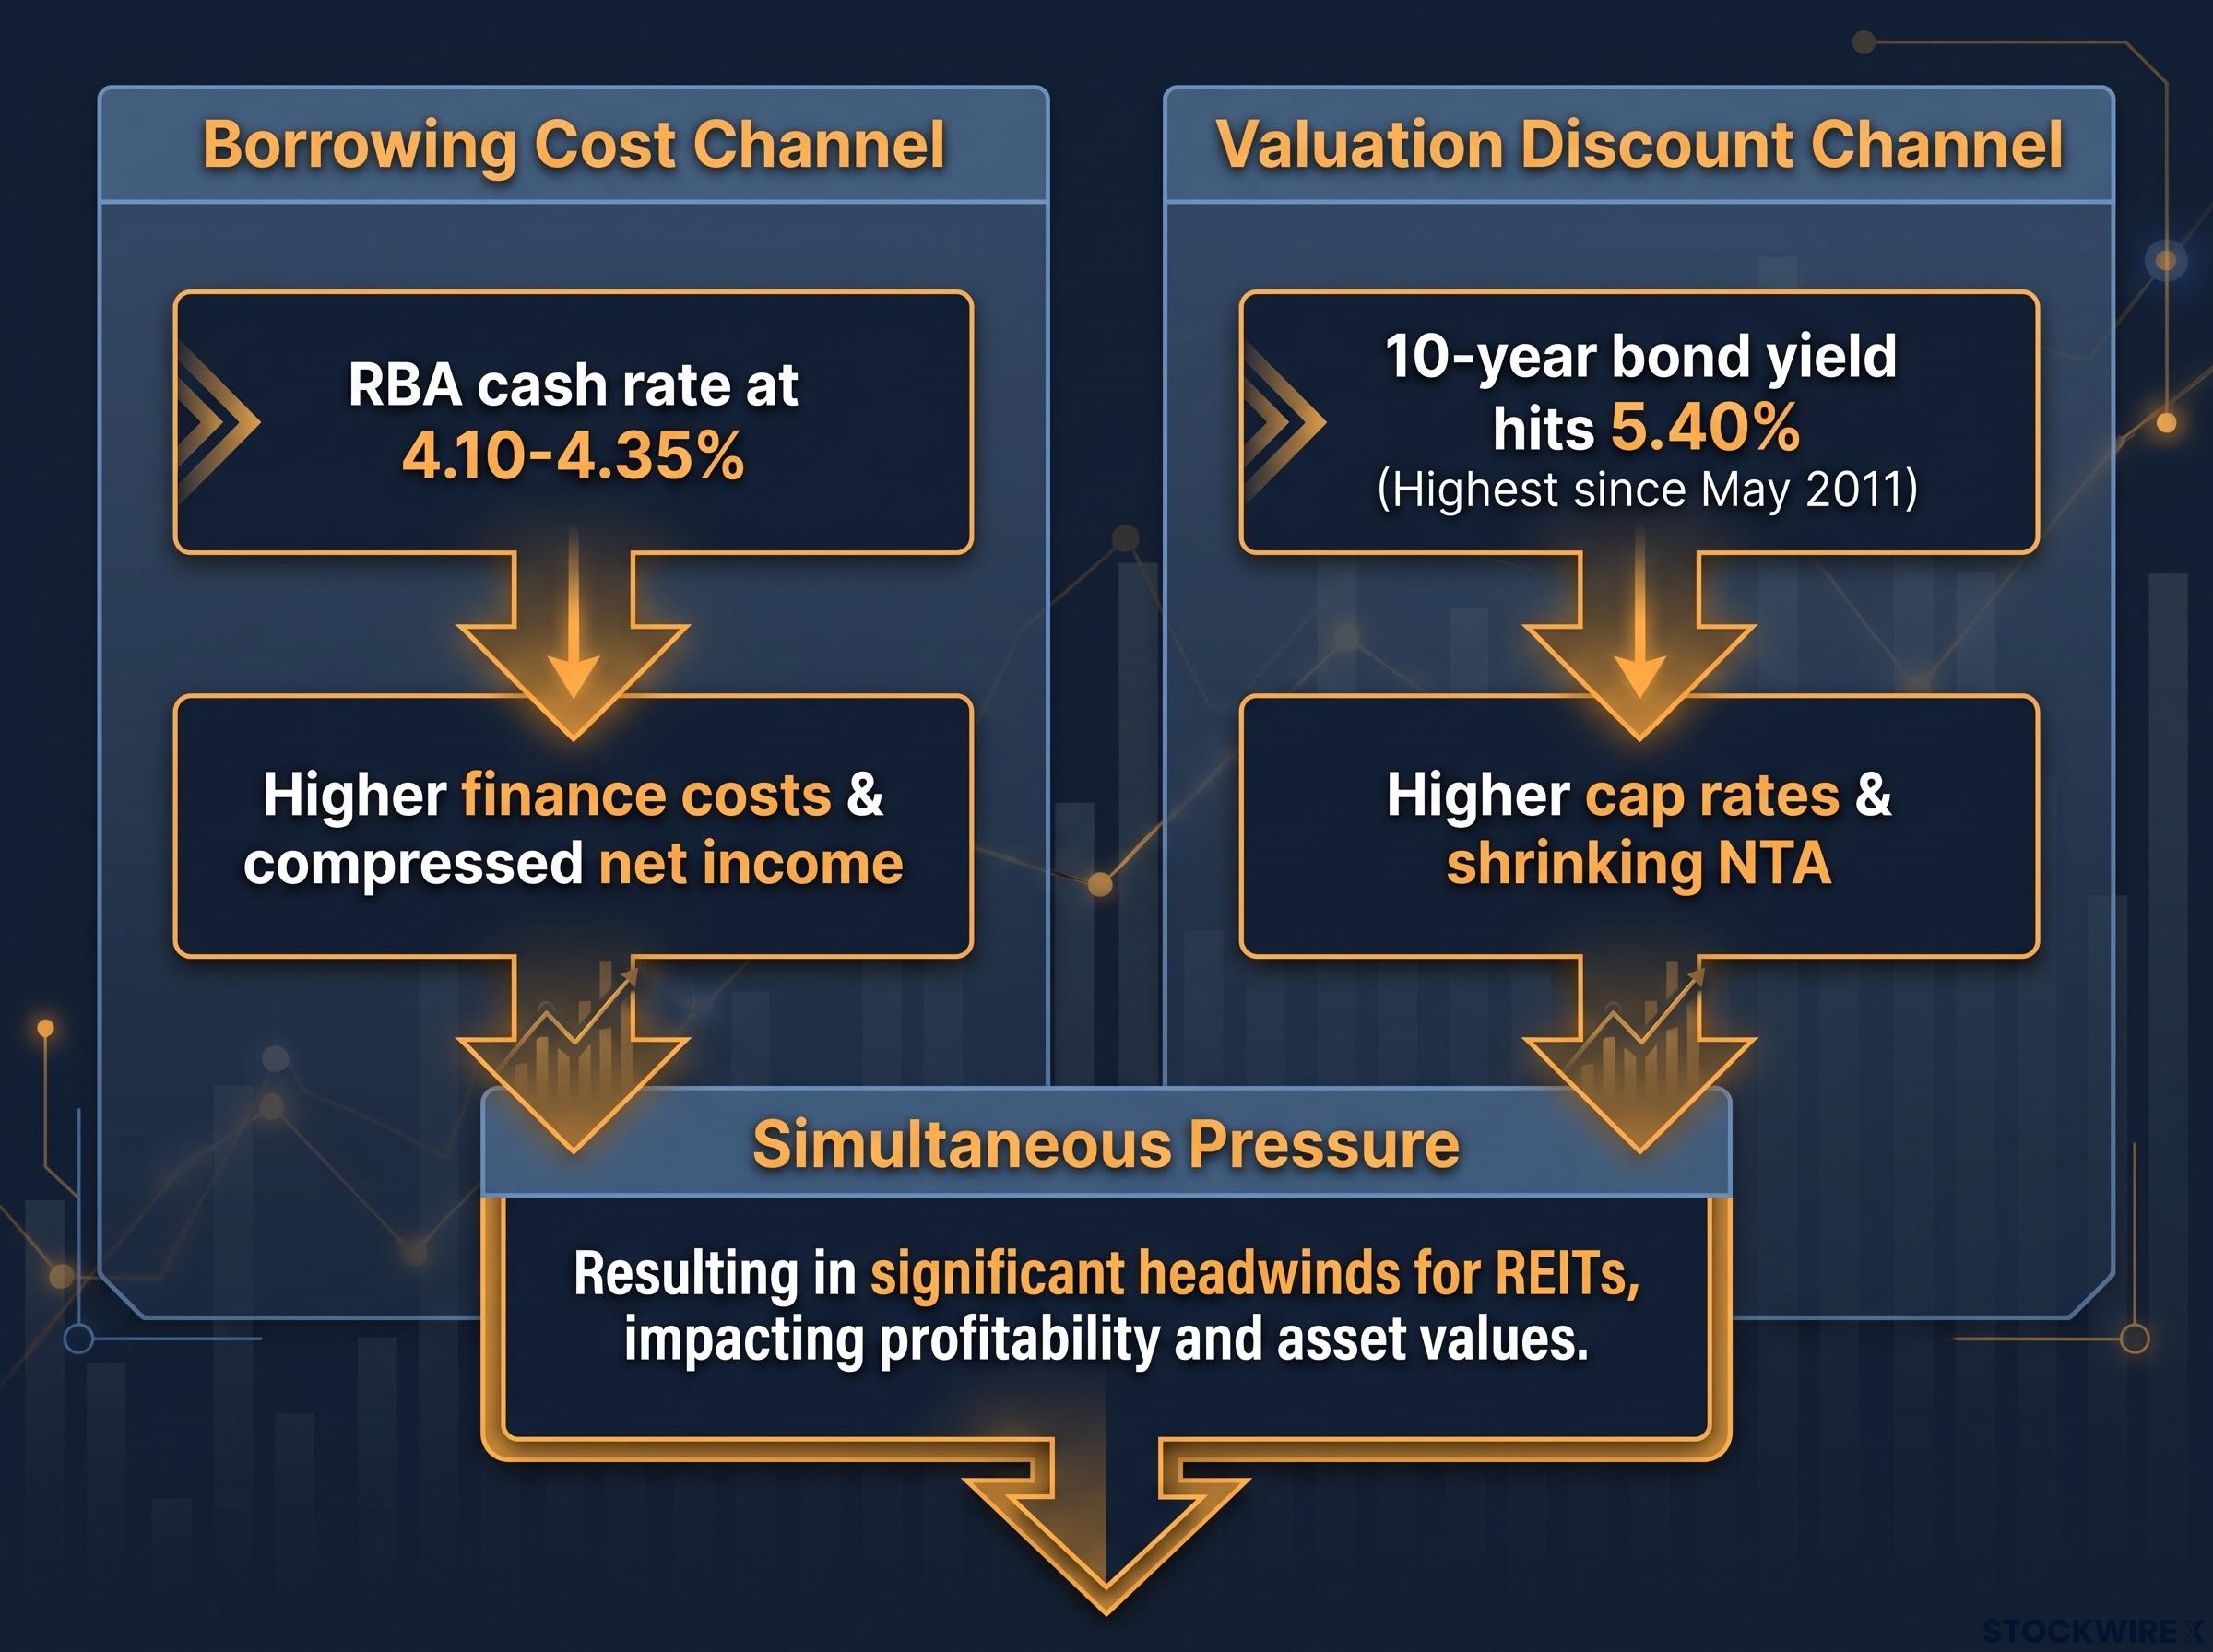
The anchor number Australia’s 10-year Commonwealth government bond yield hit 5.40% on 10 September 2026, which Bloomberg reported as the highest level since May 2011, up roughly 110 basis points from a year earlier.
The mechanics are already tightening. Three-year swap rates have risen 75 basis points over six months, and cap-rate expansion of 10-50 basis points is projected over the next two years if yields hold. Retail and industrial cap rates currently sit about 100 basis points below office cap rates, meaning the sub-sectors investors have historically favoured have the least valuation cushion left.
Carry this framework into every REIT conversation you have. Two separate squeezes, one on income and one on valuation, running at the same time, is why a 110-basis-point move in the 10-year can produce a 12% sector drawdown in six weeks. A dividend yield that looks attractive in isolation is being compressed by forces still in motion.
Empirical research on Australian REIT performance and interest rate sensitivity confirms that leverage amplifies the negative relationship between rising long-term yields and trust returns, with highly geared vehicles showing disproportionately larger drawdowns relative to the rate move itself.
How the major REITs are navigating the pressure
The mechanism is universal. The response is not. Balance sheet discipline varies enough across these trusts that “the sector is under pressure” is a starting point, not a conclusion, and stock selection is doing serious work right now.
Take BWP Trust as the counter-example. Its FY26 funds from operations (FFO), the cash a property trust actually generates, rose 4.5% to $140.9 million, at 19.29 cents per security. Its weighted average cap rate firmed to 5.25%, and NTA rose 3.3% to $4.11.
BWP’s counter-signal While BWP units fell 3.8% for the week, the trust’s NTA climbed 3.3% to $4.11 and its property book gained $257 million in value. The unit price and the underlying assets are telling different stories.
Others have been busy on the refinancing front. Charter Hall executed $22.6 billion of new and refinanced facilities in FY26, at an average margin saving of 20 basis points. Its Retail REIT holds gearing of 30.9% at a 5.0% weighted average debt cost, while its Long WALE REIT sits near 27.5% gearing after cutting margins by 20 basis points to 1.2%.
The Charter Hall Long WALE refinancing in June 2026 illustrates the balance sheet calculus precisely: by extending weighted average maturity from 2.7 to 4.3 years and cutting its credit margin by 20 basis points across ten lenders, the trust converted a macro headwind into a near-term runway advantage.
Arena REIT refinanced in February 2026, lifting its facility to around $700 million with a weighted average maturity of 4 years and $189 million undrawn, and actually reduced margins in the process. Waypoint REIT issued a $250 million six-year note in August 2026, holding its weighted average debt cost at 4.7%.
| REIT | Gearing | Avg debt cost | Avg debt maturity | Hedging |
|---|---|---|---|---|
| Charter Hall Retail | 30.9% | 5.0% | 3.6 years | Not disclosed |
| Charter Hall Long WALE | ~27.5% | Not disclosed | 4.1-4.3 years | Not disclosed |
| Arena REIT | Not disclosed | Not disclosed | 4 years | Not disclosed |
| Waypoint REIT | Not disclosed | 4.7% | 3.8 years | Not disclosed |
| HomeCo Daily Needs | 35.7% | 5.0% | 3.1 years | 68.4% |
HomeCo Daily Needs REIT carries gearing of 35.7% with a debt cost that has risen to 5.0% from 4.8%, but its hedging sits at 68.4% and climbs to 75% by June 2027, with no major maturity until FY28.
Here is the read for you. Trusts refinancing at lower margins even in a higher-rate environment show that balance sheet management is genuinely offsetting part of the macro headwind. Knowing which names carry near-term refinancing risk versus which have runway into 2028 and beyond is the most actionable distinction on the table. But the valuation discount channel does not care how well-managed your debt book is, which is why even BWP, with rising NTA, still saw its units fall.
Bull case, bear case, and what the data actually says
The professionals are split, and the split is not noise. It comes down to which risk each analyst believes is more binding right now.
The bull case
The value argument rests on a widening gap between price and worth. A Q1 2026 sector report put the coverage universe at an 18% average discount to fair value estimates. Pengana has argued property valuations have found their floor, pointing to NTAs rising 2-5% across the sector in H1 FY26.
The technicals back the oversold read. The sector’s relative strength index (RSI), a momentum gauge where readings below 30 signal heavy selling, hit 21.6, a capitulation-level print.
History adds weight. Research from NAREIT and Neuberger Berman found equity REITs delivered positive returns in 12 of 16 extended rising-rate periods since the mid-1990s, averaging 19% across rolling four-quarter windows of rising yields. Sharp drawdowns, on that record, tend to reverse within 6-12 months of a yield peak.
The bear case
The structural warning is just as specific. Fitch Ratings has cautioned that higher real rates deteriorate interest coverage ratios in a low-inflation environment, where rent indexation cannot rise fast enough to offset cap-rate expansion.
Pitcher Partners remains structurally underweight, expecting flat FY26 returns until rate-hike fears fully subside. The ASX Investor Update has flagged that a sticky-inflation, higher-for-longer cash rate scenario could trigger a second wave of valuation pressure.
REIT valuation drivers centre on the 10-year yield rather than the cash rate, a distinction that explains why even a credible RBA pivot to cutting would not immediately close the gap between current unit prices and NTA across the sector.
The Dexus caveat Dexus noted the AREIT 300 Index fell 16% in the month the 10-year yield broke 5%, but argued the market may be overestimating the immediate income hit, given the sector’s average cost of debt is roughly 5.5%.
So where does that leave you. The divide reduces to a single question: whether the 10-year yield holds above 5% long enough to force a second round of cap-rate expansion. The honest answer is that this is unknowable right now, which is exactly why position sizing matters more than conviction. Understanding both the structural bear case and the long-run recovery record lets you make a considered call rather than reacting to the 12% selloff or the oversold signal in isolation.
What changes the thesis, and what does not
The selloff has not changed everything. The structural sensitivity of the REIT model to interest rates is exactly what it always was. What has changed is the absolute level of yields at which the sector is now priced, and that distinction matters for how you weigh the recovery case.
Two variables will decide whether this is a bottoming process or an early stage of further deterioration:
- The 10-year yield relative to 5%. This has historically been the threshold where the sector’s drawdown accelerates. Yields holding above it point toward the projected 10-50 basis points of cap-rate expansion over two years.
- The RBA’s rate path. A move to cut would relieve the borrowing cost channel directly. A prolonged hold sustains the pressure across every trust in the sector.
- Balance sheet runway by name. Trusts with maturities stretching to 2028-2031, such as Arena, Waypoint and HomeCo, carry a different risk profile from names with shorter average debt terms.
- Asset class cap-rate exposure. Retail and industrial cap rates sit roughly 100 basis points below office, meaning more expansion risk in those sub-sectors if yields persist.
Here is the toolkit rather than a verdict: watch NTA trajectory against current price, weigh refinancing runway, and check which asset classes carry the least cushion.
The same structural sensitivity that makes REITs painful to hold when rates climb is what makes them capable of sharp recoveries when the environment turns. The practical question is whether your investment horizon can absorb what comes before that reversal arrives.
The structural gap between direct property vs A-REITs becomes most visible in exactly this kind of environment: physical property markets absorb cap-rate expansion gradually through infrequent valuations, while listed REIT prices reprice the same underlying assets in real time, often before the building-level impact is measurable.
This article is for informational purposes only and should not be considered financial advice. Investors should conduct their own research and consult with financial professionals before making investment decisions.
Past performance does not guarantee future results. Financial projections are subject to market conditions and various risk factors, and forward-looking statements are speculative and subject to change based on market developments.