Scentre Group’s share price has fallen 12.3% since the start of 2025, settling at A$3.71 as at 22 May 2026. Yet the company behind 42 Westfield shopping centres across Australia and New Zealand reported 99.8% occupancy and record funds from operations (FFO) when it delivered full-year results in February 2026. That gap between operational strength and market pricing is the tension at the centre of any SCG investment decision today. With the RBA lifting the cash rate to 4.35% and consumer spending moderating, ASX-listed A-REITs face a genuine conflict between resilient leasing fundamentals and rate-driven valuation compression. This analysis gives retail investors a structured framework for assessing whether SCG’s current pricing reflects opportunity, fair discount, or something in between, drawing on dividend yield analysis, FFO metrics, broker targets, and macroeconomic context.
The 12% decline in context: what the price chart is and is not telling you
Before interpreting direction, the raw positioning matters:
- Current price: A$3.71 (close 22 May 2026)
- 52-week range: A$3.28 to A$4.27
- Year-to-date decline from January 2025: 12.3%
- FY2025 FFO: A$1,187.5 million; 22.82 cents per security
- FY2025 distribution: 17.72 cents per security, up on the prior year
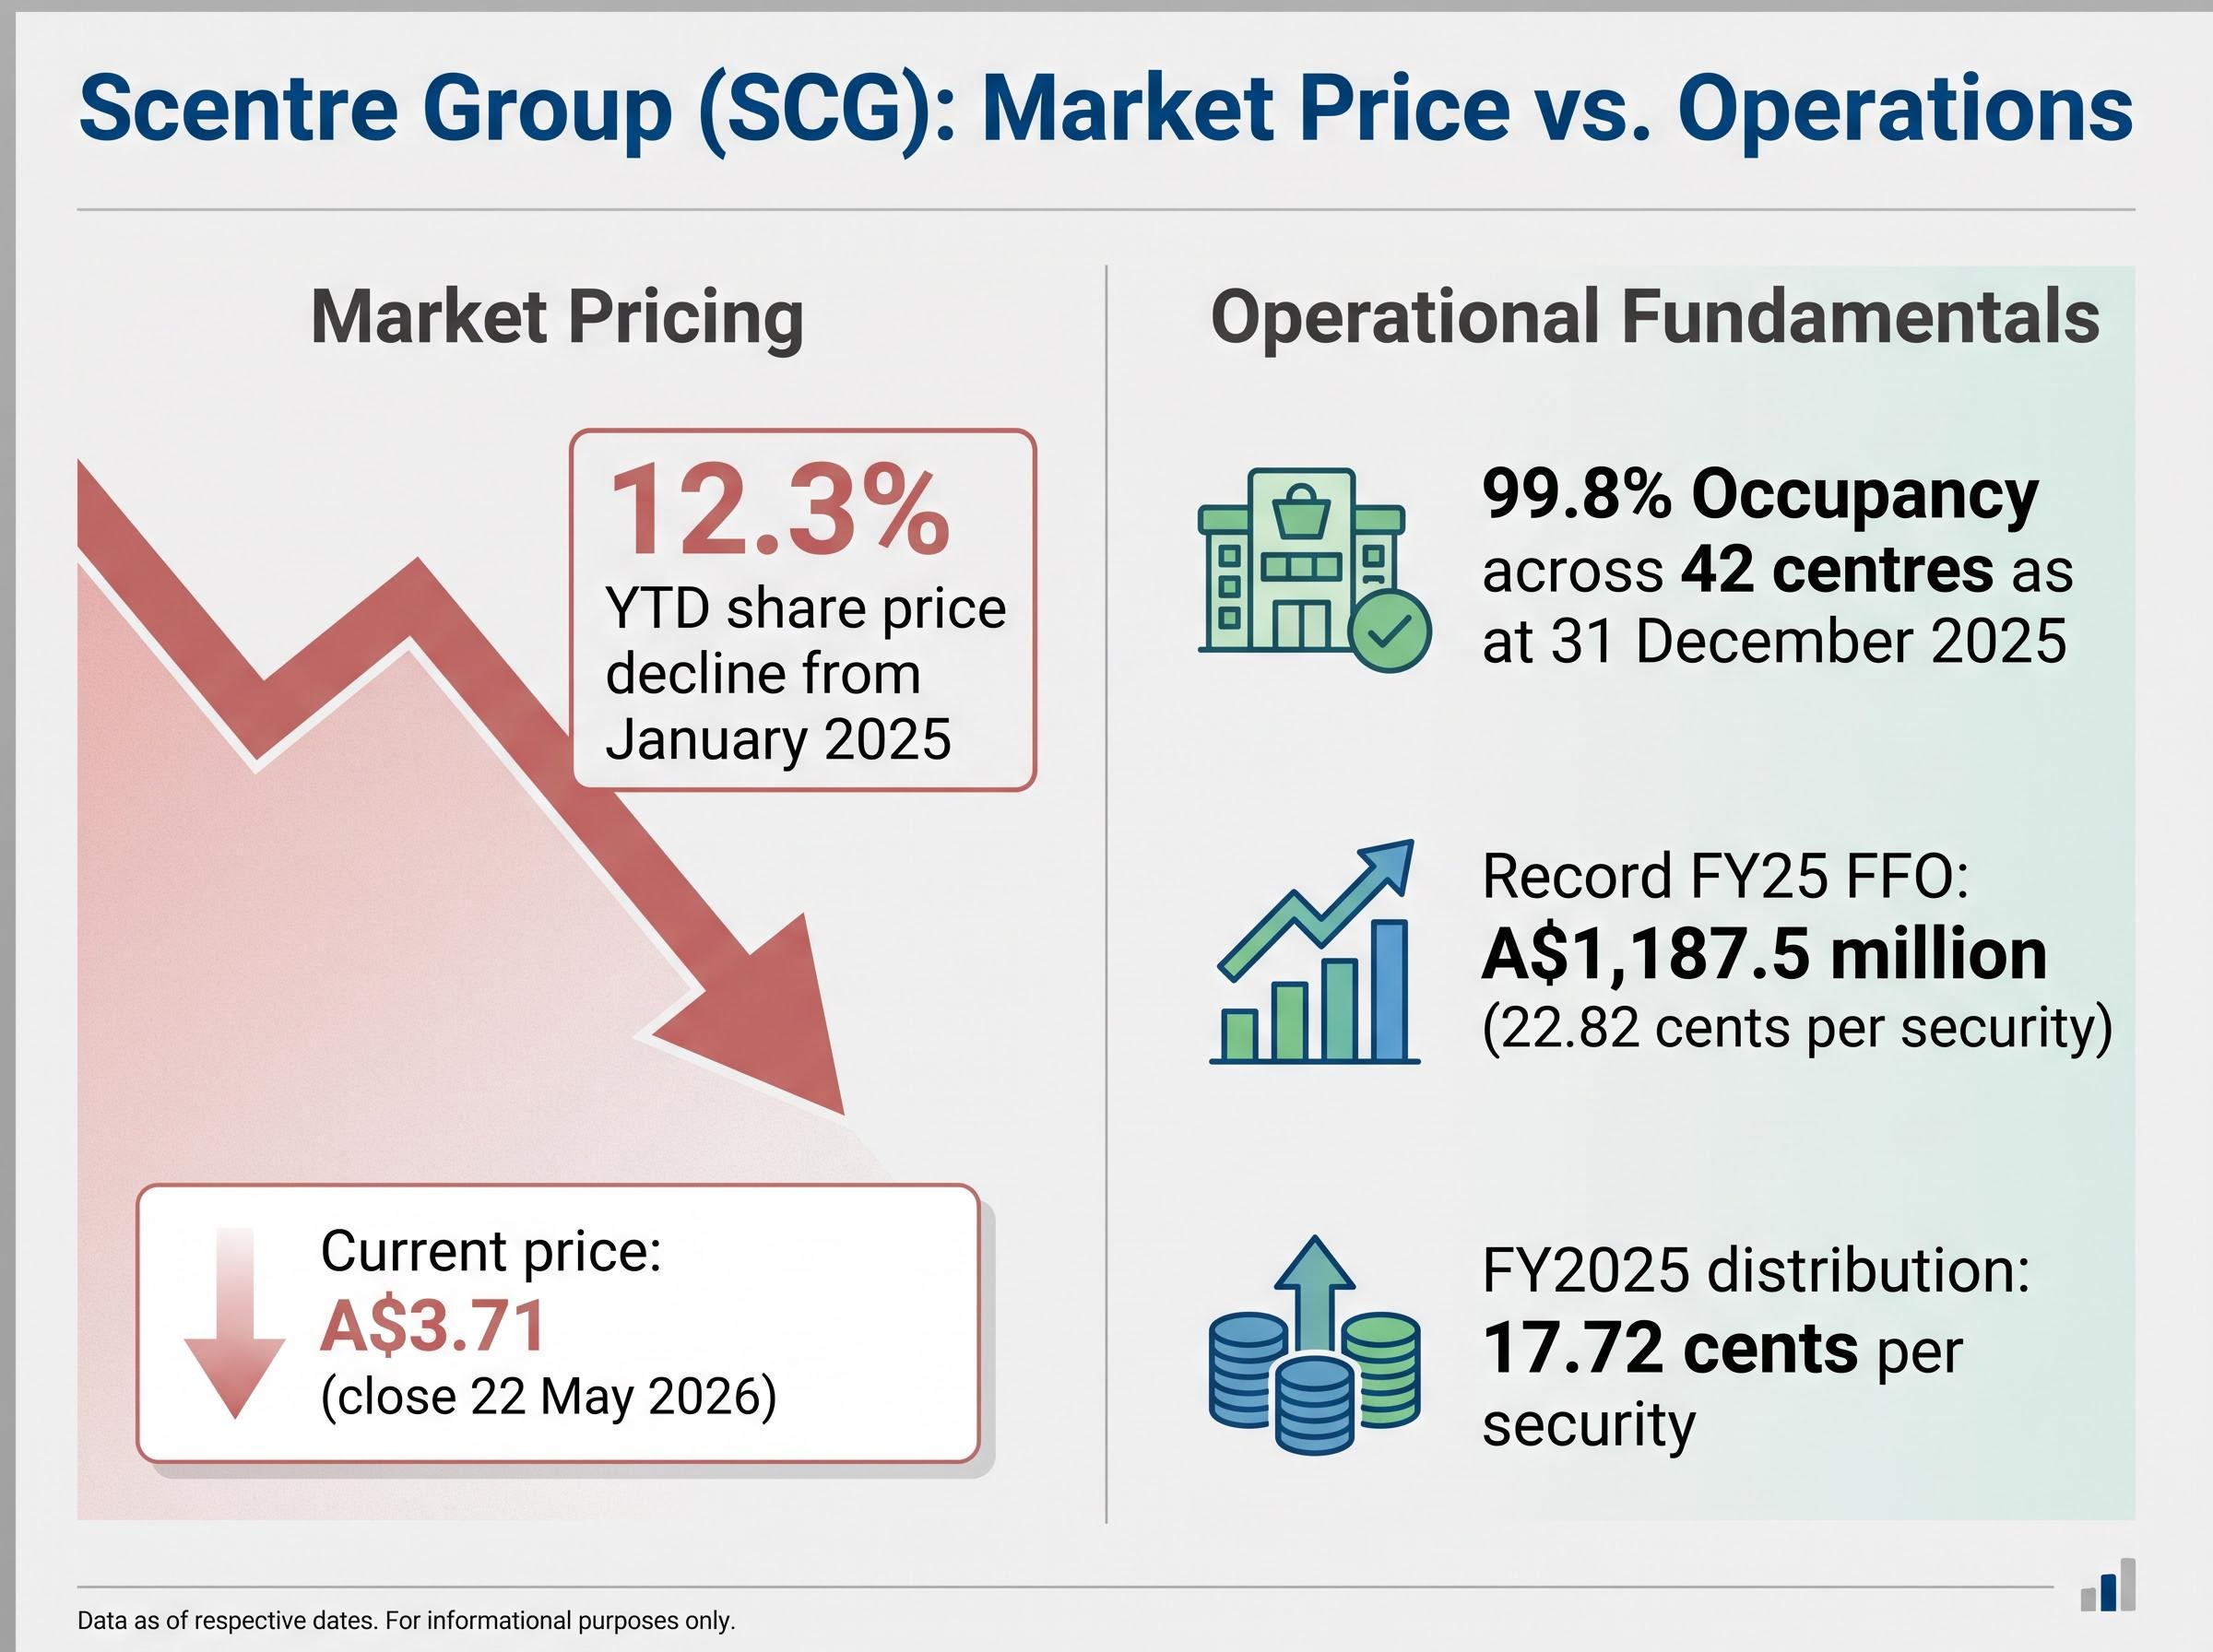
Scentre Group reported 99.8% occupancy across its 42 centres as at 31 December 2025, alongside record FFO of A$1,187.5 million, during the same period its share price declined 12.3%.
The price chart tells one story. The income statement tells another. Over the twelve months in which the security lost more than a tenth of its market value, the underlying business delivered its highest FFO on record and lifted its distribution. Occupancy never dipped below 99% across any reporting period in 2025.
That divergence frames the analytical question running through this piece: is the decline a macro-driven dislocation from fundamentals, or is the market pricing in something the headline operating numbers do not yet capture? Answering that question requires separating income quality from valuation, then layering in rate dynamics and broker sentiment.
When big ASX news breaks, our subscribers know first
What 99.8% occupancy and growing FFO actually mean for SCG’s income quality
Why FFO matters more than statutory profit for REIT investors
For real estate investment trusts, statutory net profit includes non-cash items such as depreciation charges and property revaluation movements. These items can swing profit figures dramatically without reflecting any change in actual cash generation. FFO strips those items out, isolating the recurring income a trust generates from its operations.
- FFO stands for funds from operations, removing depreciation, amortisation, and fair-value adjustments from the profit calculation
- Distributions are paid from FFO, not statutory profit, making FFO the metric that determines whether a REIT’s payout is sustainable
- A trust can report a statutory loss (due to a property revaluation markdown) while simultaneously generating healthy FFO and maintaining its distribution
- For income-focused investors, FFO per security is the closest proxy for distributable earnings quality
SCG’s 1H25 FFO came in at A$587 million (11.28 cents per security), reflecting growth driven by higher net property income. The full-year result extended that trajectory to 22.82 cents per security. Positive leasing spreads on renewals and new leases, confirmed in the 1H25 results, underpin near-term income visibility.
SCG’s debt management activity in April 2026 added a further layer to the income quality picture: the company retired US$1.17 billion in subordinated notes ahead of schedule, maintained approximately A$3.2 billion in liquidity, and reaffirmed 2026 FFO growth guidance of at least 4.0%, pointing to 23.73 cents per security for the full year.
A portfolio of 42 shopping centres with an assessed value exceeding A$34 billion creates a large, diversified income base. That scale is a strength when occupancy sits at 99.8%, because virtually every lettable square metre is generating rent. It is also, however, a high asset base exposed to capitalisation-rate risk, a point that becomes material when interest rates move.
FFO growth while the share price fell is the foundation of any value argument. It is also, on its own, insufficient. Income quality and valuation are different questions, and the next section addresses the gap between them.
Reading the dividend yield signal: what the gap between current and historical average reveals
At a share price of A$3.71 and a trailing distribution of 17.72 cents per security, SCG’s current dividend yield sits at approximately 4.78%. The five-year historical average yield is also approximately 4.78%, meaning the current price has converged almost exactly with the level implied by the long-run yield relationship.
| Metric | Current Value | Five-Year Average |
|---|---|---|
| Distribution per security | 17.72 cents | Below 17.72 cents (three-year avg.) |
| Dividend yield | ~4.78% | 4.78% |
| Implied fair-value price at avg. yield | A$3.71 | A$3.71 |
The near-perfect convergence is itself informative. SCG’s most recent annual distribution of 17.72 cents exceeds the three-year average, which means the yield is not being inflated by deteriorating payouts. The distribution numerator has grown. The price has simply adjusted to a level where the historical yield relationship holds.
The yield gap, to the extent one existed earlier in 2025, has been almost entirely a function of share price positioning, not distribution deterioration. The payout has increased; the price has moved to meet the long-run yield.
This matters for interpretation. A yield sitting at historical average does not automatically signal undervaluation or overvaluation. It signals that, on a yield basis alone, the market is pricing SCG roughly in line with its five-year norm. For the yield to signal opportunity, an investor would need to believe either that distributions will grow further from here or that the appropriate yield should compress (implying a higher share price). Both assumptions depend on the rate environment.
The yield premium across A-REITs varies considerably by sub-sector and lease structure, with Waypoint REIT’s 6.9% distribution yield illustrating how differently the market prices defensive triple-net-lease property income relative to SCG’s retail-anchored 4.78% yield, a comparison that frames how much of SCG’s yield compression reflects asset type rather than rate sentiment alone.
Rate headwinds and the macro overhang pressing on SCG’s valuation
How rising rates compress REIT valuations even when income grows
REIT valuations are anchored to discount rates derived from risk-free yields. When the RBA lifts the cash rate, the discount rate applied to future rental cash flows rises, reducing present value. Separately, capitalisation rates on commercial property tend to expand in higher-rate environments, meaning portfolio valuations can fall even if rental income is growing. A REIT can report rising FFO and still see its net tangible assets decline because the asset base is marked at a higher cap rate.
The RBA raised the cash rate by 0.25 percentage points on 5 May 2026, bringing it to 4.35%. Statements from the Board have maintained data-dependent guidance, leaving the outlook for rate-sensitive asset classes uncertain. This environment has weighed on A-REIT valuations broadly, not just SCG.
The RBA cash rate target reached 4.35% following the Board’s decision effective 6 May 2026, a level that has materially lifted the discount rates applied to long-duration property income streams across the A-REIT sector.
Three forces are pulling in different directions for Scentre Group:
Long-bond yield dynamics matter more than the cash rate for REIT valuations, a nuance that helps explain why the A-REIT sector has not fully recovered despite expectations of a rate pause: the 10-year yield path, rather than the RBA’s terminal cash rate, is the more direct input into the discount rates applied to property income streams.
- Rate headwind: Higher discount rates reduce the present value of SCG’s rental cash flows and compress the price investors will pay per dollar of FFO
- Income growth offset: Rent indexation and positive leasing spreads mean the income numerator is also growing, partially countering the discount-rate drag
- Cap-rate expansion risk: A portfolio valued at more than A$34 billion is highly sensitive to even modest cap-rate movements; a 25-basis-point expansion across the portfolio would reduce assessed value by hundreds of millions of dollars
ABS Retail Trade data through 2025 showed nominal retail sales growth continuing, though at a moderating pace. Discretionary categories including fashion and homewares softened relative to essentials and services tenants, a relevant detail for specialty sales growth assumptions at Westfield centres.
Whether SCG’s income growth can outpace the valuation headwind from higher discount rates is the question the market is currently pricing. The share price decline is not irrational; it reflects that tension.
What the broker consensus range of A$3.23 to A$4.60 tells investors about disagreement and risk
| Broker | Rating | 12-Month Target | Key Rationale |
|---|---|---|---|
| UBS | Hold | A$3.85 | Operational resilience offset by rate headwinds |
| Macquarie | Hold | A$3.23 | Cap-rate expansion risk in current rate environment |
| Morgan Stanley | Buy | A$4.44 | Resilient centre performance and tenant remixing |
| Citi | Buy | A$4.40 | Attractive total returns from distributions and operations |
The consensus average target of approximately A$4.02 implies roughly 8% upside from SCG’s current price of A$3.71.
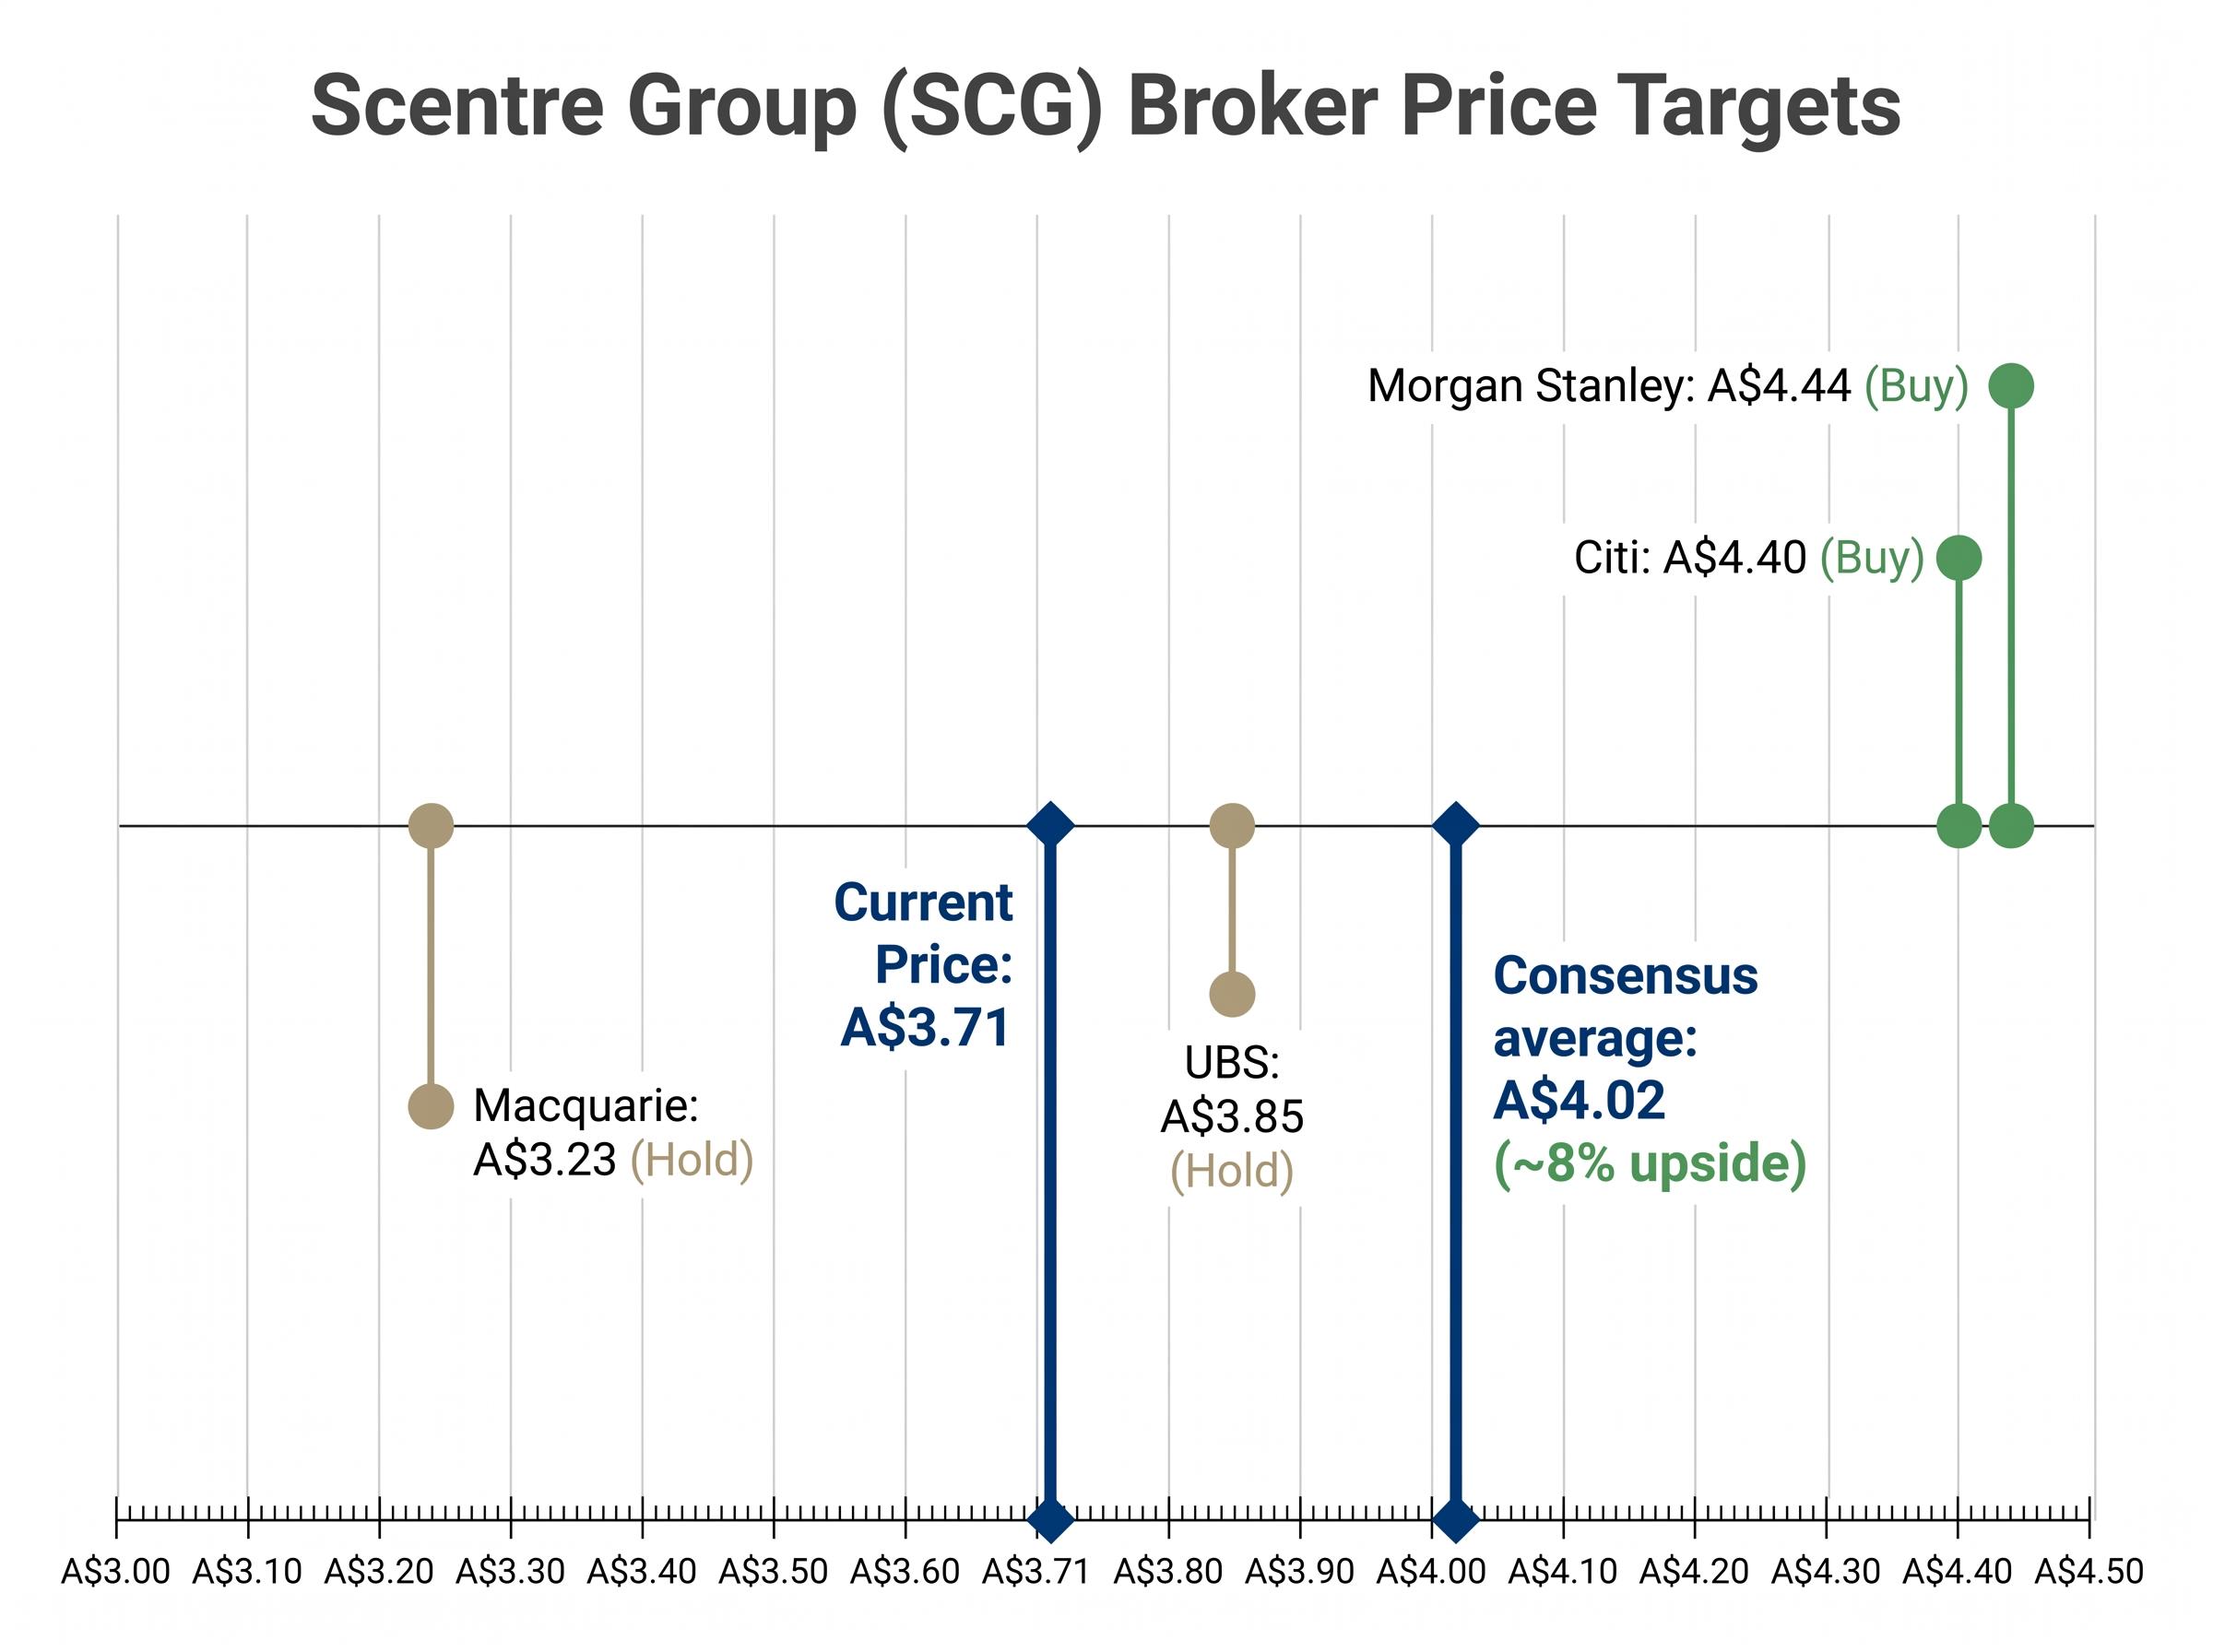
The A$1.37 spread between Macquarie’s A$3.23 target and the Buy-rated targets from Morgan Stanley (A$4.44) and Citi (A$4.40) is unusually wide. It does not reflect analytical error. It reflects genuine disagreement about the rate trajectory and its impact on cap rates.
SCG’s current price of A$3.71 sits below the consensus average and below every Buy-rated target. It also sits above Macquarie’s Hold target of A$3.23. That positioning means the current price is consistent with both bull and bear readings, depending on which rate assumptions an investor adopts. Broker targets are directional signals, not guarantees. The breadth of the spread here is itself the signal: SCG is genuinely contested territory among institutional analysts.
Undervalued, fairly priced, or cautiously positioned: how to frame SCG’s investment case today
The evidence assembled across this analysis supports two competing theses.
Bull case:
- 99.8% occupancy across 42 Westfield centres
- Growing distribution of 17.72 cents per security, above the three-year average
- FFO of 22.82 cents per security, a record result
- Current price of A$3.71 sits below the broker consensus target of approximately A$4.02
Bear case:
- RBA cash rate at 4.35% with data-dependent (and therefore uncertain) forward guidance
- Cap-rate expansion risk on a portfolio valued at more than A$34 billion
- Discretionary retail categories softening, potentially tempering specialty sales growth
Neither case is unreasonable. The bull thesis rests on income strength and a discount to consensus; the bear thesis rests on the mathematical reality that higher rates compress the value of long-duration property assets regardless of operating performance.
Vicinity Centres acquisition strategy in May 2026, committing A$400 million to Eastern Creek Quarter using existing debt facilities without an equity raise, represents a contrasting capital allocation approach to SCG’s debt retirement activity and signals that the largest Australian retail REIT landlords are taking divergent views on balance sheet deployment within the same rate environment.
Rather than declaring a verdict, investors may find it more useful to monitor three variables that would shift the balance:
- RBA rate decisions and forward guidance, particularly any signal of a pause or reversal in the tightening cycle
- SCG’s next operational update or half-year result, for confirmation that FFO growth and occupancy are holding
- Movement in the broker consensus target range, which would signal whether institutional views are converging toward the bull or bear case
The yield-versus-rate trade-off will define SCG’s next 12 months
SCG’s operational fundamentals are demonstrably strong. Record FFO, near-full occupancy, and a growing distribution confirm that the business is performing. The share price discount, however, is not irrational; it reflects a rate environment that compresses the value of property income streams, regardless of their quality.
Dividend yield analysis provides a useful starting point, but it requires pairing with FFO sustainability assessment and macro context before supporting any conviction. Investors seeking to move beyond yield-based screening toward a fuller valuation judgment may consider running a discounted cash flow or dividend discount model using the 22.82 cents per security FFO figure as the starting point.
The two most material near-term catalysts are SCG’s next results release and subsequent RBA announcements. Both will determine whether the operational strength that has defined the past twelve months can begin to close the gap with the share price.
This article is for informational purposes only and should not be considered financial advice. Investors should conduct their own research and consult with financial professionals before making investment decisions. Past performance does not guarantee future results. Financial projections are subject to market conditions and various risk factors.