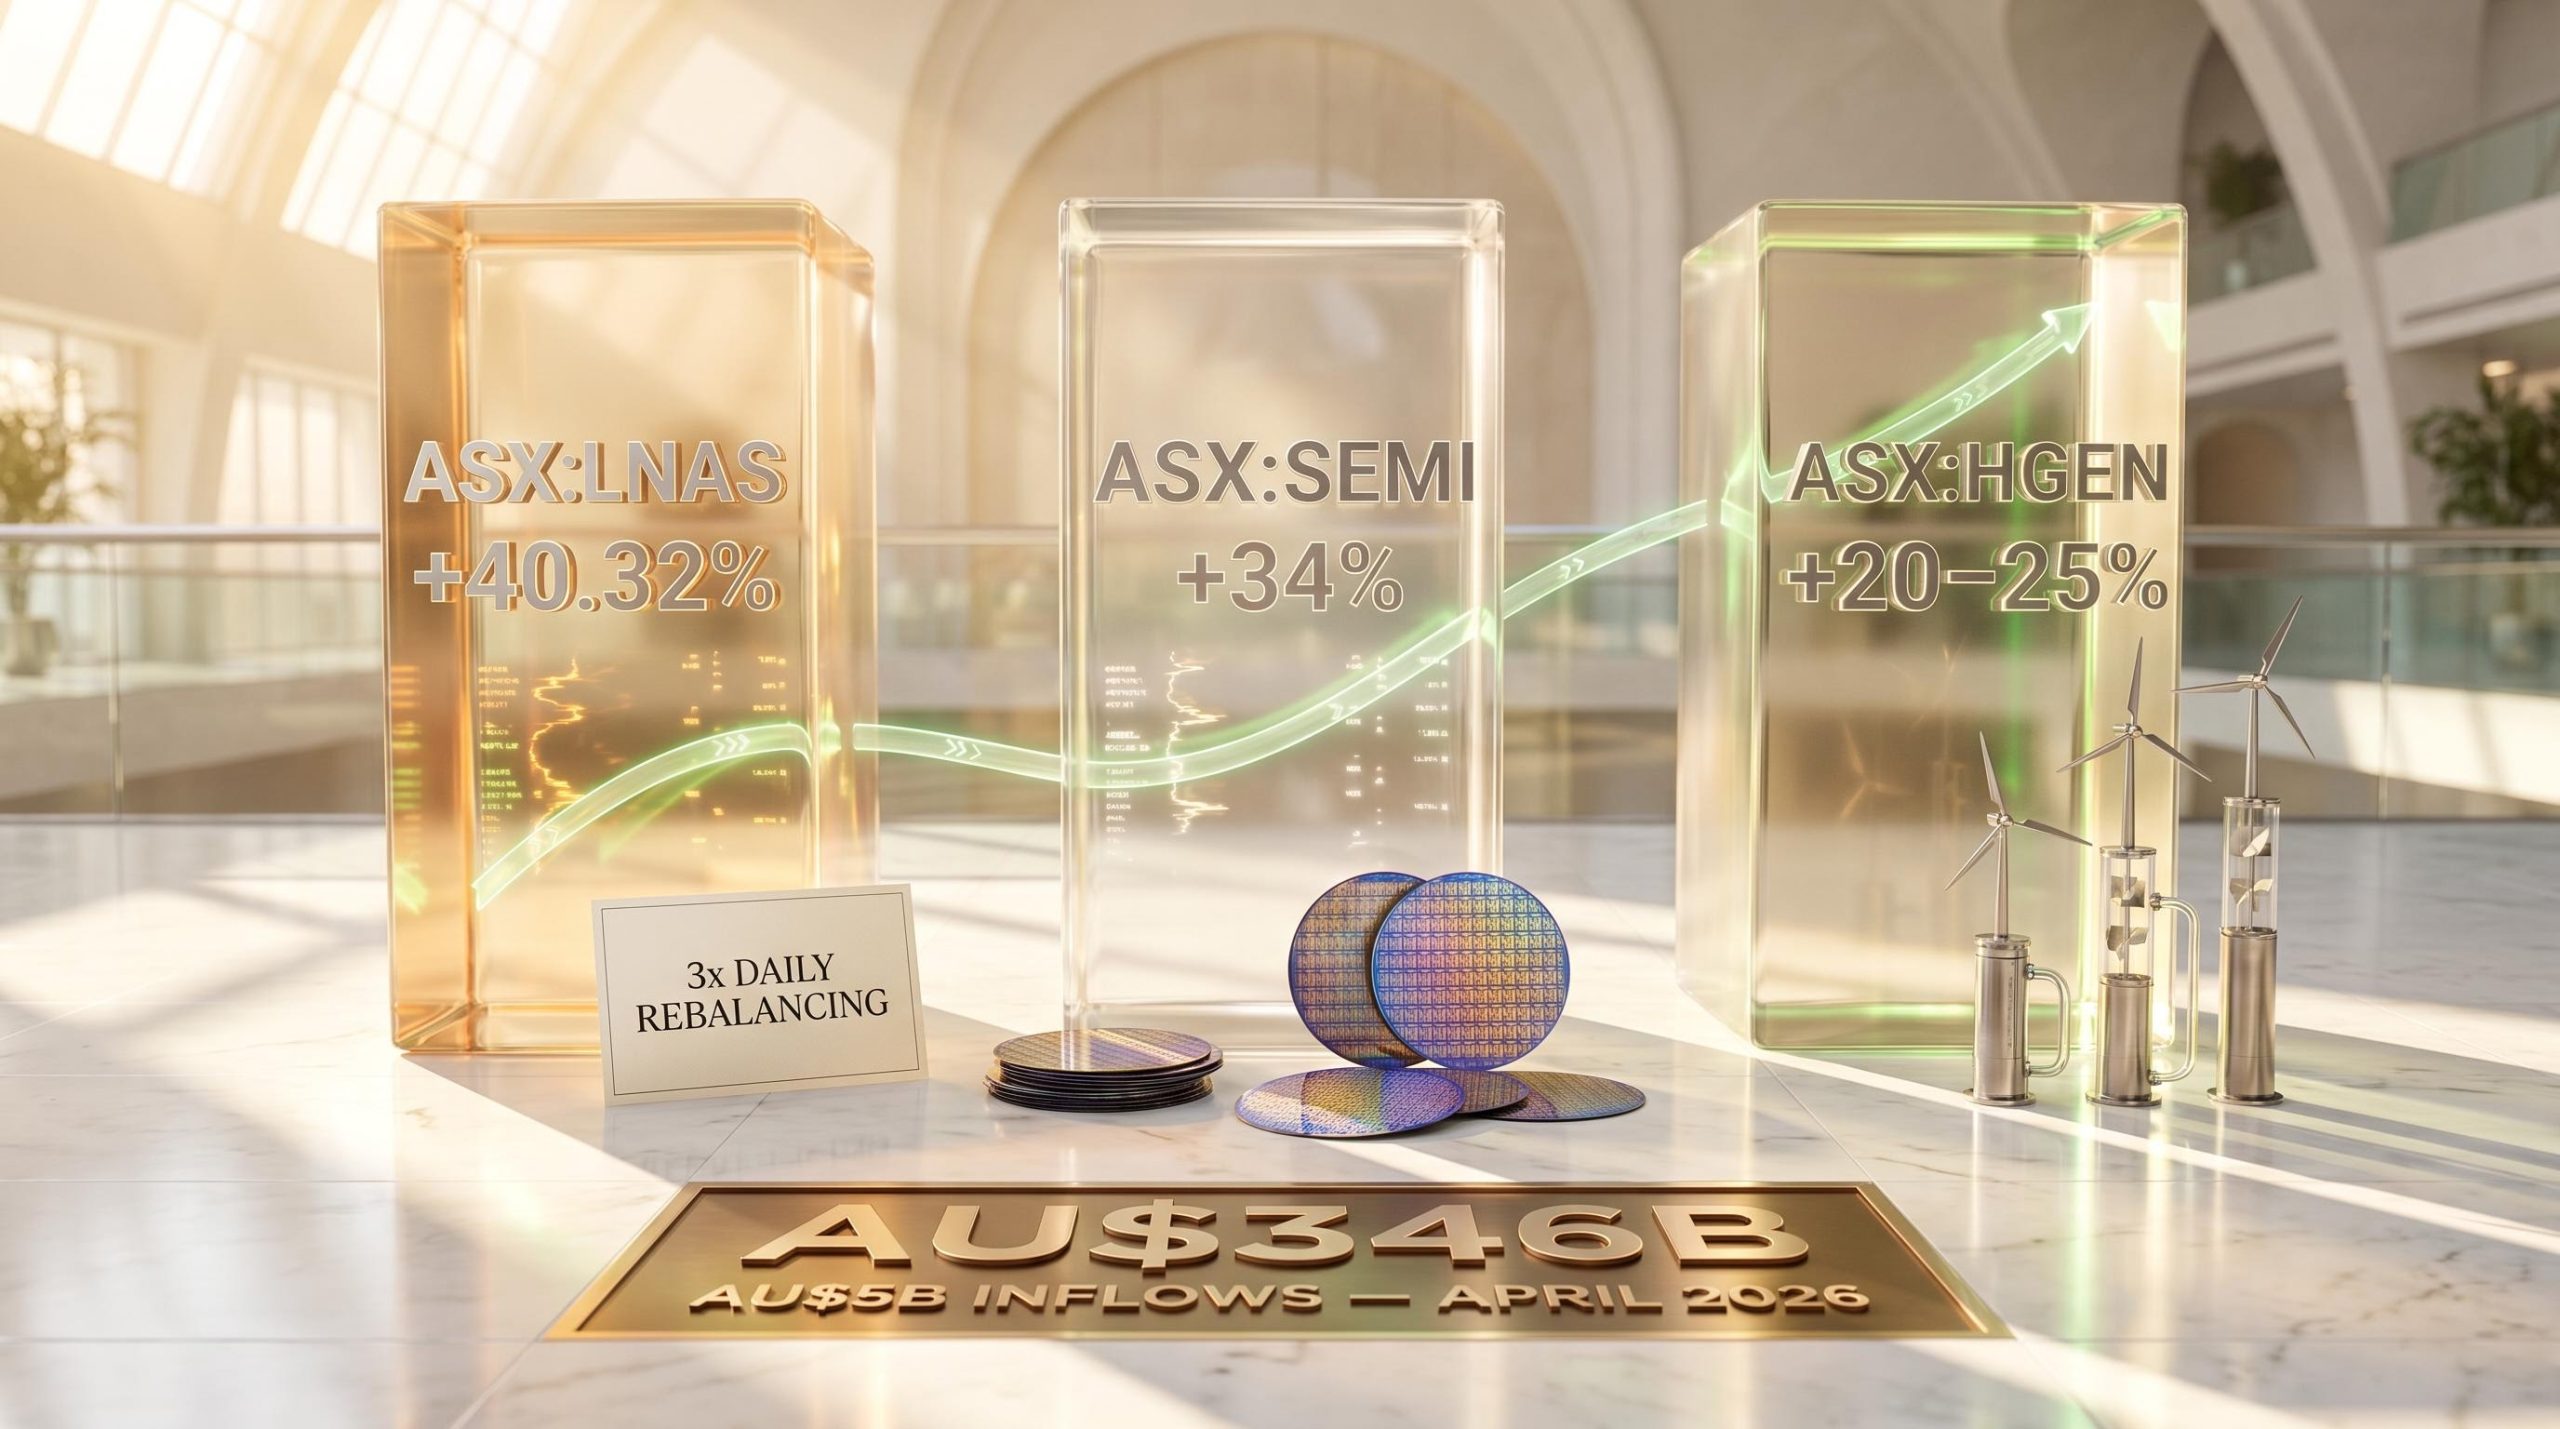
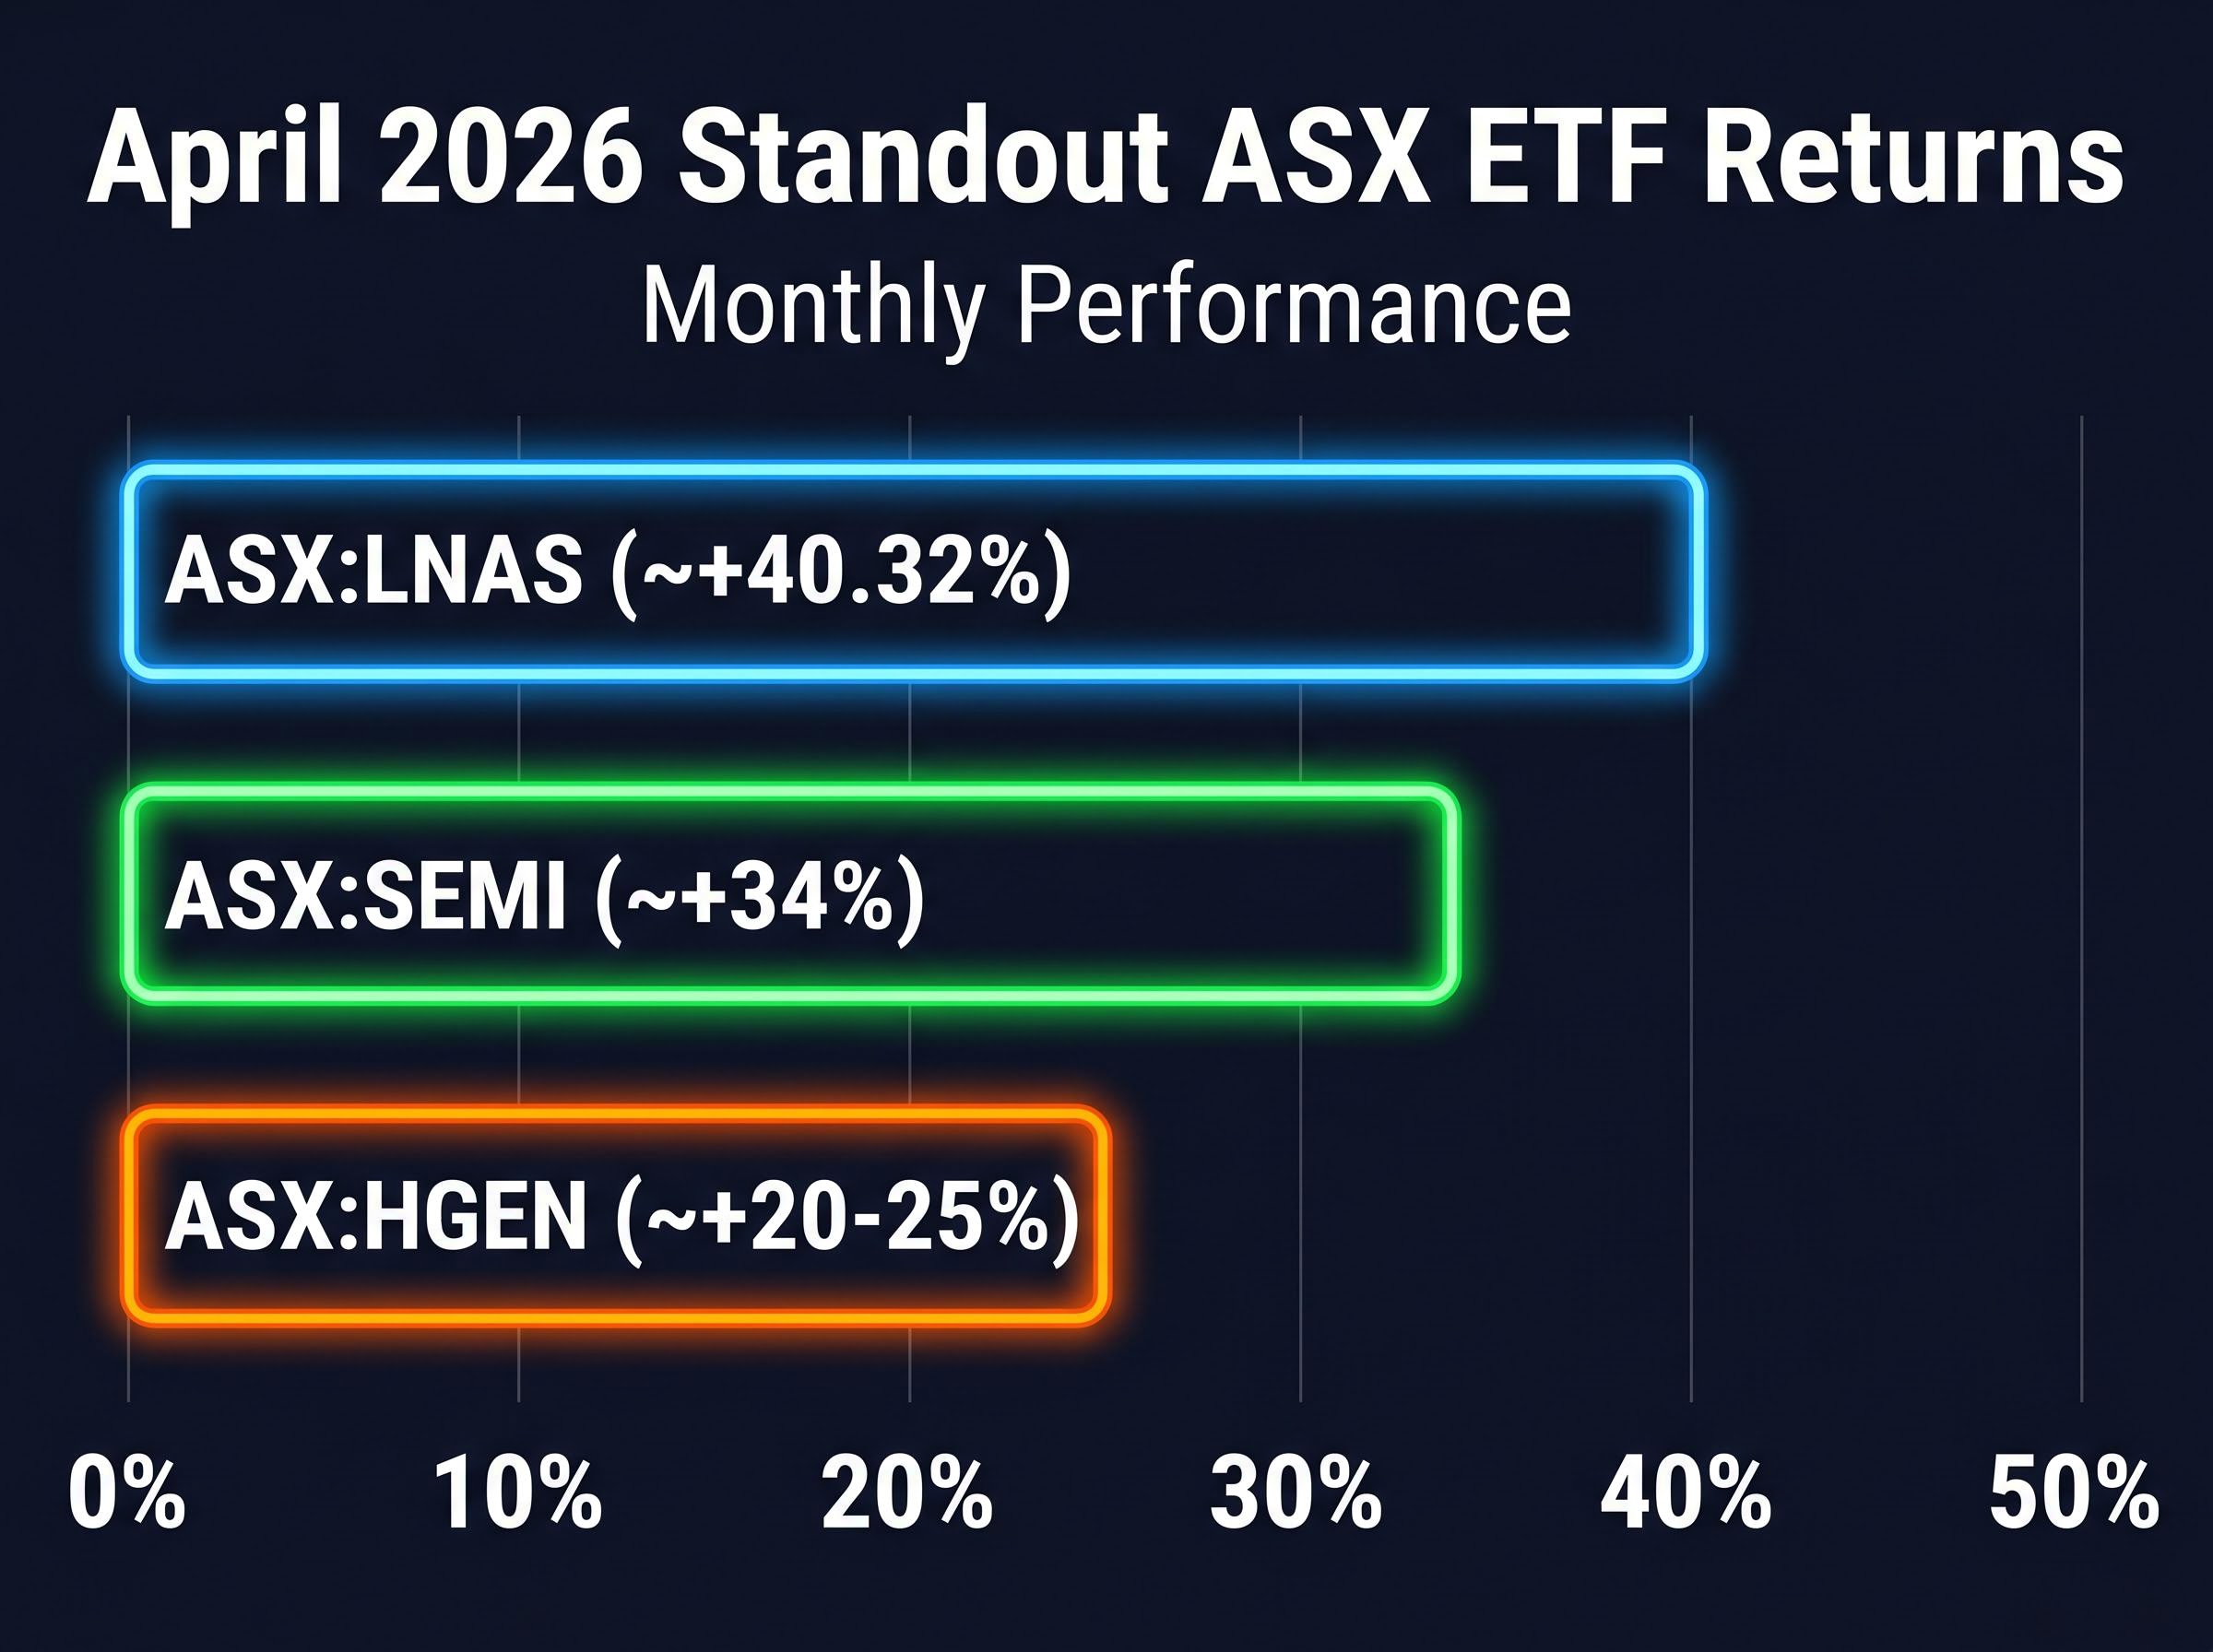
Australia’s exchange-traded fund industry crossed AU$346 billion in funds under management in April 2026, a record that confirmed the asset class’s structural hold on retail and institutional portfolios alike. Buried inside that headline, though, is a more pointed story. A single leveraged Nasdaq fund returned approximately 40% in one month. A semiconductor ETF gained roughly 34%. A hydrogen fund rose between 20% and 25%. These were not random outliers. Each return traces back to identifiable macro forces: the largest AI hardware spending cycle in corporate history, and a geopolitical shock from the Iran conflict reshaping energy and defence sentiment. Understanding which force drove which ASX ETF, and how much of each return reflects structural positioning versus momentum, is what separates informed allocation from performance chasing. This analysis unpacks the specific drivers behind April’s standout returns, assesses what is durable versus what is already priced in, and offers Australian investors a framework for evaluating thematic and leveraged ETF exposure going forward.
April’s record FUM milestone and what the inflow data actually shows
The AU$346 billion figure is worth examining as a signal rather than a celebration. Monthly net inflows surpassed AU$5 billion, marking the third-largest single-month dollar gain in Australian ETF industry history, according to BetaShares investment strategist Hugh Lam.
- Total industry FUM: approximately AU$346 billion (April 2026 record)
- Monthly net inflows: surpassed AU$5 billion
- International equities share: approximately AU$2.6 billion, close to half of total inflows
The international equities figure is the most instructive. Nearly half the month’s inflows were directed offshore, a composition that points toward deliberate global diversification rather than a concentrated rush into whichever thematic fund topped the monthly leaderboard.
The generational divergence in Australian ETF allocation adds another dimension to the inflow composition: younger investors have been disproportionately rotating toward global growth and thematic exposures, while older participants have maintained a stronger tilt toward domestic equities and income-oriented products, a split that helps explain why international equities captured close to half of April’s AU$5 billion net inflow total.
Where the new money went
International equities ranked first by asset class, followed by Australian equities and fixed income. Vanguard-branded products dominated by raw inflow volume, reflecting a preference for broad, low-cost diversification running in parallel with the thematic surge. That duality matters: the industry record was built on both disciplined core allocation and high-conviction thematic bets, and the durability of the inflow trend depends on which behaviour persists.
When big ASX news breaks, our subscribers know first
The AI capex supercycle powering semiconductor returns
The semiconductor story begins not with a chart but with a spending commitment. Microsoft reported Q3 FY2026 capital expenditure of US$30.9 billion, up approximately 85% year on year, and guided full-year FY2026 capex at US$190 billion, directed primarily at AI data centres.
Then Alphabet confirmed full-year 2026 capex guidance of US$180-190 billion, with strong indications that 2027 would rise further. Amazon disclosed Q1 2026 capex of US$43.2 billion, largely allocated to AWS and AI infrastructure, with CEO Andy Jassy signalling accelerated spending into the second half. Meta reaffirmed February 2026 guidance of US$60-65 billion for FY2026.
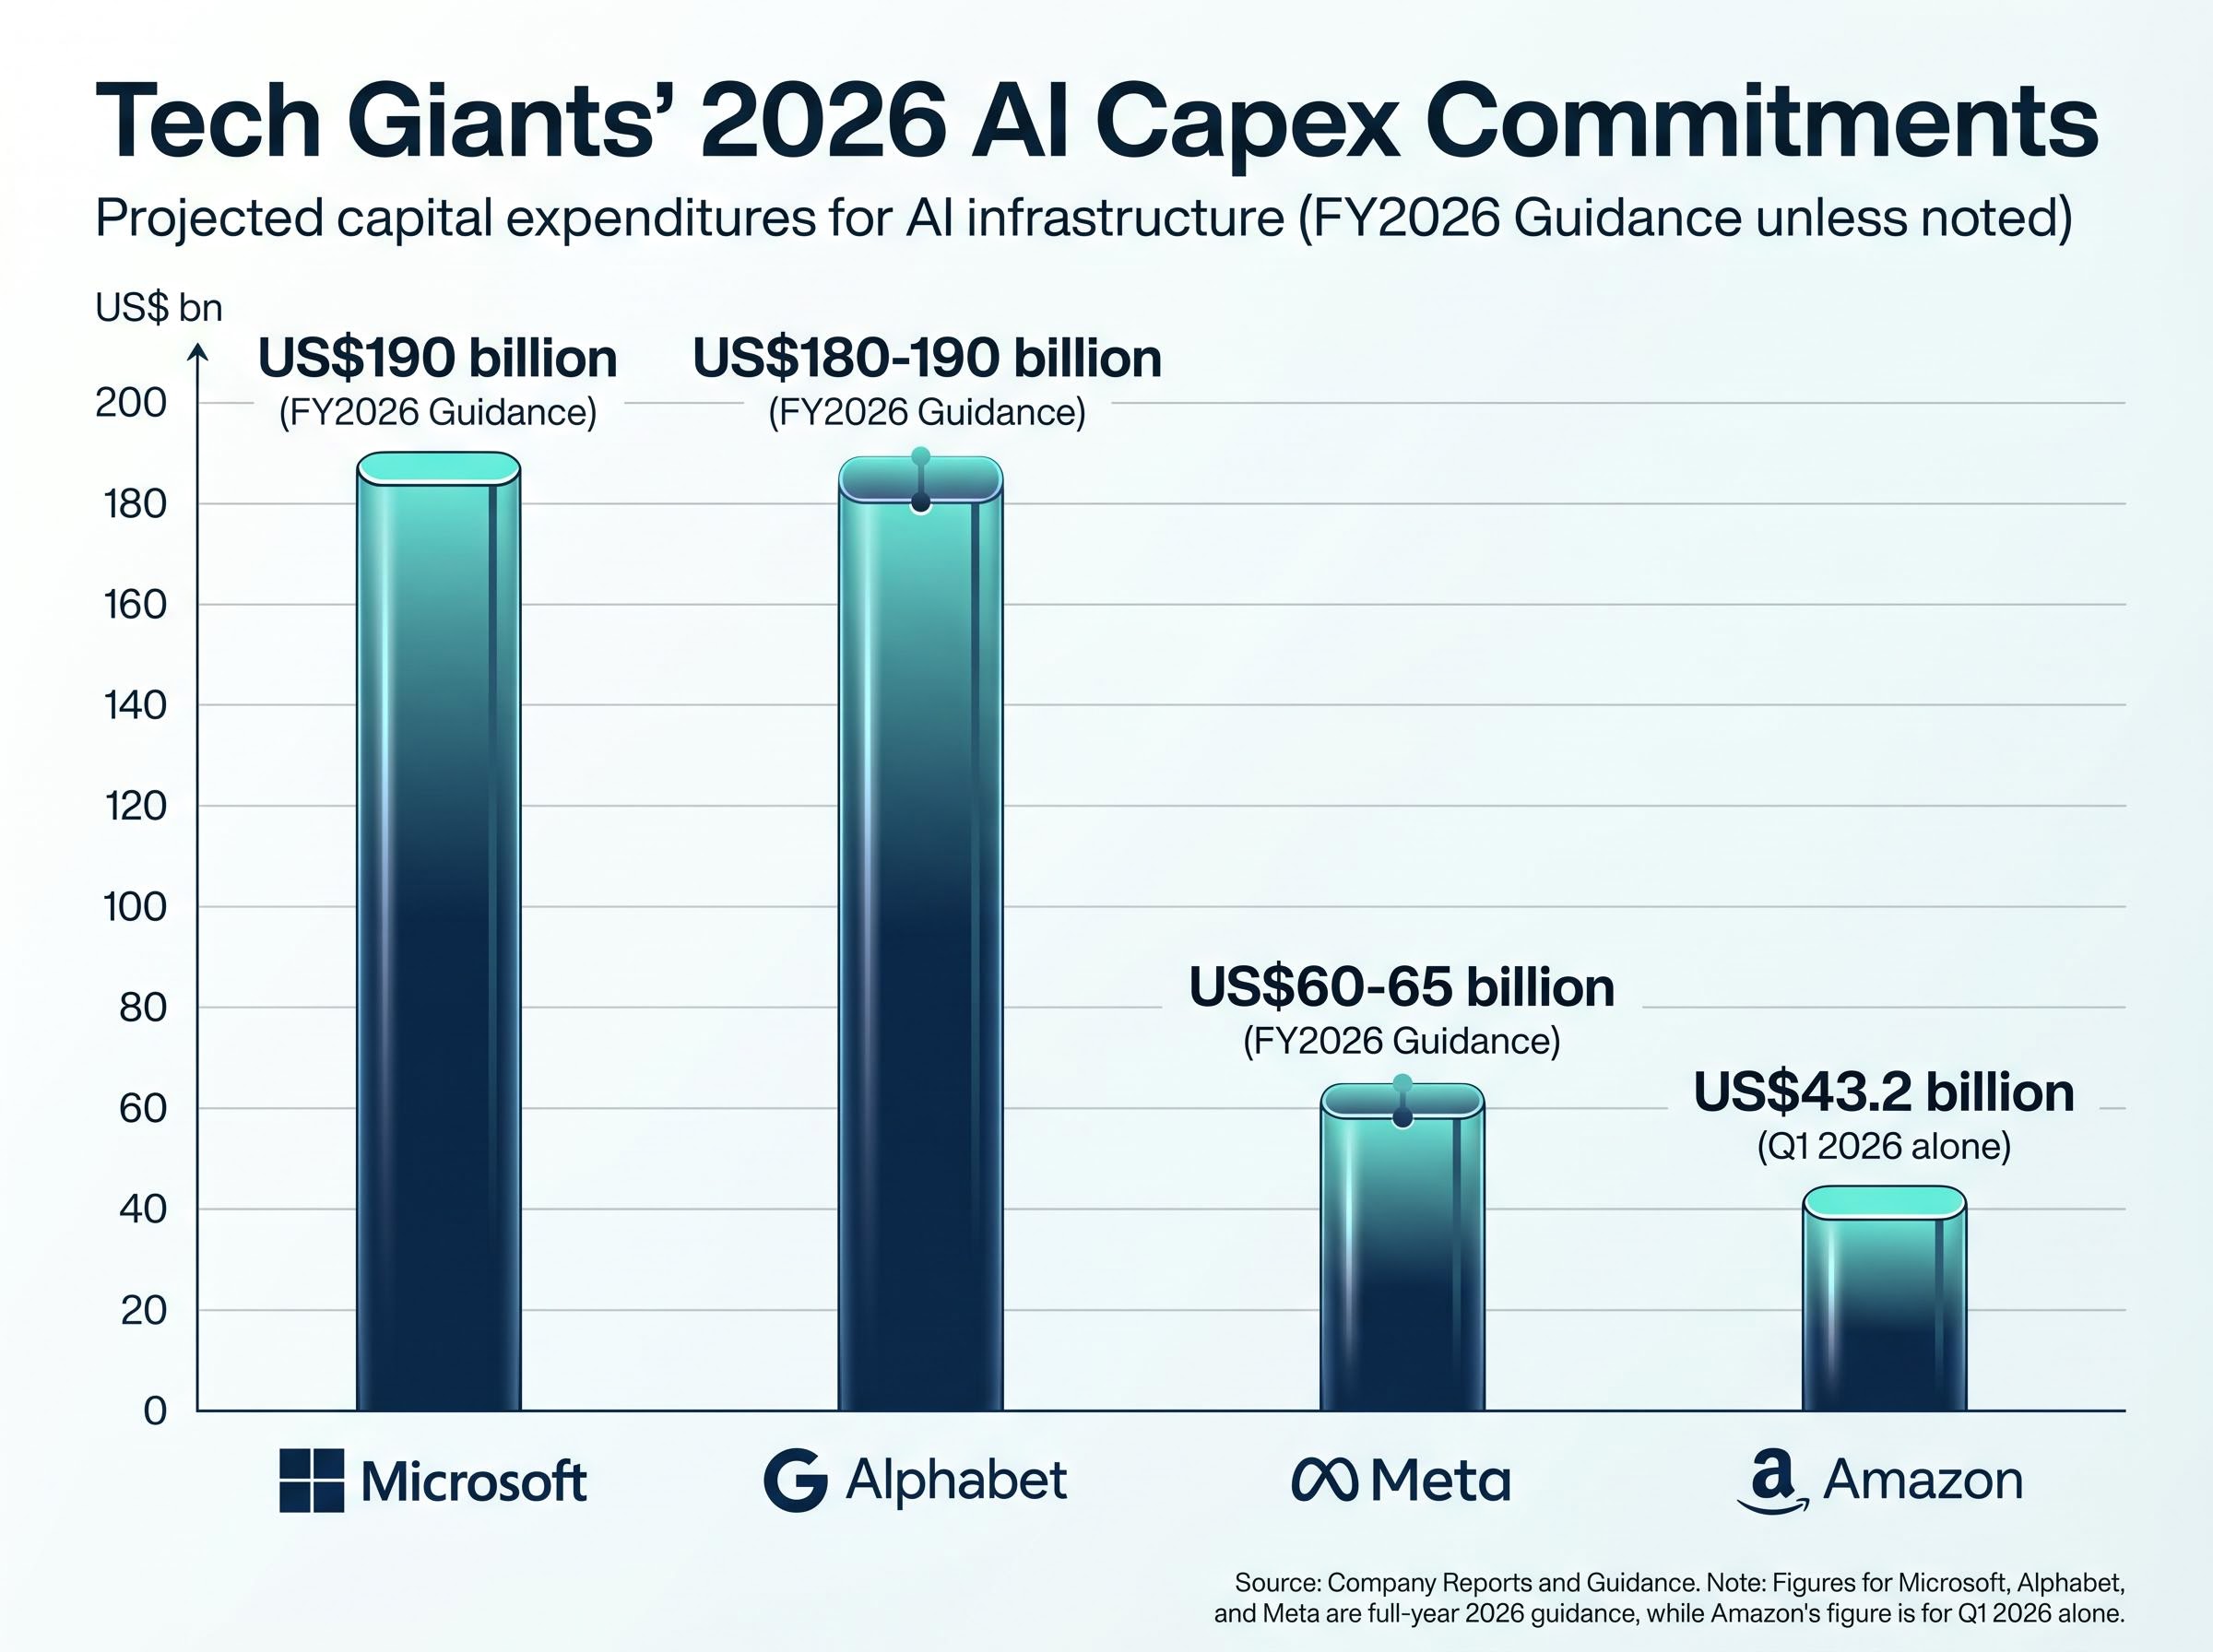
| Company | FY2026 Capex Guidance | YoY Change |
|---|---|---|
| Microsoft | US$190 billion | ~85% (Q3 FY2026) |
| Alphabet | US$180-190 billion | 2027 expected higher |
| Amazon | US$43.2 billion (Q1 alone) | AI/AWS primary allocation |
| Meta | US$60-65 billion | Feb 2026 guidance |
The combined Microsoft and Alphabet figures alone exceed the US$755 billion aggregate hyperscaler forecast that had been circulating in earlier estimates. The AI hardware cycle has been systematically underpriced at each revision point.
This spending is the demand engine behind ASX:SEMI, which returned approximately +34% in April 2026 (from roughly AU$23.71 to AU$31.82). The fund’s exposure to names such as NVIDIA, during its Blackwell chip ramp, and SK Hynix, which reportedly supplies approximately 60% of NVIDIA’s high-bandwidth memory (HBM) requirements, positioned it to capture the full force of the procurement wave. Samsung analyst forecasts suggest AI memory sales growth of approximately +150% for FY2026, though this figure should be treated as indicative rather than confirmed.
For Australian investors holding or considering ASX:SEMI, the reframing is significant. The underlying driver is not a cyclical semiconductor bounce. It is a multi-year, multi-hundred-billion-dollar corporate spending commitment that has been repeatedly underestimated by the market at each earnings cycle.
The hyperscaler capex trajectory extending into 2027 reinforces why SEMI’s April return is best understood as an instalment in a multi-year demand cycle rather than a single-quarter event; combined Q1 2026 spending across the four major cloud providers reached US$130 billion, with full-year 2026 guidance converging toward US$725 billion and early signals pointing to a US$1 trillion annual run rate in 2027.
What the Iran conflict actually did to energy and defence ETF sentiment
Brent crude traded at approximately US$107.97 per barrel as of 13 May 2026, with WTI at approximately US$101.23. Iranian proxy attacks on Saudi oil facilities around 10 May 2026 were the proximate catalyst for the elevated pricing. The immediate narrative, that geopolitical escalation drives energy higher, is intuitive. It is also incomplete.
The Strait of Hormuz remained open as of mid-May 2026. No blockade has been reported. A supply glut concern has been operating in parallel with the geopolitical premium, creating a tension that the headline oil price alone does not resolve.
- Geopolitical premium factors: Iranian proxy attacks on Saudi facilities; Brent above US$107; elevated tanker insurance costs
- Structural counterweights: Strait of Hormuz open; supply glut concerns persisting; no confirmed physical disruption to Gulf transit
One additional complication for Australian investors: the ASX:USE ticker cited in some market commentary does not correspond to a verified ASX-listed ETF. Any performance figures attributed to it should be disregarded. Direct ASX-accessible exposure to the energy price theme remains limited in the dedicated ETF wrapper.
Defence as a structural beneficiary, not a reactive trade
The defence sector saw a secondary uplift, with the iShares U.S. Aerospace and Defence ETF gaining approximately +3.5% week on week, and Boeing closing at US$238.86 on 13 May 2026. No dedicated ASX-listed defence ETF was confirmed as available.
The defence uplift is better understood as a structural consequence of geopolitical realignment across 2026 rather than a short-term fear trade. Australian investors seeking this exposure face product limitations; internationally listed aerospace and defence ETFs accessible via global brokers remain the practical route.
Why hydrogen surged, and what the budget fine print complicates
ASX:HGEN, the Global X Hydrogen ETF, returned approximately +20-25% in April 2026, rising from roughly AU$8.36 in early April to approximately AU$10.60-10.80 by month’s end. This corrected figure differs materially from inflated numbers circulating in some market commentary.
The genuine policy tailwinds were real. The US Department of Energy awarded approximately US$500 million to hydrogen hub projects around 5 May 2026. An EU electrolyser tender of approximately EUR1 billion reinforced the global commitment. Fortescue reported scaling its Pilbara green hydrogen project toward 2GW capacity in early May.
| Policy Actor | Measure | Direction |
|---|---|---|
| US DOE | ~US$500M hydrogen hub awards | Positive |
| EU | ~EUR1B electrolyser tender | Positive |
| Fortescue | Pilbara scaling toward 2GW | Positive |
| Australian Federal Budget | AU$1.5B hydrogen allocation | Mixed |
The AU$1.5 billion hydrogen allocation in the 2026-27 Australian federal budget, under the Future Made in Australia Act framework, halves previous programme spending for key renewable hydrogen initiatives. The straightforwardly bullish domestic policy narrative requires qualification.
That gap between HGEN’s April performance and the mixed domestic policy picture illustrates a recurring dynamic in thematic ETF investing. Global policy momentum can drive returns even when local conditions are more ambiguous. The same dependence on sentiment and cross-border policy signals, however, can reverse quickly if commitments stall or timelines extend.
The mechanics and risks of leveraged ETFs like LNAS
ASX:LNAS, the BetaShares NASDAQ 100 ETF (currency hedged, 3x leveraged), returned approximately +40.32% in April 2026. It was the single highest monthly return among widely held ASX ETFs.
That figure deserves context, not celebration. LNAS is a daily-rebalancing instrument, and the mechanics of leveraged compounding mean the monthly return does not simply equal three times the Nasdaq 100’s monthly performance. Three specific risk mechanics operate simultaneously:
- Daily rebalancing effect: The fund resets its leverage ratio each trading day, meaning multi-day returns diverge from the expected 3x multiple, sometimes materially.
- Volatility decay over time: In choppy markets where the index oscillates rather than trending, daily rebalancing erodes returns even if the index finishes flat over the period.
- Amplified drawdowns: A 15% Nasdaq drawdown would produce a substantially larger loss in a 3x leveraged position, as highlighted in Morningstar Australia commentary on leveraged product risk.
A 15% Nasdaq pullback, well within the range of normal corrections, would translate into a drawdown of roughly 45% or more in a 3x leveraged instrument, before accounting for volatility decay effects. The same mechanics that produced April’s gain operate with equal force in reverse.
Retail inflows into leveraged and thematic ETFs reportedly rose approximately +25% in April, coinciding with the strong performance period. Thematic ETFs including HGEN and SEMI carry histories of 50%+ drawdowns during risk-off periods, a benchmark that applies to the category broadly.
The behaviour gap in thematic ETF returns, where the time-weighted fund return and the money-weighted investor-experienced return diverge sharply due to poorly timed inflows near peak valuations, is the structural mechanism that makes April’s retail inflow surge into HGEN and SEMI worth watching closely; the ARKK case study showed a reported gain of approximately 233% coexisting with an estimated investor loss of approximately 35% across the same period.
What ASIC and product issuers say about suitability
Leveraged ETFs are not designed for buy-and-hold investors. Daily rebalancing effects compound differently from simple 3x leverage over multi-day periods, a distinction that product disclosure statements address explicitly. ASIC’s MoneySmart resources and BetaShares‘ own investor education materials are the appropriate starting points for any Australian retail investor considering LNAS-type exposure. The product’s April return was exceptional. The product’s risk profile has not changed.
ASIC’s regulatory guidance on leveraged ETFs establishes that instruments of this type are designed for short-term trading, noting explicitly that holding them beyond a single day makes it unlikely the fund will achieve its stated return multiple due to the path-dependency of daily resetting, a structural characteristic that applies directly to LNAS.
Three questions that separate April’s durable gains from the noise
April’s three performance stories, SEMI, HGEN, and LNAS, can be assessed through a single repeatable framework built on three questions.
| ETF | Is the driver structural? | Is policy accelerating? | Does the instrument suit a long-term horizon? |
|---|---|---|---|
| ASX:SEMI | Yes (multi-year capex) | Yes (spending rising) | Yes (unleveraged) |
| ASX:HGEN | Partially (global policy, mixed domestic) | Mixed | Yes (unleveraged, but volatile) |
| ASX:LNAS | Yes (AI cycle), but instrument distorts | N/A | No (daily rebalancing) |
The AI hardware capex cycle, backed by hyperscaler commitments ranging from US$60-65 billion (Meta) to US$180-190 billion (Alphabet), represents multi-year programme spending, not discretionary allocation. The Iran geopolitical premium is real but potentially transient if Hormuz tensions resolve. That contrast is the clearest example of the structural versus cyclical distinction this framework is designed to surface.
The outstanding macro uncertainty sits with the Strait of Hormuz. A prolonged closure, while not the base case, would reshape the global economic backdrop in ways that cut across all three themes simultaneously, compressing returns in sectors that depend on stable energy costs and shipping routes.
April 2026 as a case study in what thematic investing rewards, and what it punishes
April’s outsized returns in LNAS, SEMI, and HGEN each had identifiable structural foundations. Each also carried specific risks that the headline return number obscures. The approximately +40% leveraged Nasdaq gain and the approximately +34% semiconductor return were both expressions of the AI capex supercycle, yet one instrument is designed for multi-day holding and the other is not. The hydrogen return reflected genuine global policy momentum, yet the Australian budget fine print told a more complicated story.
Two questions should precede any thematic or leveraged ETF allocation: what is the underlying macro driver and is it durable, and does the instrument’s structure match the investor’s actual time horizon. AU$346 billion in FUM and AU$5 billion in monthly inflows confirm that Australian ETF investing has reached a scale where product literacy, not access, is the binding constraint for most retail investors.
For investors prompted by April’s returns to reconsider how much of their portfolio sits in thematic or leveraged products versus a diversified core, our comprehensive walkthrough of core ASX ETF portfolio construction covers the specific fee compounding effects, overlap risks from holding multiple thematic funds, and a model allocation using A200, VGS, and VHY with a combined weighted MER below 0.25%.
This article is for informational purposes only and should not be considered financial advice. Investors should conduct their own research and consult with financial professionals before making investment decisions. Past performance does not guarantee future results.
Readers seeking to evaluate specific thematic ETF exposure should consult the relevant product disclosure statements, ASIC MoneySmart guidance on complex products, and independent financial advice before acting on recent performance data.