
The Case for Copper and Battery Metals as Infrastructure Bets
5 hrs ago

Income investors who have long treated the big four bank shares as the default source of ASX dividend stocks are being asked to reconsider. Market Partners analysts James Gerrish and Shawn Hickman, presenting their FY27 outlook in a recent webinar, made the case that insurance stocks now represent the superior yield vehicle within the ASX financials sector. The call is not a wholesale exit from banks. Market Partners continues to hold ANZ Group Holdings and Westpac Banking Corp, but maintains an underweight on bank stocks overall, arguing that insurers offer a better risk-adjusted income proposition heading into the new financial year. What follows unpacks the three structural reasons behind that view, compares the actual yield numbers across the major banks and key insurers, and gives income-focused investors a practical framework for thinking about their own financials allocation.
The distinction matters. Market Partners is not arguing that Australian banks are impaired, overvalued, or incapable of delivering dividends. The firm is making a relative call: within the financials sleeve of an income portfolio, insurer dividends currently offer more per unit of risk than bank dividends.
Gerrish and Hickman characterised investing as “a relative exercise,” framing the preference for insurers as a reflection of where capital works hardest rather than where capital should flee.
That framing shapes everything that follows. Market Partners retains positions in ANZ and Westpac, which signals a calibrated tilt, not a contrarian bet. The central question the rest of this analysis answers is straightforward: if an investor wants financials exposure for dividend income, where does capital currently earn the most reliable return?
The answer, for now, sits with insurers. The next four sections explain why.
Before evaluating whether the insurer yield advantage is structurally earned or a temporary artefact of pricing, the raw numbers need to be on the table.
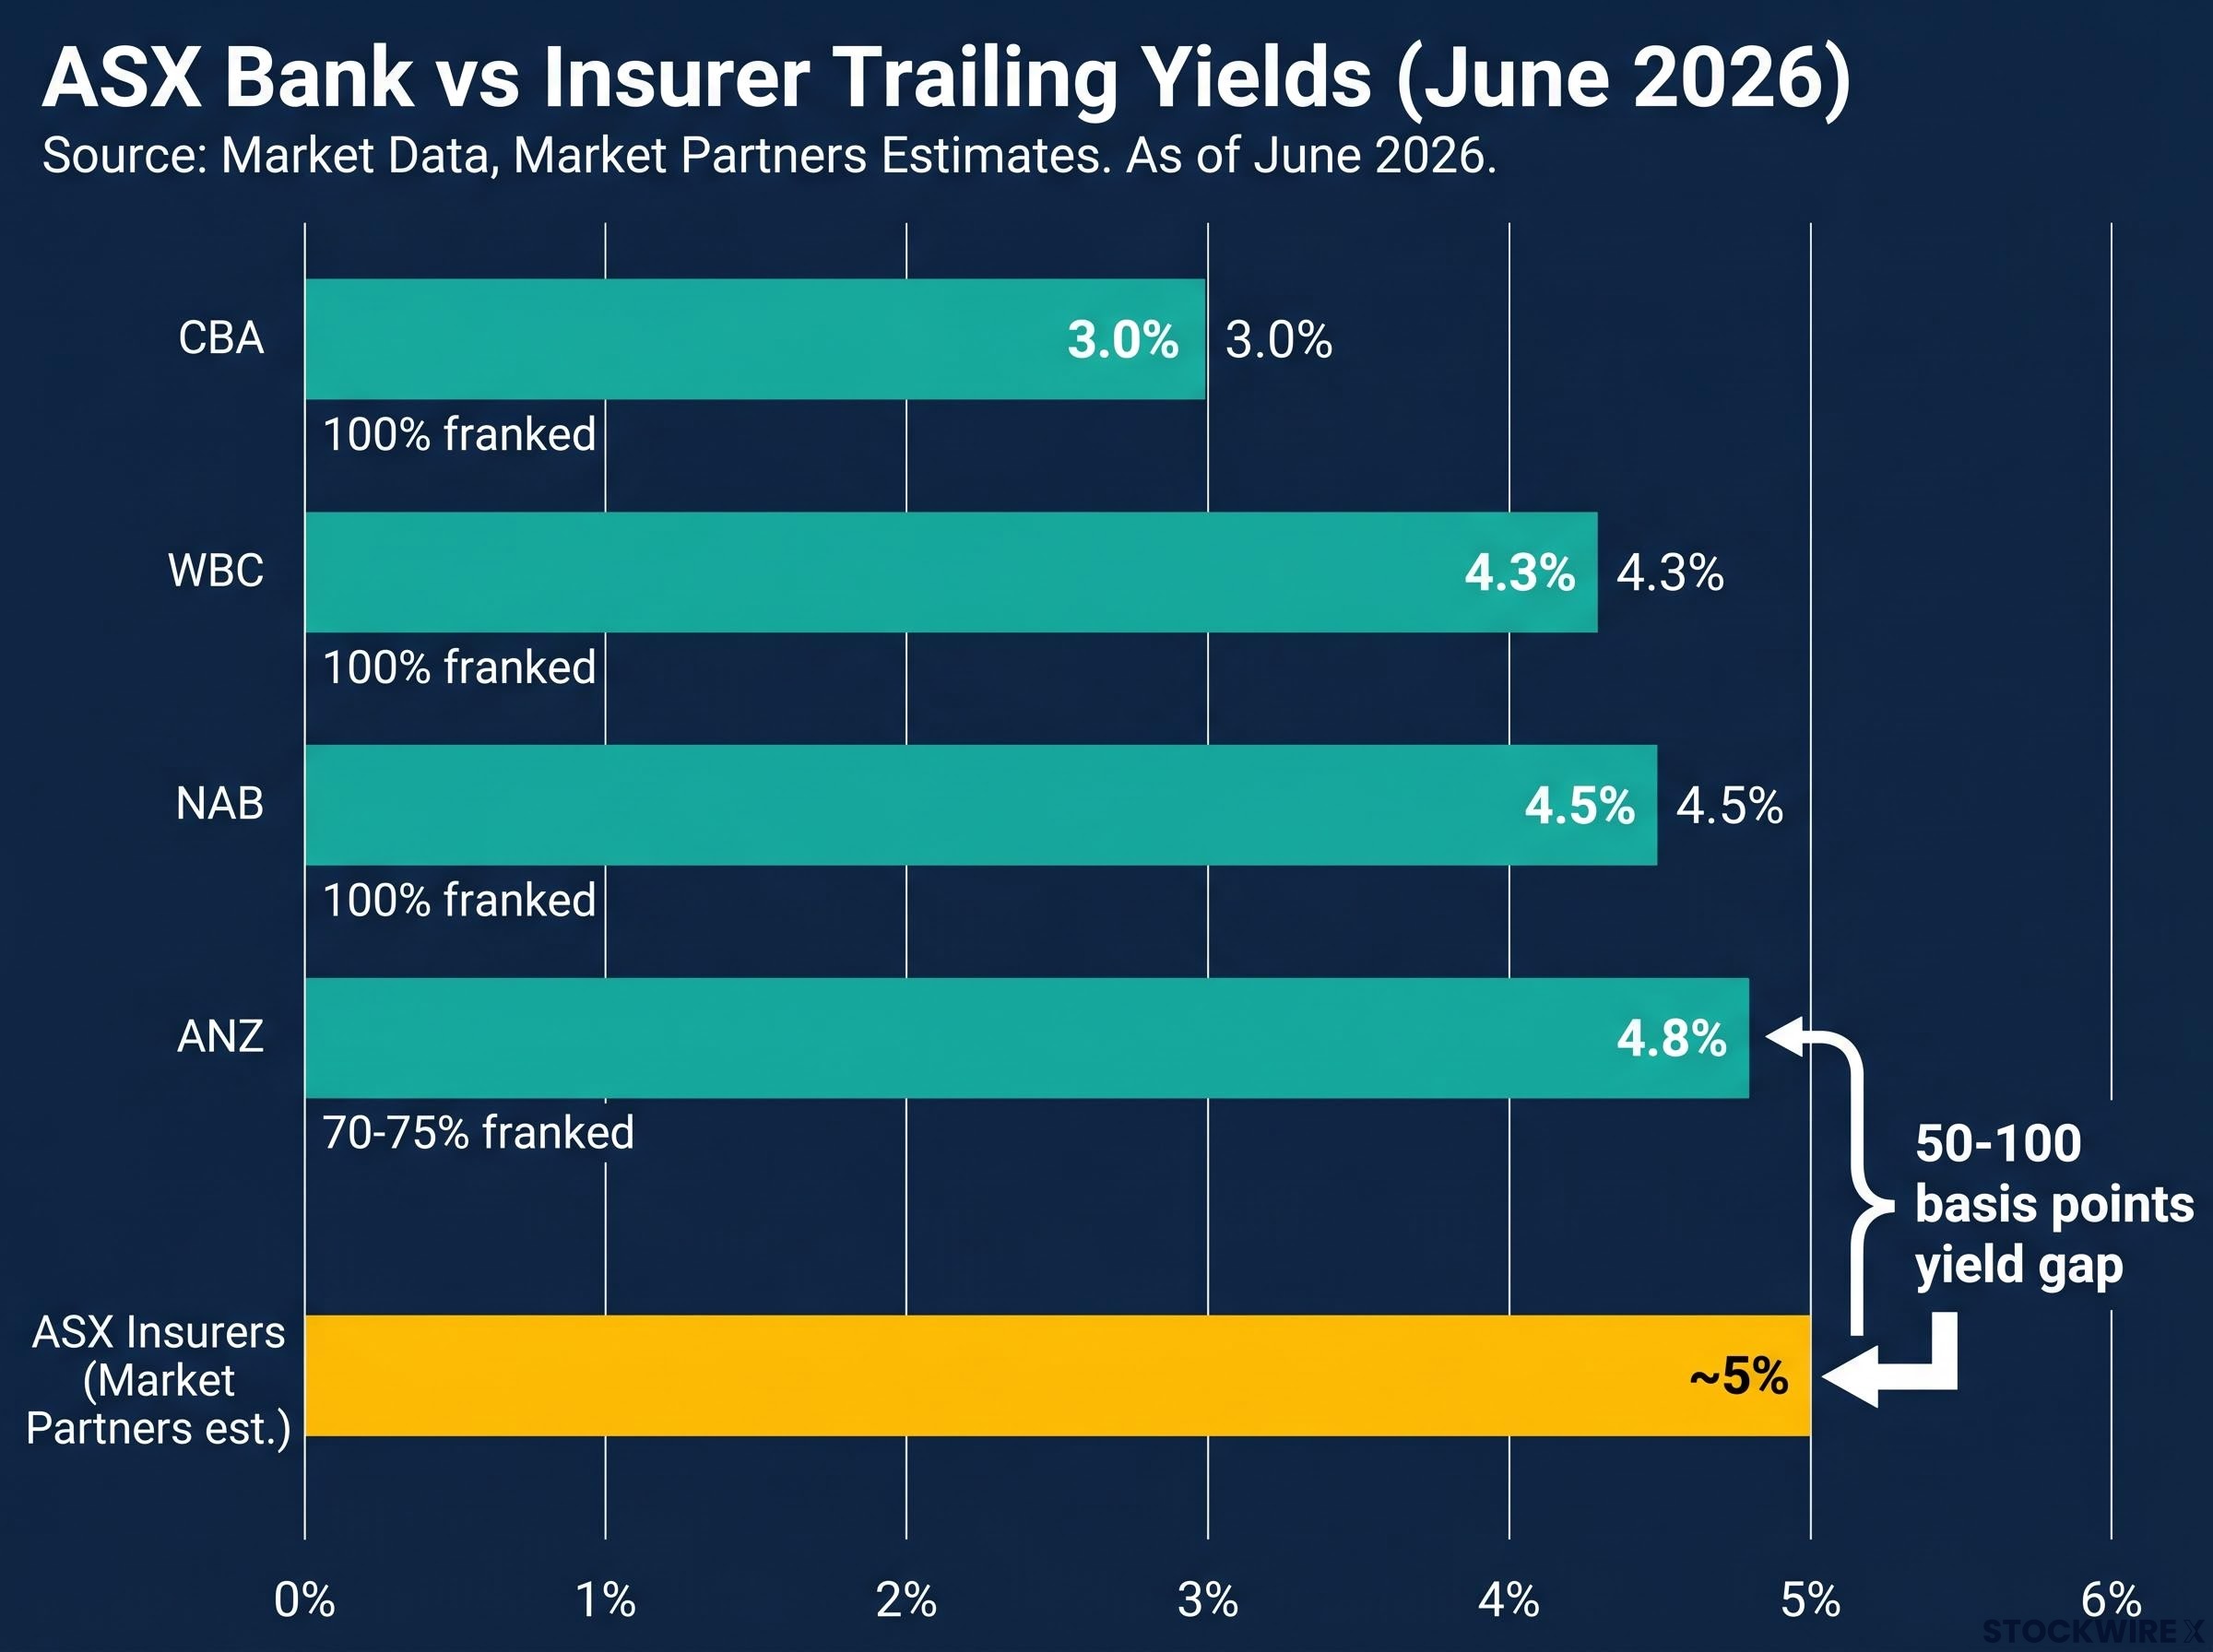
| Security | Trailing yield | Franking | Notes |
|---|---|---|---|
| CBA | 3.0% | 100% | Lowest yielding of the big four |
| NAB | 4.5% | 100% | As of June 2026 |
| ANZ | 4.8% | 70-75% | Partially franked |
| WBC | 4.3% | 100% | As of June 2026 |
| ASX insurers (Market Partners est.) | ~5% | Varies by name | Compared to mid-4% for banks |
Bank trailing yield data sourced from The Motley Fool Australia, current as of June 2026. Insurer yield estimate from Market Partners’ FY27 webinar.
The implied gap is 50-100 basis points in favour of insurers. On its own, that premium is modest. Franking complicates the comparison further: the big four (excluding ANZ at 70-75%) are fully franked, meaning grossed-up yields for Australian taxpayers and superannuation funds are materially higher than the headline rate. Many insurers, including Suncorp, also offer franking, but levels and consistency vary more across names.
Franking complicates the yield comparison in ways the headline numbers obscure: grossed-up ASX dividend yields for investors on the 30% tax rate or in a superannuation fund can be materially higher than the cash rate suggests, which matters significantly when weighing partially franked insurer income against fully franked bank distributions.
ASX insurer yields for Suncorp, QBE, and IAG are noted as sitting in the approximate 4-5% range, though these figures have not been independently verified in this analysis.
The yield gap alone does not justify a portfolio shift. What matters is whether it is durable, and that depends on two structural factors the following sections address.
The 50-100 basis point yield premium is not random pricing noise. It reflects a structural earnings asymmetry between the two subsectors, rooted in how each one interacts with the interest rate cycle.
When the Reserve Bank of Australia began raising rates, bank margins expanded quickly. That phase is over. Deposit competition intensified as customers moved savings into higher-yielding accounts, and borrowers refinanced onto more competitive home loan rates. From here, the rate cycle is more likely to act as a headwind or neutral force for bank margins rather than a fresh source of earnings growth.
The APRA quarterly ADI statistics for the December 2025 quarter confirm the competitive margin pressure narrative, showing that deposit competition and refinancing activity have weighed on net interest margins across the major authorised deposit-taking institutions.
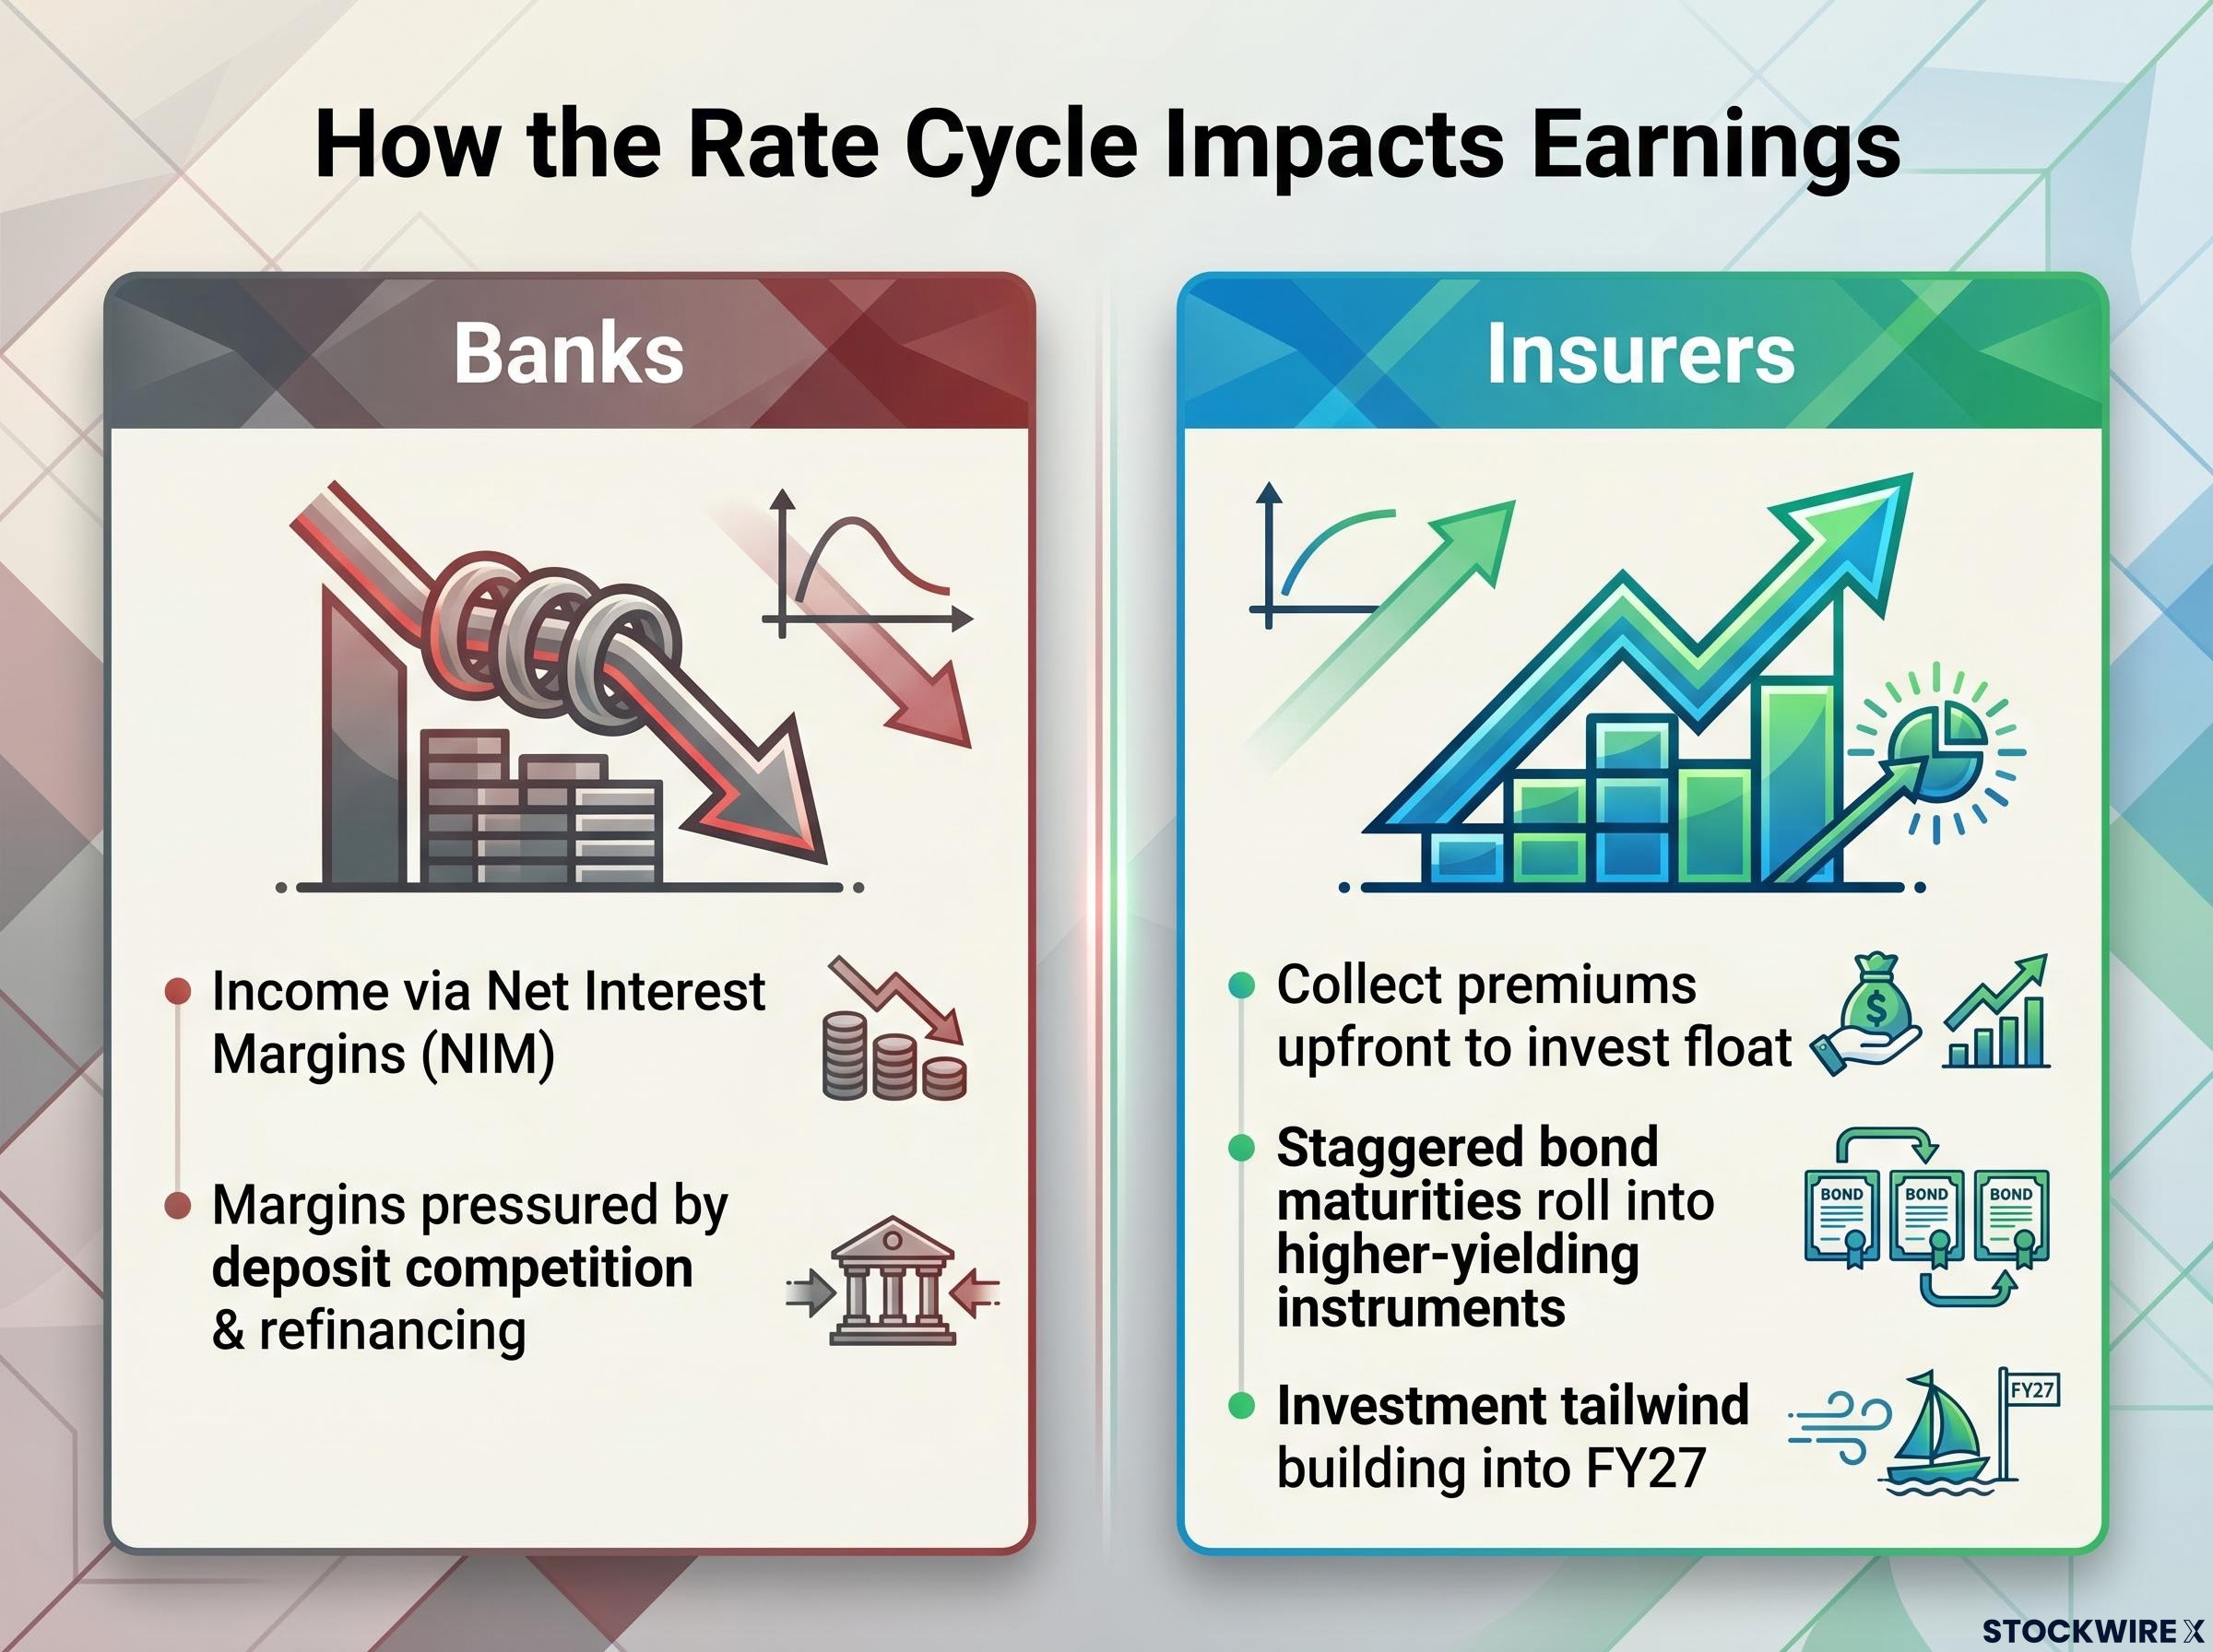
Insurers operate on a different timeline. A large proportion of their investment portfolios sits in long-duration bonds with staggered maturities. As those bonds mature, capital is reinvested at today’s higher prevailing rates. The full benefit of the past two years of rate rises is still flowing through insurer profit and loss statements, and that tailwind will likely continue building into FY27.
This is the mechanical reason the yield premium looks earned rather than stretched. Insurers’ payout capacity is being underpinned by an investment income tailwind that has not fully peaked, whereas much of the corresponding bank benefit has already been passed through.
Investment income from the bond portfolio is only half the insurer earnings picture. The other half, underwriting, tells an equally constructive story for FY27.
Over the preceding three to four years, the Australian insurance sector absorbed elevated catastrophe losses, inflation-driven claims cost blowouts, and tight reinsurance markets. In response, insurers repriced aggressively: premiums rose, policy terms tightened, and risk was re-underwritten to reflect higher claims costs and catastrophe exposure.
That repricing has now flowed through the income line. Claims experience has reverted toward more normal levels after a difficult stretch, and the current environment features disciplined pricing alongside a more benign claims period. The combination supports stable to rising underwriting margins, which in turn supports dividend stability.
QBE’s underwriting profitability, measured by a combined operating ratio of 93.1% against a 50% payout ratio sitting within management’s own target range, illustrates how the two insurer earnings drivers this article identifies, disciplined underwriting and investment income growth, are reinforcing each other at the individual stock level rather than just at the sector level.
FY27 is being approached from a position of reset strength rather than ongoing recovery, with premium repricing already embedded and claims volatility currently more benign than in recent years.
Three persistent risks remain and deserve attention:
These are real constraints. But the insurer thesis is not a single-factor bet on investment income. It is a convergence: the rate tailwind and the disciplined underwriting environment are reinforcing each other simultaneously, creating a broader earnings base to support dividends.
Choosing between bank and insurer dividends is not purely a yield comparison. It is also a question about what kind of risk an income portfolio carries into an uncertain macroeconomic environment.
Bank dividend risk drivers:
Insurer dividend risk drivers:
The distinction is structural. Bank earnings are tightly coupled to the domestic economic cycle: GDP growth, employment, housing prices, and consumer confidence all feed directly into loan volumes and credit quality. Insurer earnings, by contrast, are driven more by weather patterns, accident frequency, and legal trends than by the direction of GDP.
Many insurance policies, including home, motor, compulsory third-party, and certain business covers, are contractual or effectively mandatory. Customers may increase excesses or shop around during a downturn, but outright cancellation of core cover is comparatively rare. That makes premium revenue more stable across the cycle than bank loan volumes.
Insurers are not defensive in the way utilities are. But for an income investor who relies on dividends to fund living expenses or portfolio withdrawals, the insurer mix reduces concentration of macro risk inside the financials bucket rather than doubling down on the same economic exposure that bank dividends carry.
The distinction between bank and insurer dividend risk maps closely onto the broader framework of cyclical and defensive allocation, where the practical goal is not to hold only one type but to calibrate how much macro-cycle exposure sits inside each sector bucket at a given point in the economic cycle.
The analytical case rests on three compounding advantages, each independently meaningful but more compelling in combination:
Market Partners’ current positioning reflects this framework in practice: retain ANZ and Westpac for diversification and long-term income, but incrementally favour quality insurers, including Suncorp, IAG, QBE, Medibank, and nib (depending on mandate and risk tolerance), as the marginal source of dividend yield heading into FY27.
The conditions that would make this thesis worth revisiting include:
This is a sector-level framework, not a specific securities recommendation. Individual decisions should account for risk tolerance, tax position (particularly franking benefits for Australian taxpayers and super funds), time horizon, and the specific holdings already in the portfolio.
This article is for informational purposes only and should not be considered financial advice. Investors should conduct their own research and consult with financial professionals before making investment decisions.
Market Partners’ thesis is not a bold contrarian call. It is a calibrated, evidence-based tilt built on observable data: insurers offer modestly more yield, with better earnings momentum from the rate cycle, and less exposure to the macro risks most likely to materialise in FY27.
Bank shares remain valid income holdings. The big four are not impaired, and their dividends continue to be supported by strong capital positions. The case rests entirely on relative attractiveness, not absolute weakness.
The margin of safety for insurer dividends looks wider than for bank dividends at this point in the cycle.
This is also a window-of-opportunity argument. The investment income tailwind from bond portfolio rollovers and the disciplined underwriting environment are conditions that will eventually normalise. Rate cuts, if they accelerate, will compress the investment income advantage. A return to elevated catastrophe losses would pressure underwriting margins. FY27 represents a period where both tailwinds are active simultaneously, making the relative case for insurers within an ASX income portfolio as clear as it has been in recent years.
For investors wanting to track when the conditions underpinning the insurer thesis begin to deteriorate, our full explainer on sector rotation signals covers the business cycle phases, Relative Rotation Graph mechanics, and fund flow data that institutional allocators use to identify when capital is beginning to move out of a sector ahead of the official economic data confirming the shift.
Past performance does not guarantee future results. Financial projections are subject to market conditions and various risk factors.
ASX dividend stocks are shares listed on the Australian Securities Exchange that pay regular income distributions to shareholders. Market Partners analysts currently favour ASX insurer dividends over bank dividends, citing a yield premium of approximately 50-100 basis points and stronger earnings momentum heading into FY27.
Insurer yields are being lifted by two reinforcing tailwinds: investment income from bond portfolios rolling into higher prevailing rates, and disciplined underwriting margins following aggressive premium repricing over the past three to four years. Banks, by contrast, have largely seen their rate-cycle benefit peak as deposit competition and refinancing pressure eroded net interest margins.
Most of the big four banks, with the exception of ANZ which is 70-75% franked, pay fully franked dividends, which meaningfully boosts the grossed-up yield for Australian taxpayers and superannuation funds. Insurer franking levels vary by name, so investors should compare grossed-up yields rather than headline cash rates when evaluating income from each subsector.
Market Partners names Suncorp, IAG, QBE, Medibank, and nib as the insurers it incrementally favours as a marginal source of dividend yield, while retaining ANZ and Westpac for diversification and long-term income within a financials allocation.
The three key risks identified are a sharp rate-cutting cycle compressing insurer investment income faster than expected, a renewed spike in catastrophe losses or claims cost inflation eroding underwriting margins, and a significant re-rating of bank valuations that shifts the yield relationship back in favour of the big four.