Ceasefires Won’t Clear Geopolitical Risk, BCA Research Warns
4 mins ago


ANZ reported 14% underlying cash profit growth for its half-year to March 2026, delivering $3.78 billion in cash earnings. Then it held its interim dividend flat at 83 cents per share. The stock fell roughly 3.6% on announcement day, closing at $35.61 on 1 May before recovering slightly to $35.78 by the end of the following session. For income-focused investors, the disconnect between surging profit and a static payout raises a pointed question: is ANZ conserving capital by design, or is the dividend growth story losing momentum? With FY26 and FY27 analyst forecasts now in hand, the forward numbers offer a clearer reading than the half-year result alone. What follows is an assessment of what the interim result signals, how ANZ’s grossed-up yield compares with Big Four peers, and where the genuine risks sit for investors treating the stock as a core income holding.
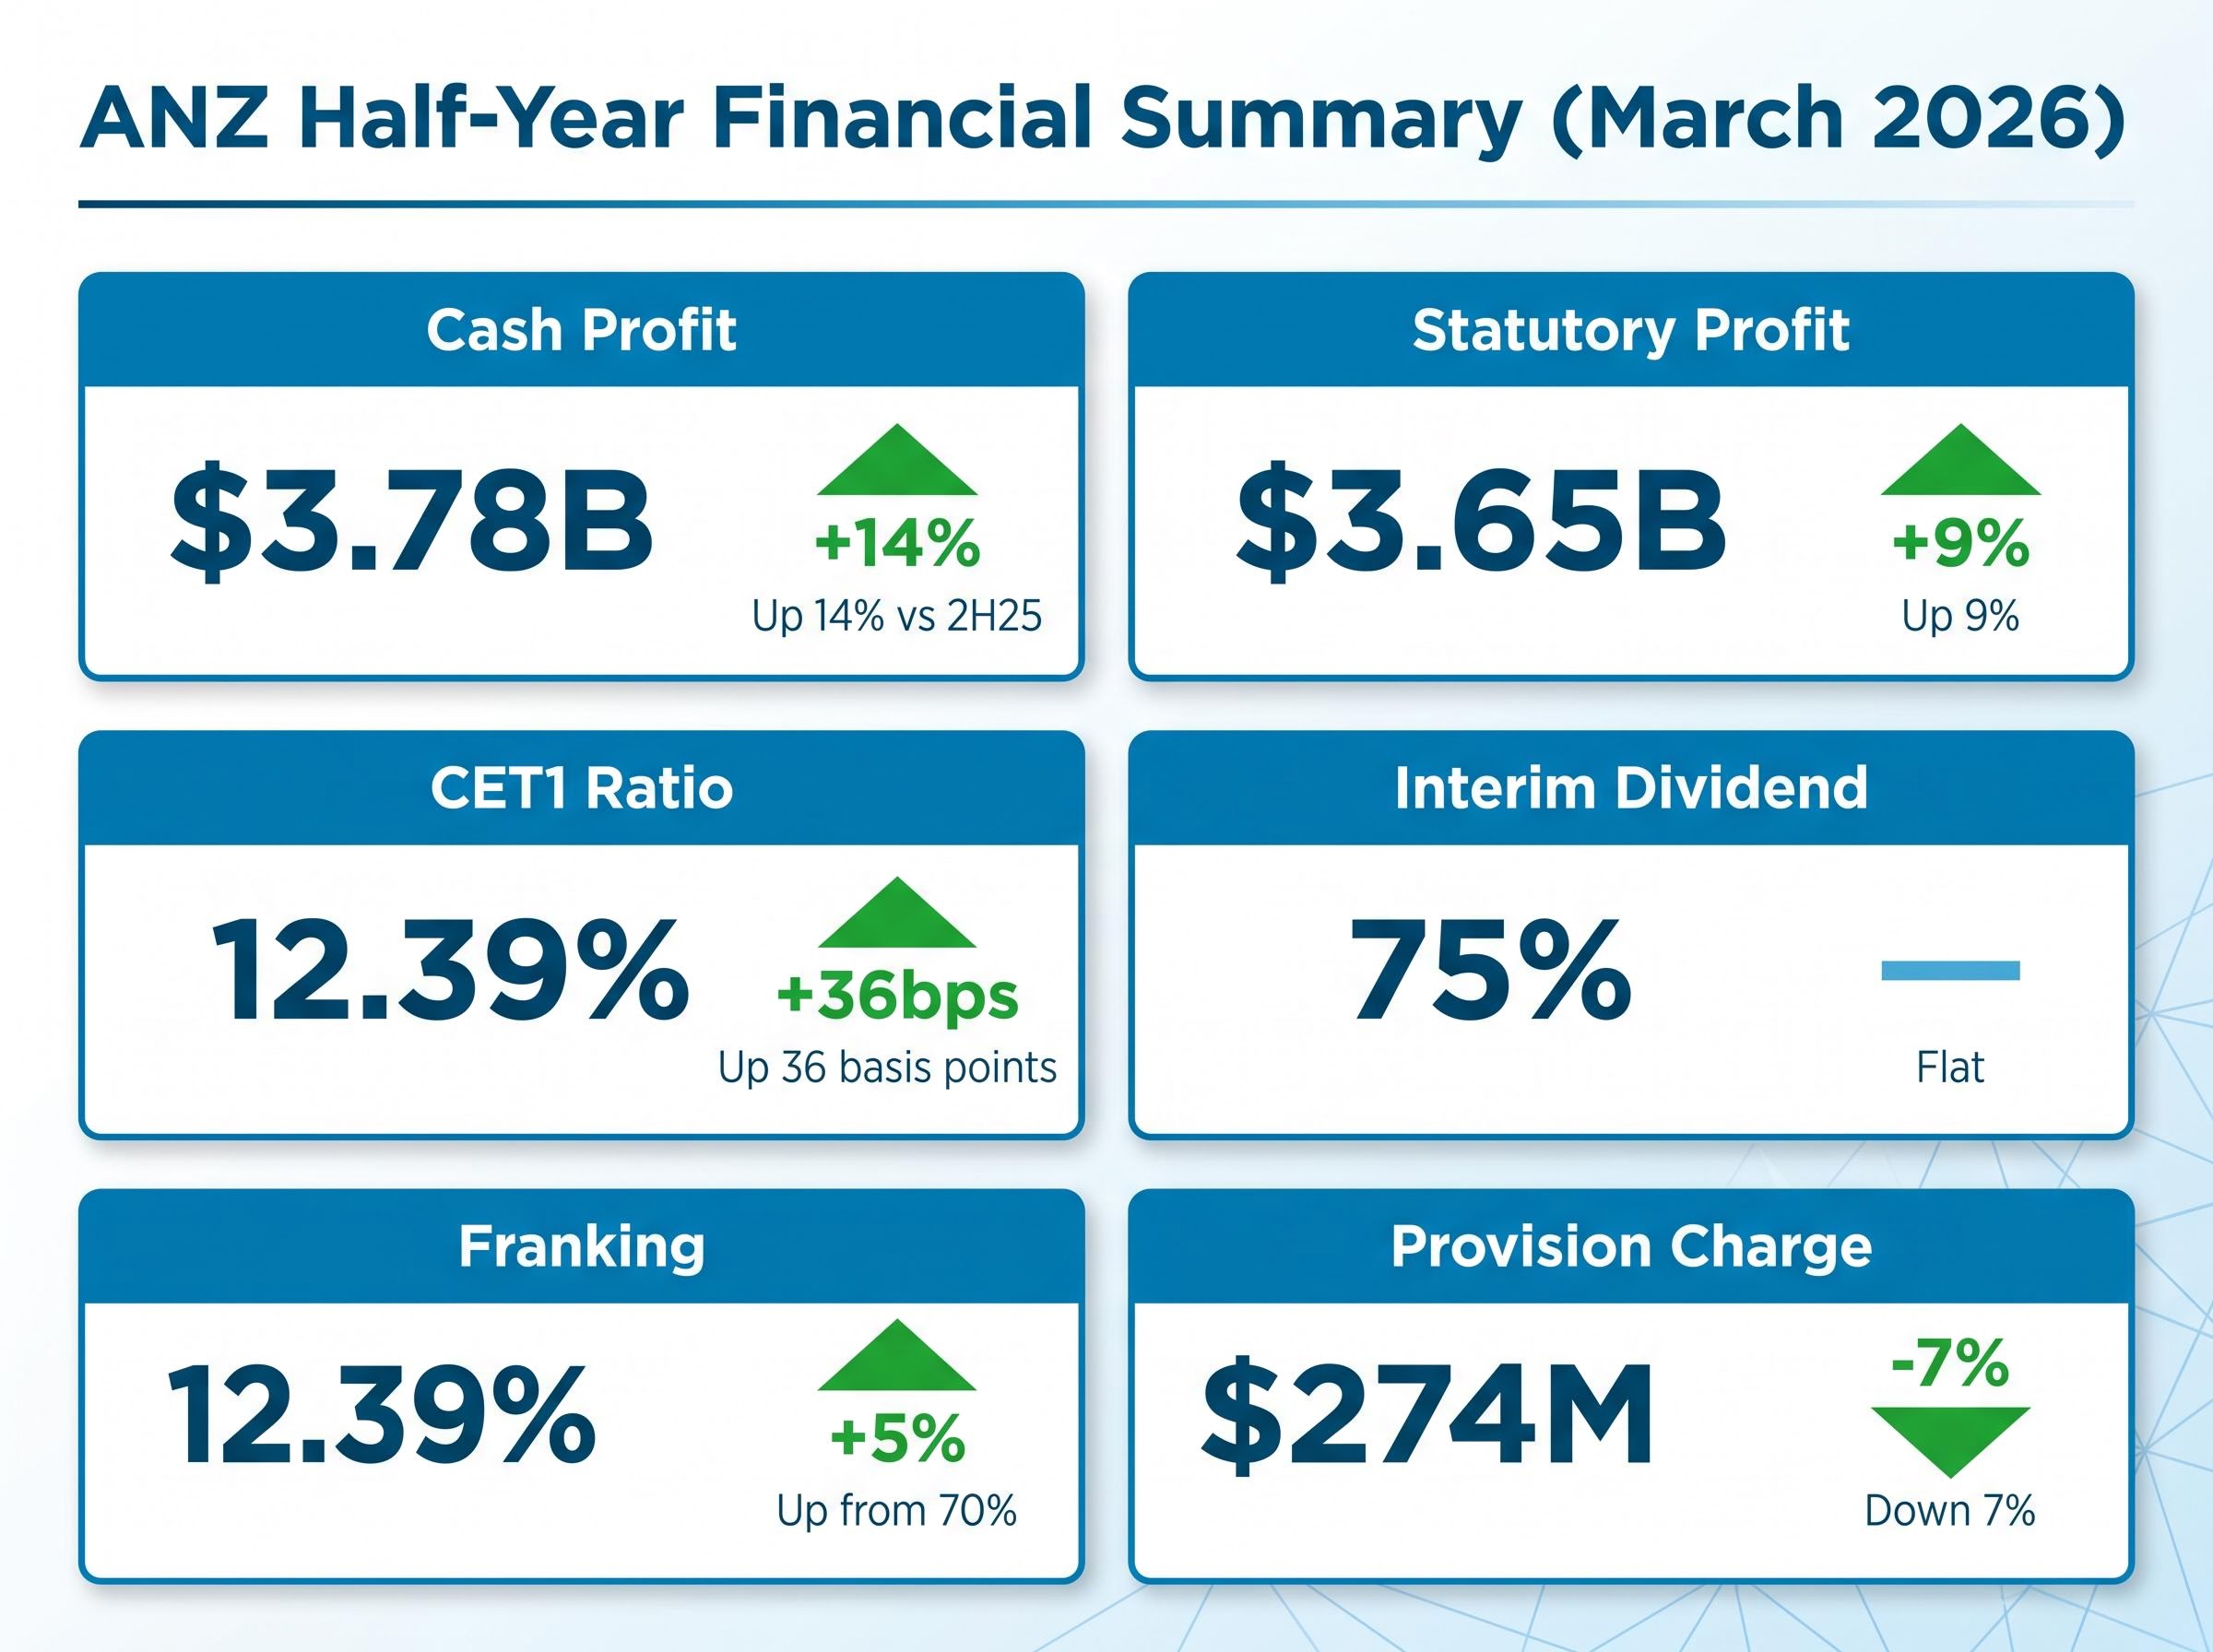
The headline numbers made the flat dividend harder to ignore. Cash profit of $3.78 billion came in 14% above the second half of FY25, while statutory profit reached $3.65 billion, representing a 9% increase on a statutory net basis. Provision charges fell 7% to $274 million, suggesting credit quality held up through the half.
Yet the interim dividend stayed at 83 cents, unchanged from the prior corresponding period.
The capital position provides context. ANZ’s Common Equity Tier 1 (CET1) ratio, which measures the bank’s core capital relative to its risk-weighted assets, rose 36 basis points to 12.39%. Management neutralised the dividend reinvestment plan through on-market share purchases rather than issuing new equity, a move that protects existing shareholders from dilution. Franking lifted from 70% to 75%, delivering a meaningful after-tax income improvement without raising the nominal payout.
The ANZ half-year results for 1H FY2026 also revealed that operating expenses fell 22% to $5,534 million, pushing the cost-to-income ratio through the sub-50% threshold that Australian major banks have long targeted, a structural improvement that supports the earnings durability case underlying the dividend outlook.
Key half-year metrics at a glance:
“Current capital levels are appropriate.” — ANZ management commentary, FY26 half-year results
Taken together, the result reads less like a dividend warning and more like deliberate capital management: profit growth banked, balance sheet strengthened, and income investors partially compensated through improved franking rather than a higher nominal distribution.
Raw dividend yield is the number most screening tools display. For Australian-resident investors, it is also the wrong number to anchor on.
Franking credits exist because company profits are taxed at the corporate level before dividends are paid. When a dividend is franked, eligible shareholders receive a credit for the tax already paid, which either reduces their personal tax liability or generates a refund. At 75% franking, three-quarters of ANZ’s interim dividend carried that credit attached.
The ATO franking credit rules govern which shareholders are eligible to claim imputation credits and under what conditions a refund applies, criteria that determine whether Australian investors in accumulation or pension phase can fully realise the grossed-up yield advantage described above.
The practical effect is that the yield an eligible Australian investor actually receives, after accounting for the credit, is materially higher than the headline figure.
Using the FY26 full-year dividend forecast of $1.68 per share (sourced from CommSec) and ANZ’s 4 May closing price of $35.78:
The franking uplift from 70% to 75% is not cosmetic. On a $50,000 ANZ holding, the difference adds roughly $150-$200 in annual franking credit value. For investors in the accumulation or pension phase, the grossed-up yield is the figure that determines real income return.
Consensus forecasts position ANZ’s dividend on a modest but credible growth path, underpinned by rising earnings per share rather than an expanding payout ratio.
| Financial Year | Dividend Forecast | EPS Forecast | Raw Yield | Grossed-Up Yield |
|---|---|---|---|---|
| FY26 | $1.68 | $2.54 | ~4.69% | ~6.0% |
| FY27 | $1.72 | $2.63 | ~4.8% | ~6.1% |
The implied FY26 payout ratio sits at approximately 66% ($1.68 / $2.54), comfortably below the 70-75% threshold that typically signals payout stress in Australian banking. By FY27, EPS is forecast to grow to $2.63, supporting a modest lift to $1.72 per share in dividends while holding the payout ratio steady.
This is incremental growth, not a step-change. It aligns with the capital-cautious posture ANZ signalled at the half-year: earnings capacity is expanding, but management appears content to retain flexibility rather than chase headline dividend increases. For income investors, the sub-70% payout ratio means there is headroom to maintain the dividend even if earnings growth moderates, a buffer that matters in a rate-sensitive environment. ANZ trades at approximately 14 times FY26 estimated earnings, a valuation that does not appear to price in aggressive dividend acceleration.
| Bank | FY26 Dividend Forecast | Share Price | Raw Yield | Grossed-Up Yield |
|---|---|---|---|---|
| ANZ | $1.68 | $35.78 | ~4.69% | ~6.0% |
| CBA | $5.25 | $172.21 | ~3.05% | ~4.4% |
| Westpac | $1.58 | $38.58 | ~4.09% | ~5.8% |
| NAB | $1.73 | $39.20 | ~4.41% | ~6.3% |
Forecasts sourced from Motley Fool Australia and CommSec. Yields calculated using latest available closing prices.
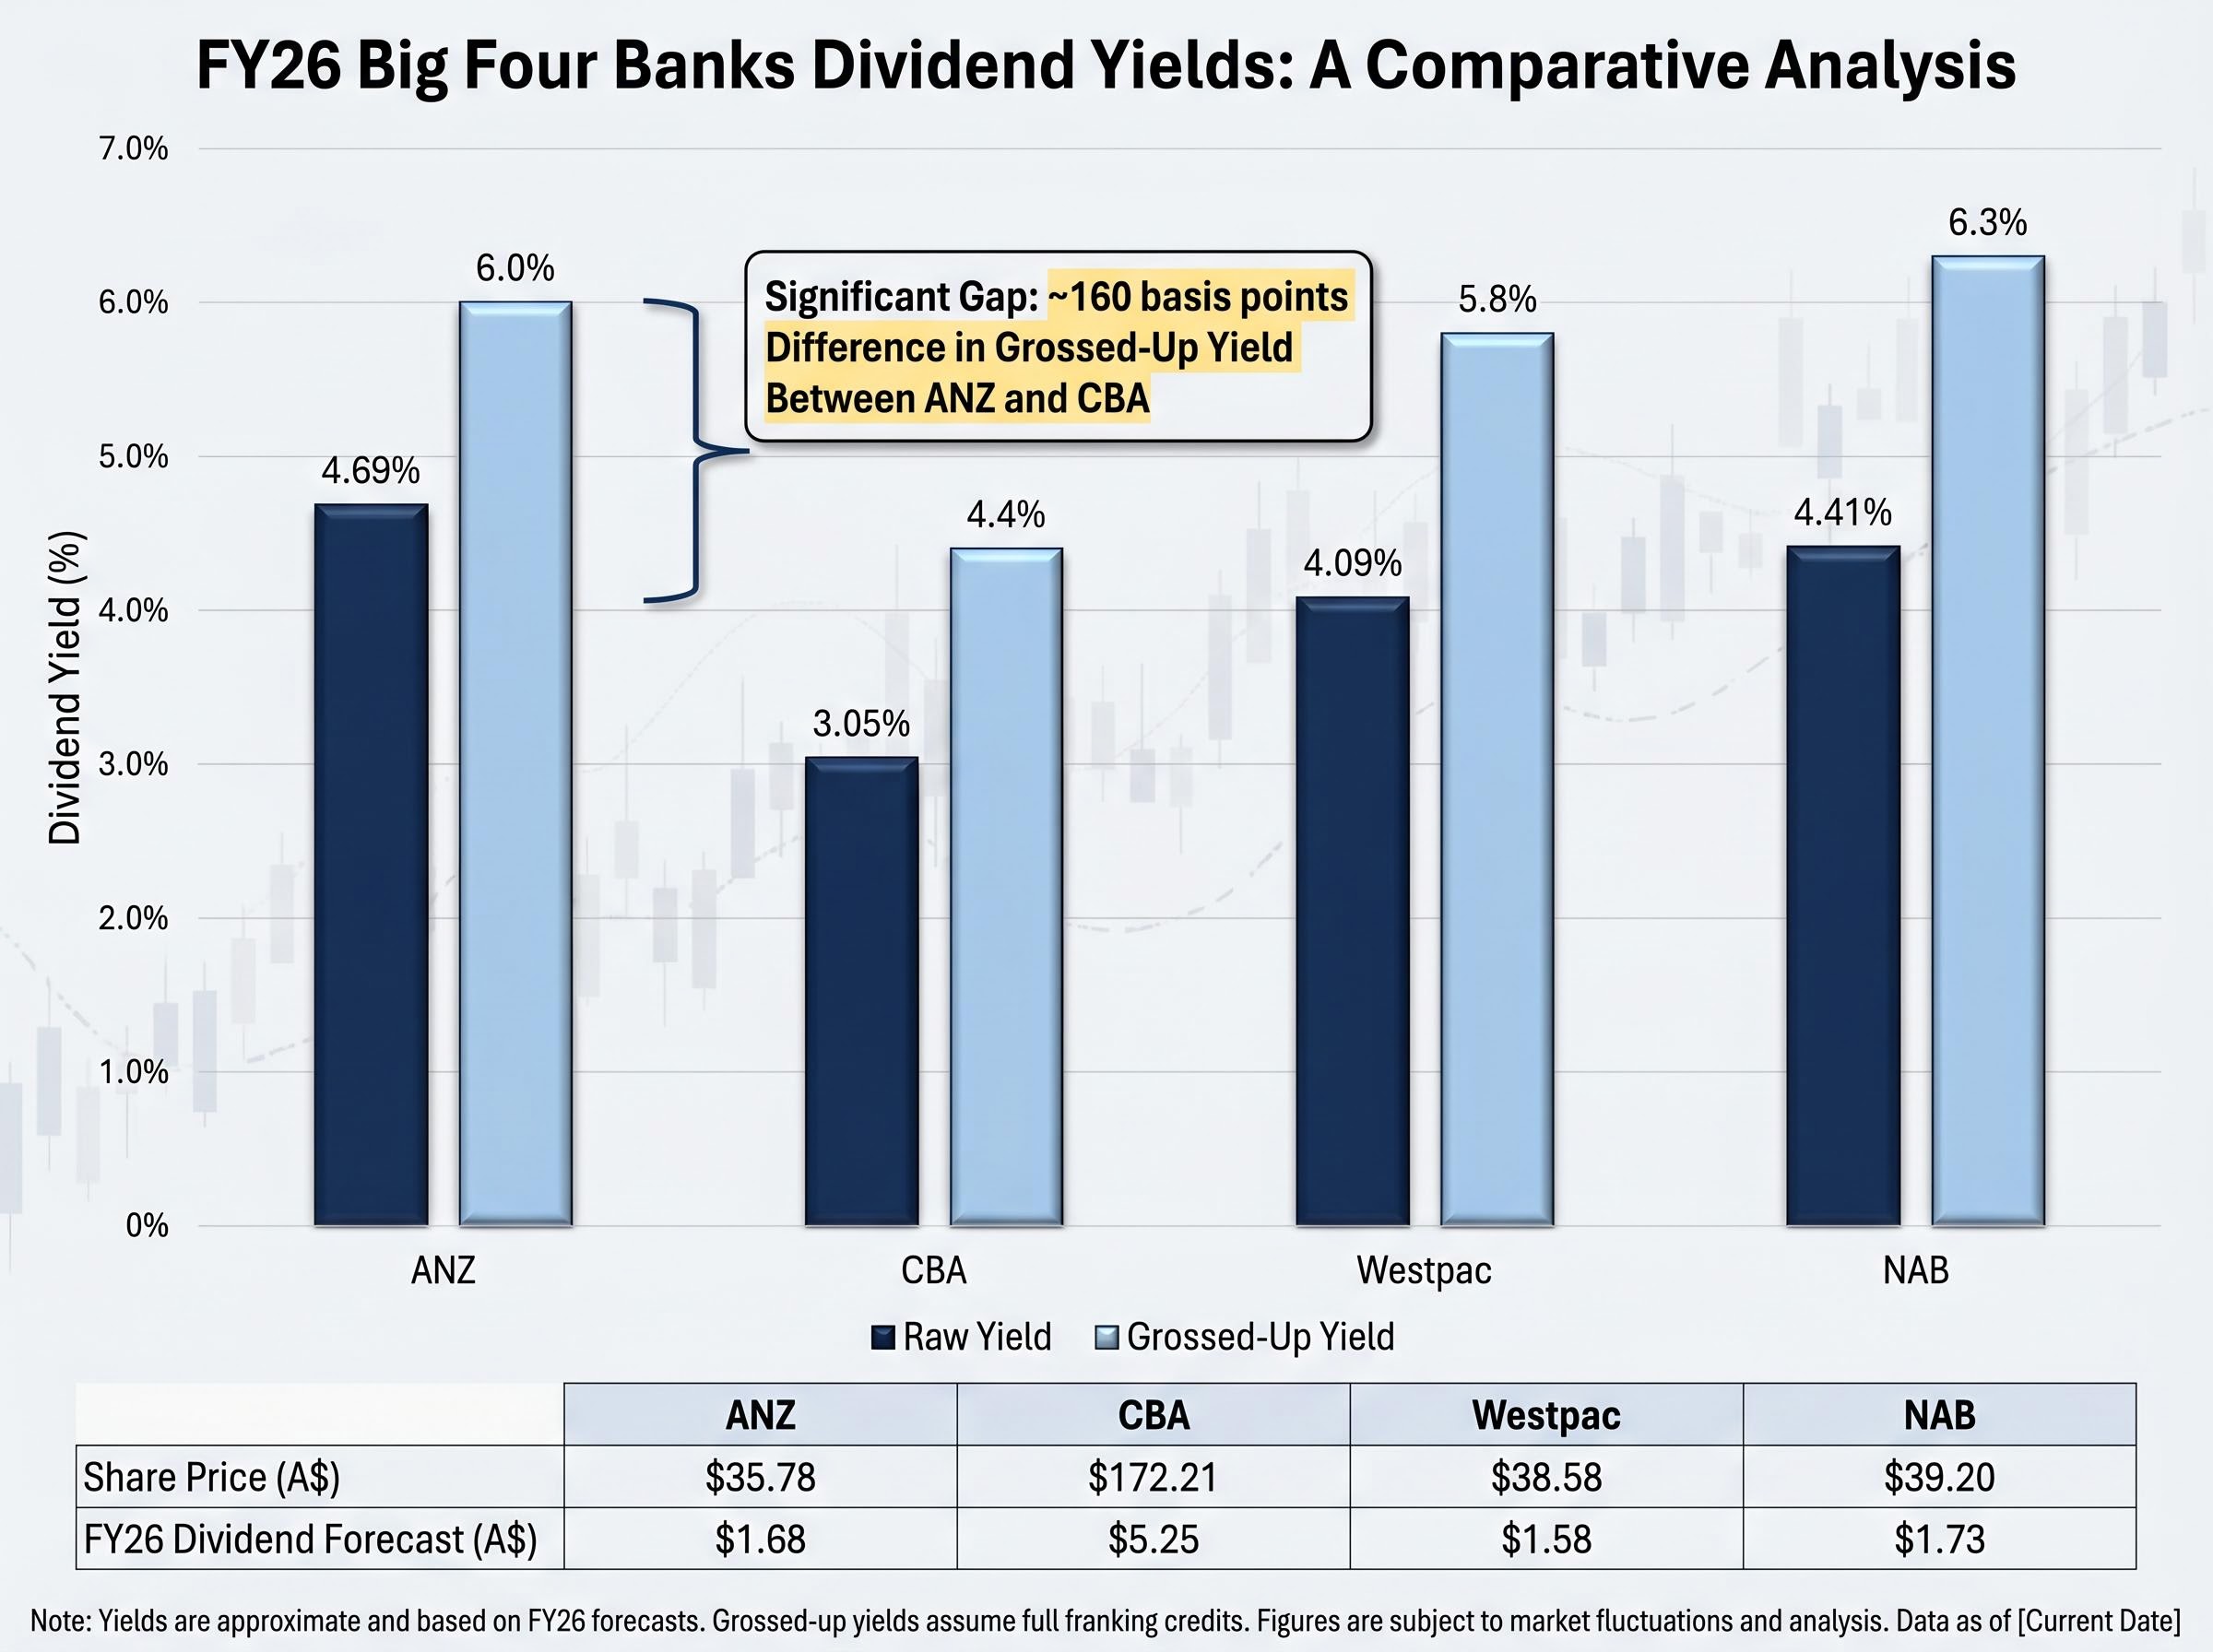
The comparison sharpens one point in particular: CBA, often treated as the default “safe” bank income pick, offers a grossed-up yield roughly 160 basis points below ANZ’s. NAB leads the group at approximately 6.3%, with ANZ close behind at 6.0% and Westpac trailing marginally at 5.8%.
Yield alone does not settle the question. Valuation, earnings quality, and risk profiles differ across the four. CBA’s premium multiple reflects a franchise value that the market prices separately from dividend income. Still, for investors whose primary objective is yield, the gap between ANZ and CBA is wide enough to warrant a reassessment of default allocations.
Big Four dividend sustainability looks different depending on the stress scenario applied, with Morgans carrying sell ratings across all four major banks and implying downside of 12%-28% from late April prices, a valuation gap that puts the grossed-up yield advantage in direct tension with the risk of capital loss for investors entering at current levels.
The income case built across earlier sections requires a counterweight. Not every signal points in the same direction.
Analyst opinion is genuinely split. According to CommSec’s collation as of 5 May 2026, the ratings distribution stands at 6 buy, 6 hold, and 4 sell. That is not a consensus endorsement; it is an even division where nearly a quarter of covering analysts rate the stock as a sell.
Macquarie maintained a Hold rating with a price target of $33.50, sitting roughly 6.4% below ANZ’s $35.78 trading price.
Three risk factors warrant attention:
The RBA May 2026 cash rate decision lifted the official rate to 4.35%, narrowing the yield premium that bank dividends command over risk-free alternatives and raising the bar for income investors comparing term deposits against equity income from stocks like ANZ.
The 3.6% intraday drop on 1 May, when the half-year results were released, suggests the market had priced in some probability of a dividend increase. That expectation was not met. Whether the full-year result corrects that disappointment depends on second-half earnings delivery.
ANZ share price volatility in the months preceding the half-year result was driven almost entirely by macro forces rather than company-specific news, with a 10% March sell-off triggered by geopolitical risk and fuel cost concerns unwinding roughly half its recovery before the 1 May results date.
The income case rests on specifics, not generalities.
The case for ANZ as an income holding:
The risks to monitor:
The trade-off is clear. ANZ offers a credible, earnings-supported income stream for investors with a multi-year horizon and tolerance for bank-sector cyclicality. It is less suited to investors who require both yield and near-term capital stability, particularly with the stock trading above at least one major broker’s valuation.
This article is for informational purposes only and should not be considered financial advice. Investors should conduct their own research and consult with financial professionals before making investment decisions. Past performance does not guarantee future results. Financial projections are subject to market conditions and various risk factors.
ANZ’s flat interim dividend was a capital management decision, not a distress signal. The 12.39% CET1 ratio, improved franking, and DRP neutralisation all point to a board managing the balance sheet with deliberation rather than constraint.
The forward trajectory tells the more relevant story. A grossed-up yield of approximately 6%, rising modestly into FY27, positions ANZ as one of the more attractive income options among the Big Four. That case is real. So is the counterweight: a split analyst community, a major broker pricing the stock below its current level, and an RBA rate decision that lifts the bar for all yield-bearing assets.
The next catalyst for dividend clarity arrives with the FY26 full-year result and any updated broker price targets that follow the May rate decision. Until then, the numbers support a competitive income holding for those prepared to accept the risk that comes with it.
Investors exploring how a prolonged tightening cycle affects the income calculus for bank shares will find our deep-dive into the RBA rate plateau outlook covers Westpac’s projection of further hikes to 4.85% by August 2026, the expected duration of the hold period through mid-2027, and what second-round oil price effects through freight and construction costs mean for net interest margin pressure across the Big Four.
Consensus forecasts place ANZ's FY26 full-year dividend at $1.68 per share, rising modestly to $1.72 per share in FY27, supported by earnings per share growth from $2.54 to $2.63 over the same period.
At 75% franking, ANZ's raw FY26 yield of approximately 4.69% grosses up to around 6.0% for eligible Australian-resident investors, because franking credits represent tax already paid at the corporate level that can offset personal tax liability or generate a refund.
ANZ management signalled deliberate capital management rather than financial stress, with the CET1 ratio rising to 12.39% and the dividend reinvestment plan neutralised through on-market share buybacks to avoid dilution, while improved franking from 70% to 75% partially compensated income investors.
ANZ's grossed-up FY26 yield of approximately 6.0% is materially above CBA's 4.4% and slightly above Westpac's 5.8%, with NAB leading the group at approximately 6.3%, making ANZ one of the more competitive income options among the major banks.
The key risks include a split analyst community with a 6-6-4 buy-hold-sell distribution, Macquarie's price target of $33.50 sitting below the current trading price, and the RBA's May 2026 rate hike to 4.35% which narrows the yield advantage over risk-free alternatives and could pressure net interest margins.