
How Hormuz Closure at $104 Oil Is Reshaping Every Asset Class
7 hrs ago

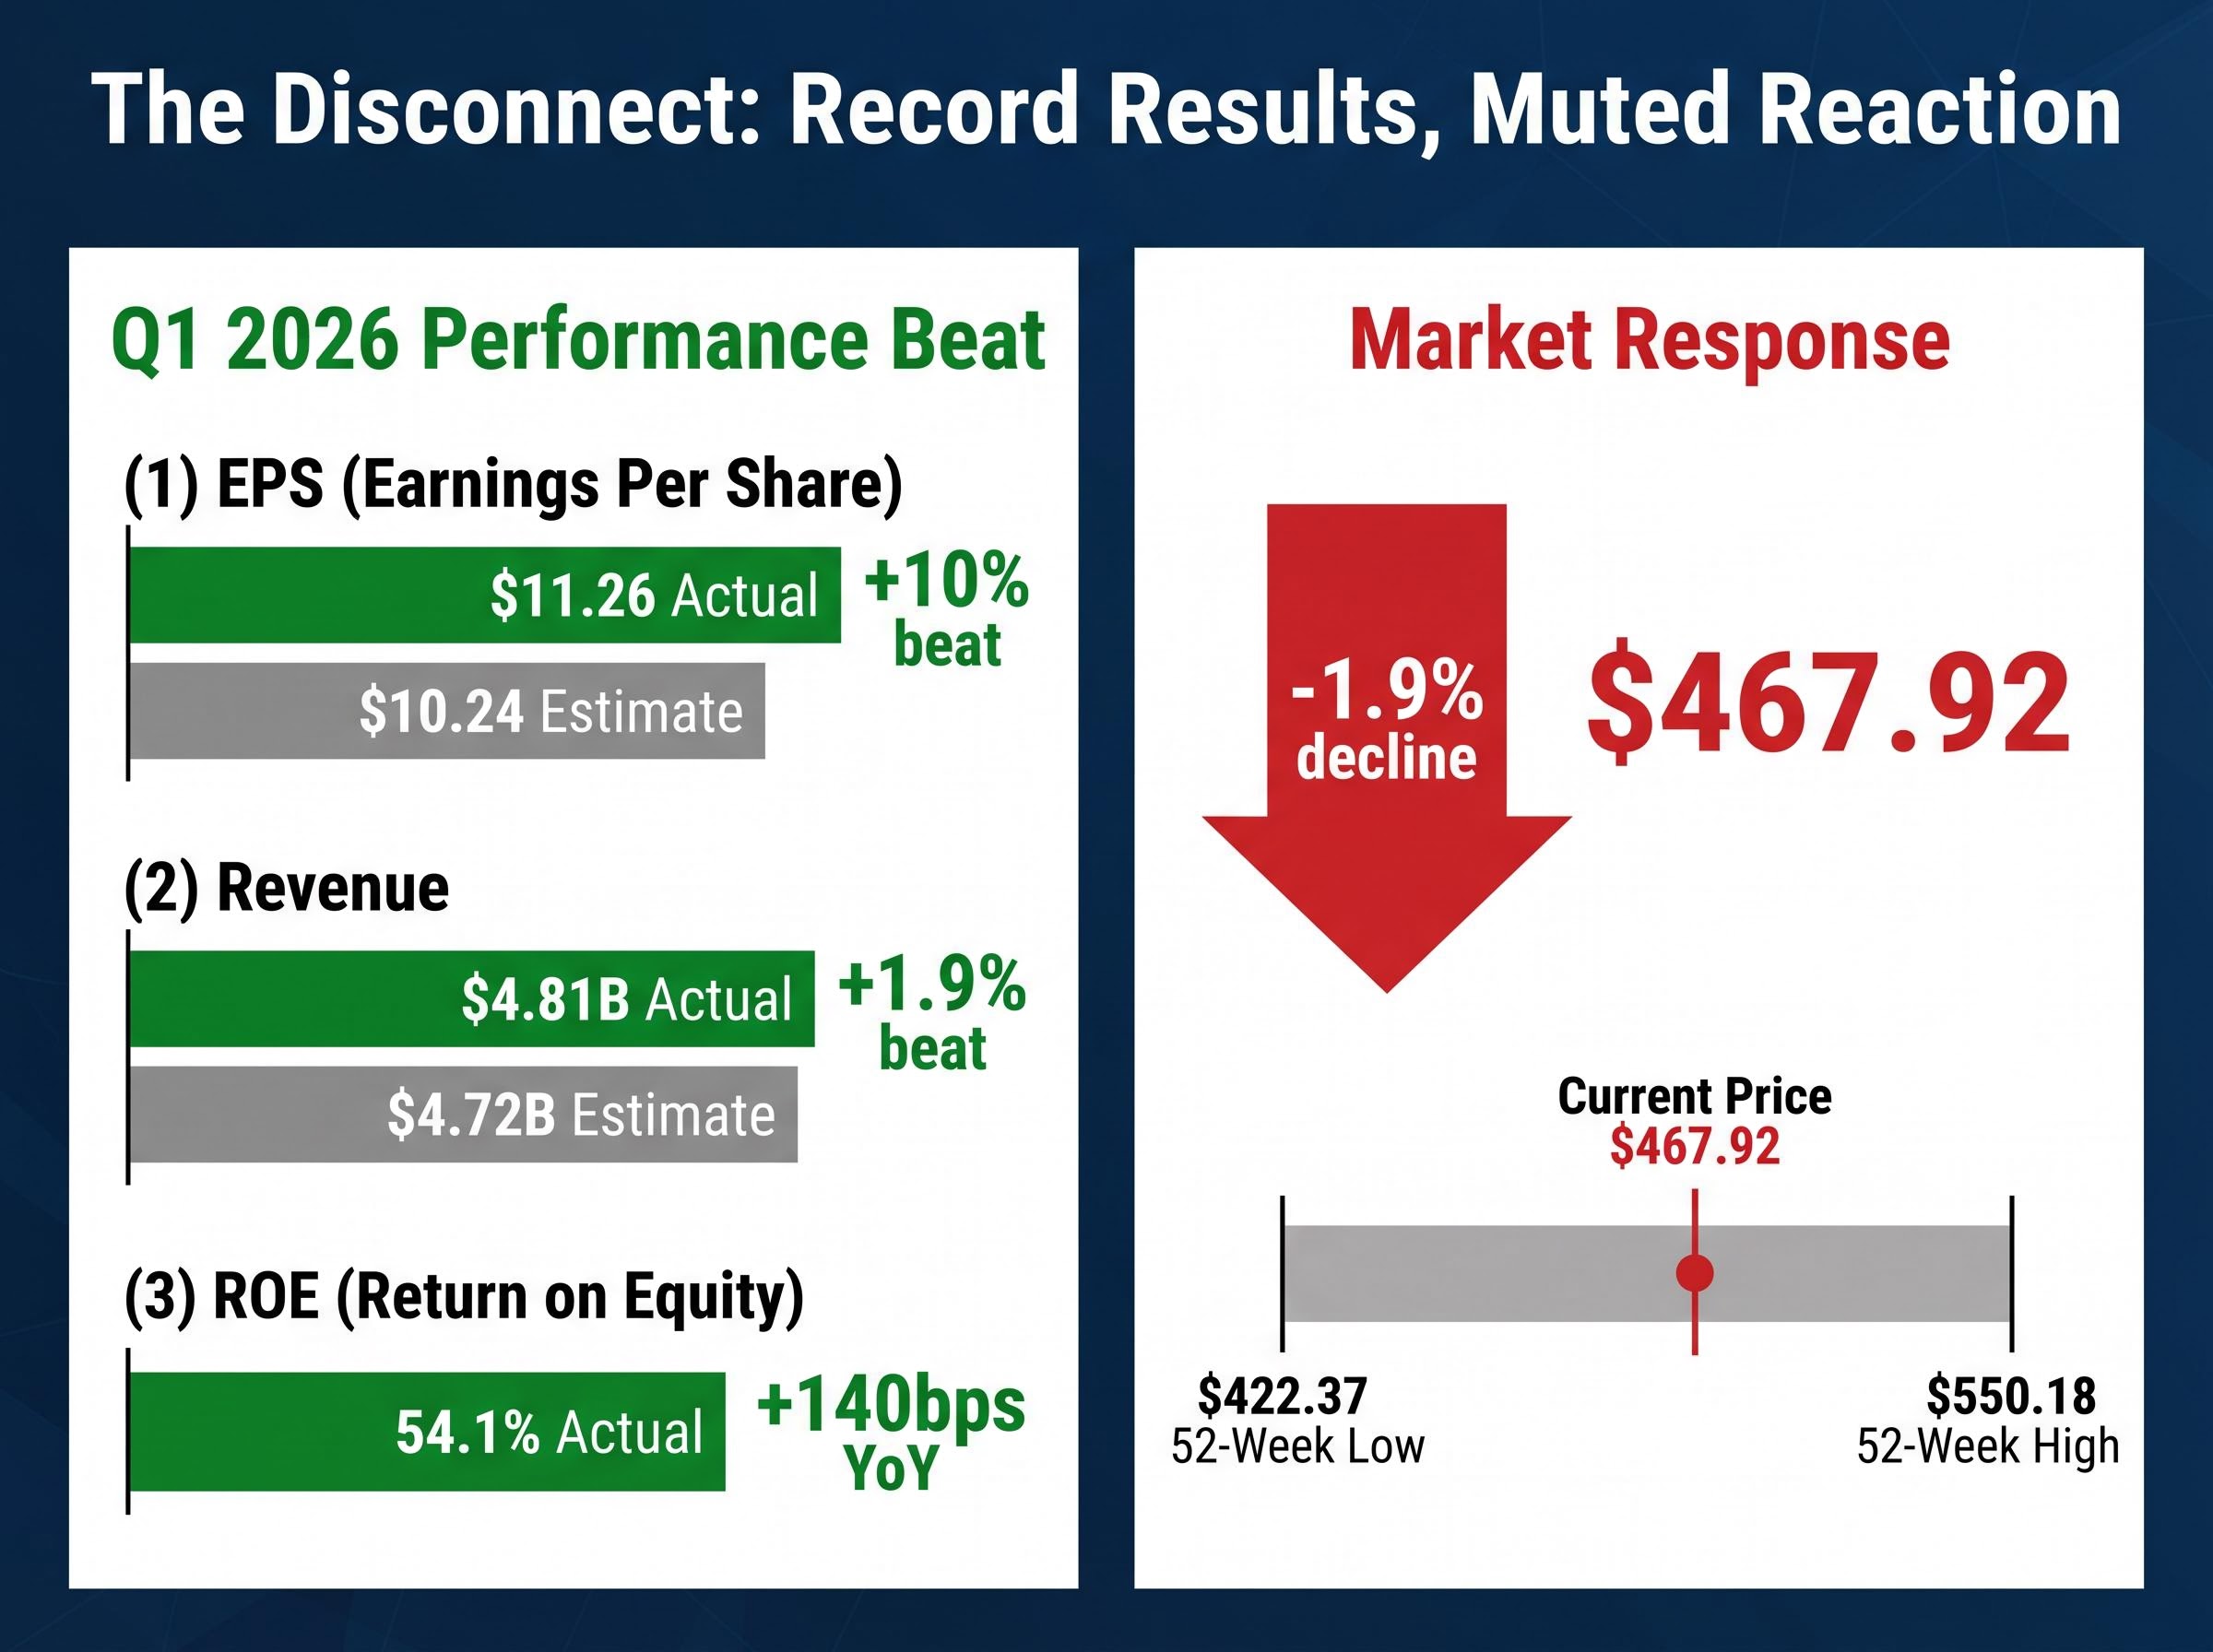
Ameriprise Financial posted record quarterly earnings per share of $11.26 in Q1 2026, beating Wall Street estimates by roughly 10%, yet shares slipped nearly 2% in after-hours trading to $467.92. The disconnect between operational execution and market reaction raises questions about what investors are pricing in beyond the headline numbers. Understanding the drivers beneath the surface, from advisor productivity records to a complex bank partnership transition, reveals whether this quarter marks continued momentum or a peak in the cycle.
This analysis unpacks the mechanics behind Ameriprise’s Q1 performance, examines why the market responded with scepticism despite the beat, and identifies the signals that matter for assessing the company’s trajectory through 2026.
Ameriprise delivered $11.26 in adjusted earnings per share for the quarter ended 31 March 2026, surpassing the consensus estimate of $10.24 by approximately 10%. Revenue climbed 11% year-over-year to $4.81 billion, ahead of the $4.72 billion expected. Return on equity reached 54.1%, up 140 basis points from the prior year period.
Ameriprise Financial’s official Q1 2026 earnings release confirms the $11.26 adjusted EPS, $4.81 billion revenue figure, and 54.1% return on equity that analysts are now reconciling with the market’s 1.9% after-hours decline.
Record Performance Earnings per share grew 19% year-over-year, marking the highest quarterly EPS in the company’s history.
Yet shares declined 1.9% in extended trading following the release. The stock has traded in a 52-week range of $422.37 to $550.18, and the after-hours price positioned it closer to the middle of that band than the peak reached earlier in the cycle.
Key performance metrics for Q1 2026:
Investors need to reconcile strong operational metrics with price action. The market’s hesitation despite the earnings beat suggests concerns beyond the quarter’s results, whether tied to valuation levels after a multi-year run, uncertainty around the Comerica-to-Huntington transition, or broader macro volatility affecting financial services multiples. The tension between execution and sentiment is the analytical puzzle the remainder of this review addresses.
Wealth management delivered the bulk of Ameriprise’s quarterly profit, with adjusted operating net revenues climbing 14% to $3.2 billion and pre-tax adjusted operating earnings rising 20% to $951 million. Excluding a $25 million one-time payment related to the Comerica contract termination, earnings growth was 17%. The segment’s margin expanded to 30% from 28% in the prior year period.
Advisor productivity reached a record $1.2 million per advisor, up 10% year-over-year. This metric captures revenue generated per advisor and reflects both market appreciation and the firm’s ability to attract and retain high-producing professionals. Total client assets under management and advisement in the wealth segment grew 12% to $1.1 trillion.
Cerulli Associates’ U.S. Advisor Metrics research on productivity drivers shows that firms achieving sustained productivity growth above $1 million per advisor typically combine technology investment with practice management support, the model Ameriprise is executing through its AI workflow integration.
| Metric | Q1 2026 Value | Growth Rate |
|---|---|---|
| Adjusted Operating Net Revenues | $3.2 billion | +14% YoY |
| Pre-tax Adjusted Operating Earnings | $951 million | +20% YoY (+17% ex-Comerica payment) |
| Segment Margin | 30% | +200 bps YoY |
| Advisor Productivity | $1.2 million | +10% YoY |
| Total Client Assets | $1.1 trillion | +12% YoY |
Flow metrics presented more complexity. Wrap net inflows totalled $6 billion for the quarter, and total client flows reached $4.2 billion. Advisor departures ran higher than management’s target range, pressuring net recruiting results. The firm added 61 advisors in Q1, with management noting pipeline improvement heading into Q2.
Wealth management represents the bulk of Ameriprise’s value creation. The productivity trajectory and margin expansion indicate earnings quality driven by structural competitive advantages, not merely market beta. Investors assessing sustainability need to weigh whether the $1.2 million per advisor figure reflects a durable platform advantage or conditions that compress if volatility persists and recruiting costs escalate.
Comerica’s early termination of its distribution agreement, driven by Fifth Third Bancorp’s acquisition of the institution, triggered a $25 million make-whole payment to Ameriprise in Q1. The payment offset near-term earnings pressure but does not resolve the outflow timeline. Approximately $18 billion of Comerica-related assets are expected to flow out by the end of Q3 2026 as clients transition away or Fifth Third redirects relationships.
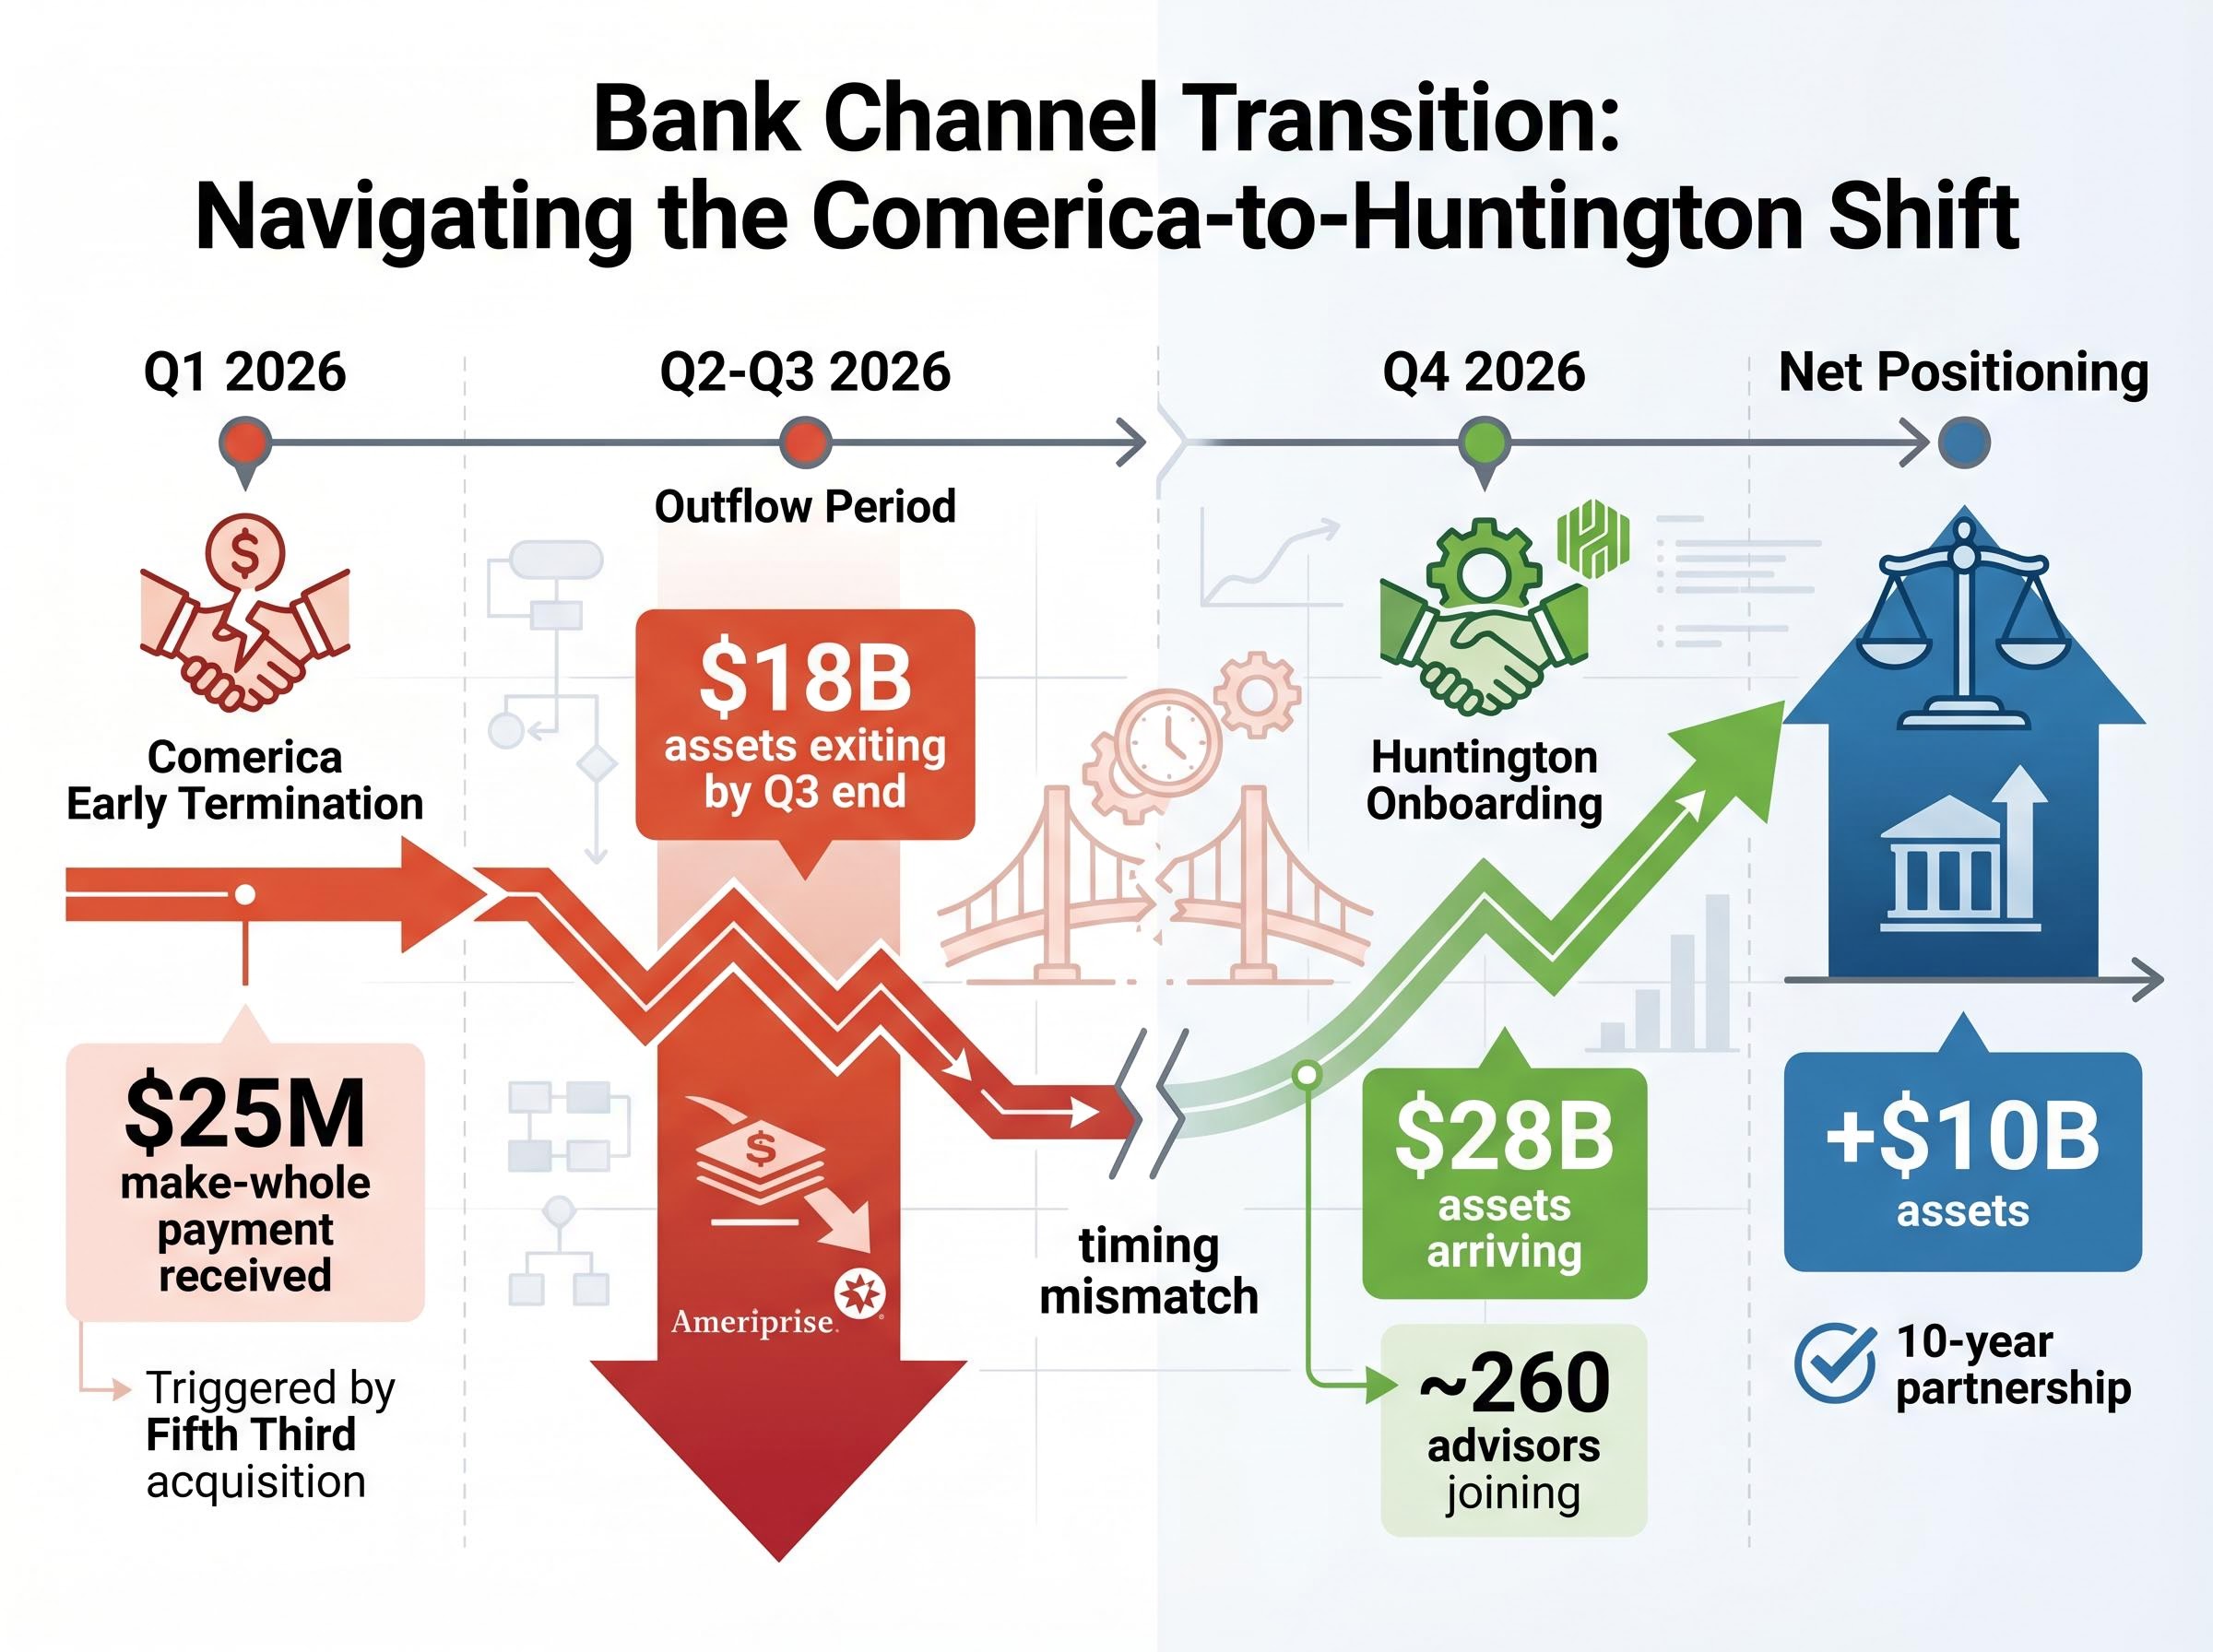
The Huntington Bank partnership, announced during the quarter, provides a strategic offset. Huntington will bring approximately 260 advisors and $28 billion in client assets to Ameriprise’s platform under a 10-year agreement. Most of the onboarding is targeted for Q4 2026, creating a gap between Comerica’s departure and Huntington’s full arrival.
Management characterised the Huntington selection as the result of a competitive process lasting over a year. The 10-year structure provides revenue visibility, and the asset base exceeds what Comerica contributed at the time of termination. The partnership positions Ameriprise to expand its bank channel presence with a partner committed to growth rather than navigating acquisition-related uncertainty.
The Huntington partnership positions Ameriprise to expand its bank channel presence using capital-light fee-generating partnership models that eliminate direct credit risk while retaining full customer relationships; BOQ’s $3.7 billion equipment finance transfer to Challenger demonstrates how institutions are converting capital-intensive portfolios into servicing arrangements that deliver 15-25 basis points of ROE uplift without balance sheet expansion.
Comerica versus Huntington comparison:
Bank channel transitions create near-term noise in flow metrics and advisor counts. Readers assessing Ameriprise’s growth trajectory should view the net effect rather than isolating Comerica’s departure. The $28 billion Huntington commitment, paired with the contractual structure, suggests management sees the transition as a positioning upgrade despite the operational complexity of managing overlapping timelines.
Ameriprise returned $936 million to shareholders in Q1 2026, representing 88% of operating earnings and consistent with the company’s stated target of returning 85% to 90% of operating earnings over time. The capital allocation included repurchasing 1.6 million shares during the quarter and raising the quarterly dividend by 6%.
The firm held $2.3 billion in excess capital and $2.3 billion in holding company liquidity as of 31 March 2026. Management indicated willingness to trend toward the higher end of the return range given current valuation levels, a signal that buyback activity could accelerate if share price weakness persists.
Five-year compounding metrics:
Management on Valuation Leadership highlighted that current share price levels present an opportunity to increase buyback activity within the 85%-90% return framework, particularly given the company’s cash generation capacity.
Capital allocation discipline is a core component of Ameriprise’s investment thesis. The five-year track record demonstrates both the commitment and the capacity for continued returns. Investors evaluating the stock need to understand whether the 88% payout ratio in Q1 reflects a sustainable baseline or a ceiling that could flex higher if management perceives valuation dislocation.
Ameriprise operates through three primary segments: Wealth Management, Asset Management, and Retirement and Protection Solutions. Wealth Management dominates earnings contribution, but the diversified structure provides stability across market cycles.
Ameriprise’s $1.2 million advisor productivity metric reflects the industry shift toward asset-based fee structures in wealth management, where revenue scales with client portfolio values rather than transactional activity; Fidelity’s 2019 pivot away from trading commissions demonstrates how this alignment creates both earnings stability during market appreciation cycles and sensitivity to volatility-driven valuation compression.
Asset Management posted pre-tax operating earnings of $273 million, up 13% year-over-year, with a margin of 44% that exceeded the company’s 35%-39% target range. Total assets under management and advisement across the asset management platform reached $706 billion, up 8% from the prior year. Over 70% of funds ranked above peer median performance across one-year, three-year, and five-year periods, indicating competitive investment capabilities supporting organic growth.
Asset Management’s 44% margin, exceeding Ameriprise’s 35-39% target range, reflects margin expansion from higher-fee product mix shifts toward alternative strategies; Pengana Capital’s private credit platform demonstrates how inflows at 1.7% net base revenue margins (versus 0.97% group average) create compounding profit leverage when higher-margin products capture disproportionate net flows.
Retirement and Protection Solutions, the legacy insurance and annuity business, delivered pre-tax operating earnings of $190 million for the quarter. Management expects this segment to generate approximately $800 million in annual earnings over time, providing a stable profit stream with limited capital intensity.
| Segment | Q1 2026 Earnings | Margin/Growth | Key Driver |
|---|---|---|---|
| Wealth Management | $951 million | 30% margin, +20% YoY | Advisor productivity, client asset growth |
| Asset Management | $273 million | 44% margin, +13% YoY | AUM growth, fee-based revenue |
| Retirement and Protection | $190 million | ~$800M annual run rate | Legacy annuity book, stable earnings |
This section provides the foundation for understanding why Ameriprise’s earnings quality differs from pure asset managers or pure insurers. The wealth management engine drives growth, asset management contributes margin expansion and organic inflows, and the retirement segment offers downside protection. Readers unfamiliar with the business model gain the context needed to evaluate why a 10% earnings beat and 54.1% return on equity still resulted in share price pressure.
Management’s Q2 2026 earnings per share projection of $10.87 implies a slight step-down from Q1’s record but maintains the growth trajectory relative to the prior year. Full-year 2027 consensus sits at $44.91 in EPS, reflecting expectations for continued compounding. The company is targeting organic growth of 4% to 5% for 2026, driven by advisor productivity momentum, Huntington onboarding, and platform investments.
ETF assets surpassed $10 billion during the quarter, expanding the product suite and client accessibility. AI integration is underway across advisor workflows, including meeting preparation, client interaction summarisation, and practice management tools designed to lift productivity without adding headcount.
Key catalysts for the remainder of 2026:
Risk factors to monitor:
Readers need a synthesis of what comes next. The forward guidance, combined with strategic initiatives around AI and bank partnerships, suggests management confidence in the growth trajectory. The acknowledged recruiting headwinds and macroeconomic uncertainty provide the counterweight. Current valuation, trading near the middle of the 52-week range despite record earnings, reflects the market weighing both sides of that equation.
Ameriprise’s post-earnings price decline despite a 10% EPS beat reflects broader questions about valuation multiples and forward return expectations across financial services; the S&P 500 financials sector trades at a forward P/E of 14.2 (versus 20.8 for the broader index), yet investor caution suggests concerns about whether current multiples can sustain if economic uncertainty pressures fee-based revenue and margin compression accelerates.
Ameriprise’s Q1 2026 results illustrate the tension between operational excellence and investor caution. Record earnings per share, margin expansion across segments, and capital return discipline demonstrate execution strength. Yet the 1.9% after-hours decline signals the market is pricing in risks beyond the quarter’s numbers, whether related to recruiting pressures, the Comerica-to-Huntington transition timing, or broader valuation recalibration across financial services.
What differentiates this quarter is the combination of $1.2 million advisor productivity, 30% wealth management margins, and the strategic positioning achieved through the Huntington partnership despite near-term flow complexity. The 88% capital return ratio and management’s openness to increasing buybacks at current prices suggest confidence in the trajectory.
Investors should monitor Huntington onboarding execution in Q4, organic flow trends as recruiting dynamics evolve, and whether the 54.1% return on equity proves sustainable if market conditions shift. The quarter’s results confirm the business model’s earnings power. The market’s response confirms the debate over how much of that power is already reflected in the valuation.
—
This article is for informational purposes only and should not be considered financial advice. Investors should conduct their own research and consult with financial professionals before making investment decisions.
Ameriprise reported adjusted earnings per share of $11.26 for Q1 2026, beating the consensus estimate of $10.24 by approximately 10%, while revenue rose 11% year-over-year to $4.81 billion and return on equity reached 54.1%.
Despite the strong beat, shares declined roughly 1.9% in after-hours trading, with market caution likely reflecting concerns about advisor recruiting pressures, the timing gap between Comerica asset outflows and Huntington onboarding, and broader valuation uncertainty across financial services.
Ameriprise announced a 10-year partnership with Huntington Bank that will bring approximately 260 advisors and $28 billion in client assets to its platform, with most onboarding targeted for Q4 2026, more than offsetting the $18 billion expected to flow out from the Comerica contract termination.
Ameriprise returned $936 million to shareholders in Q1 2026, representing 88% of operating earnings, through share repurchases of 1.6 million shares and a 6% increase in the quarterly dividend, consistent with its stated 85%-90% return target.
Management projected Q2 2026 earnings per share of $10.87, and the company is targeting organic growth of 4%-5% for 2026, driven by advisor productivity gains, Huntington Bank onboarding, and AI integration across its advisor platform.


