Roughly 40% of total US market weight now sits in a single sector: technology. Yet the companies drawing the most attention within it, the frontier AI developers, reported combined operating losses measured in the tens of billions of dollars in 2025.
That is the paradox worth sitting with. Capital is flooding toward the least financially transparent companies in the entire AI ecosystem, drawn by revenue growth that has yet to translate into anything resembling a business model. The situation echoes earlier competitive booms, from automobiles to record players, where the entities that captured durable returns were rarely the headline competitors. They were the suppliers who sold to all of them.
The hyperscalers alone are committing more than $700 billion in 2026 capital expenditure. The question this analysis answers is where that money physically lands in the supply chain, and which AI-adjacent positions carry structural durability versus headline risk dressed up as growth exposure. Here is the evidence, category by category, so you can test the thesis yourself rather than take it on enthusiasm.
The AI developer economics problem most investors are not pricing
Start with the numbers, because they tell the story before any interpretation does.
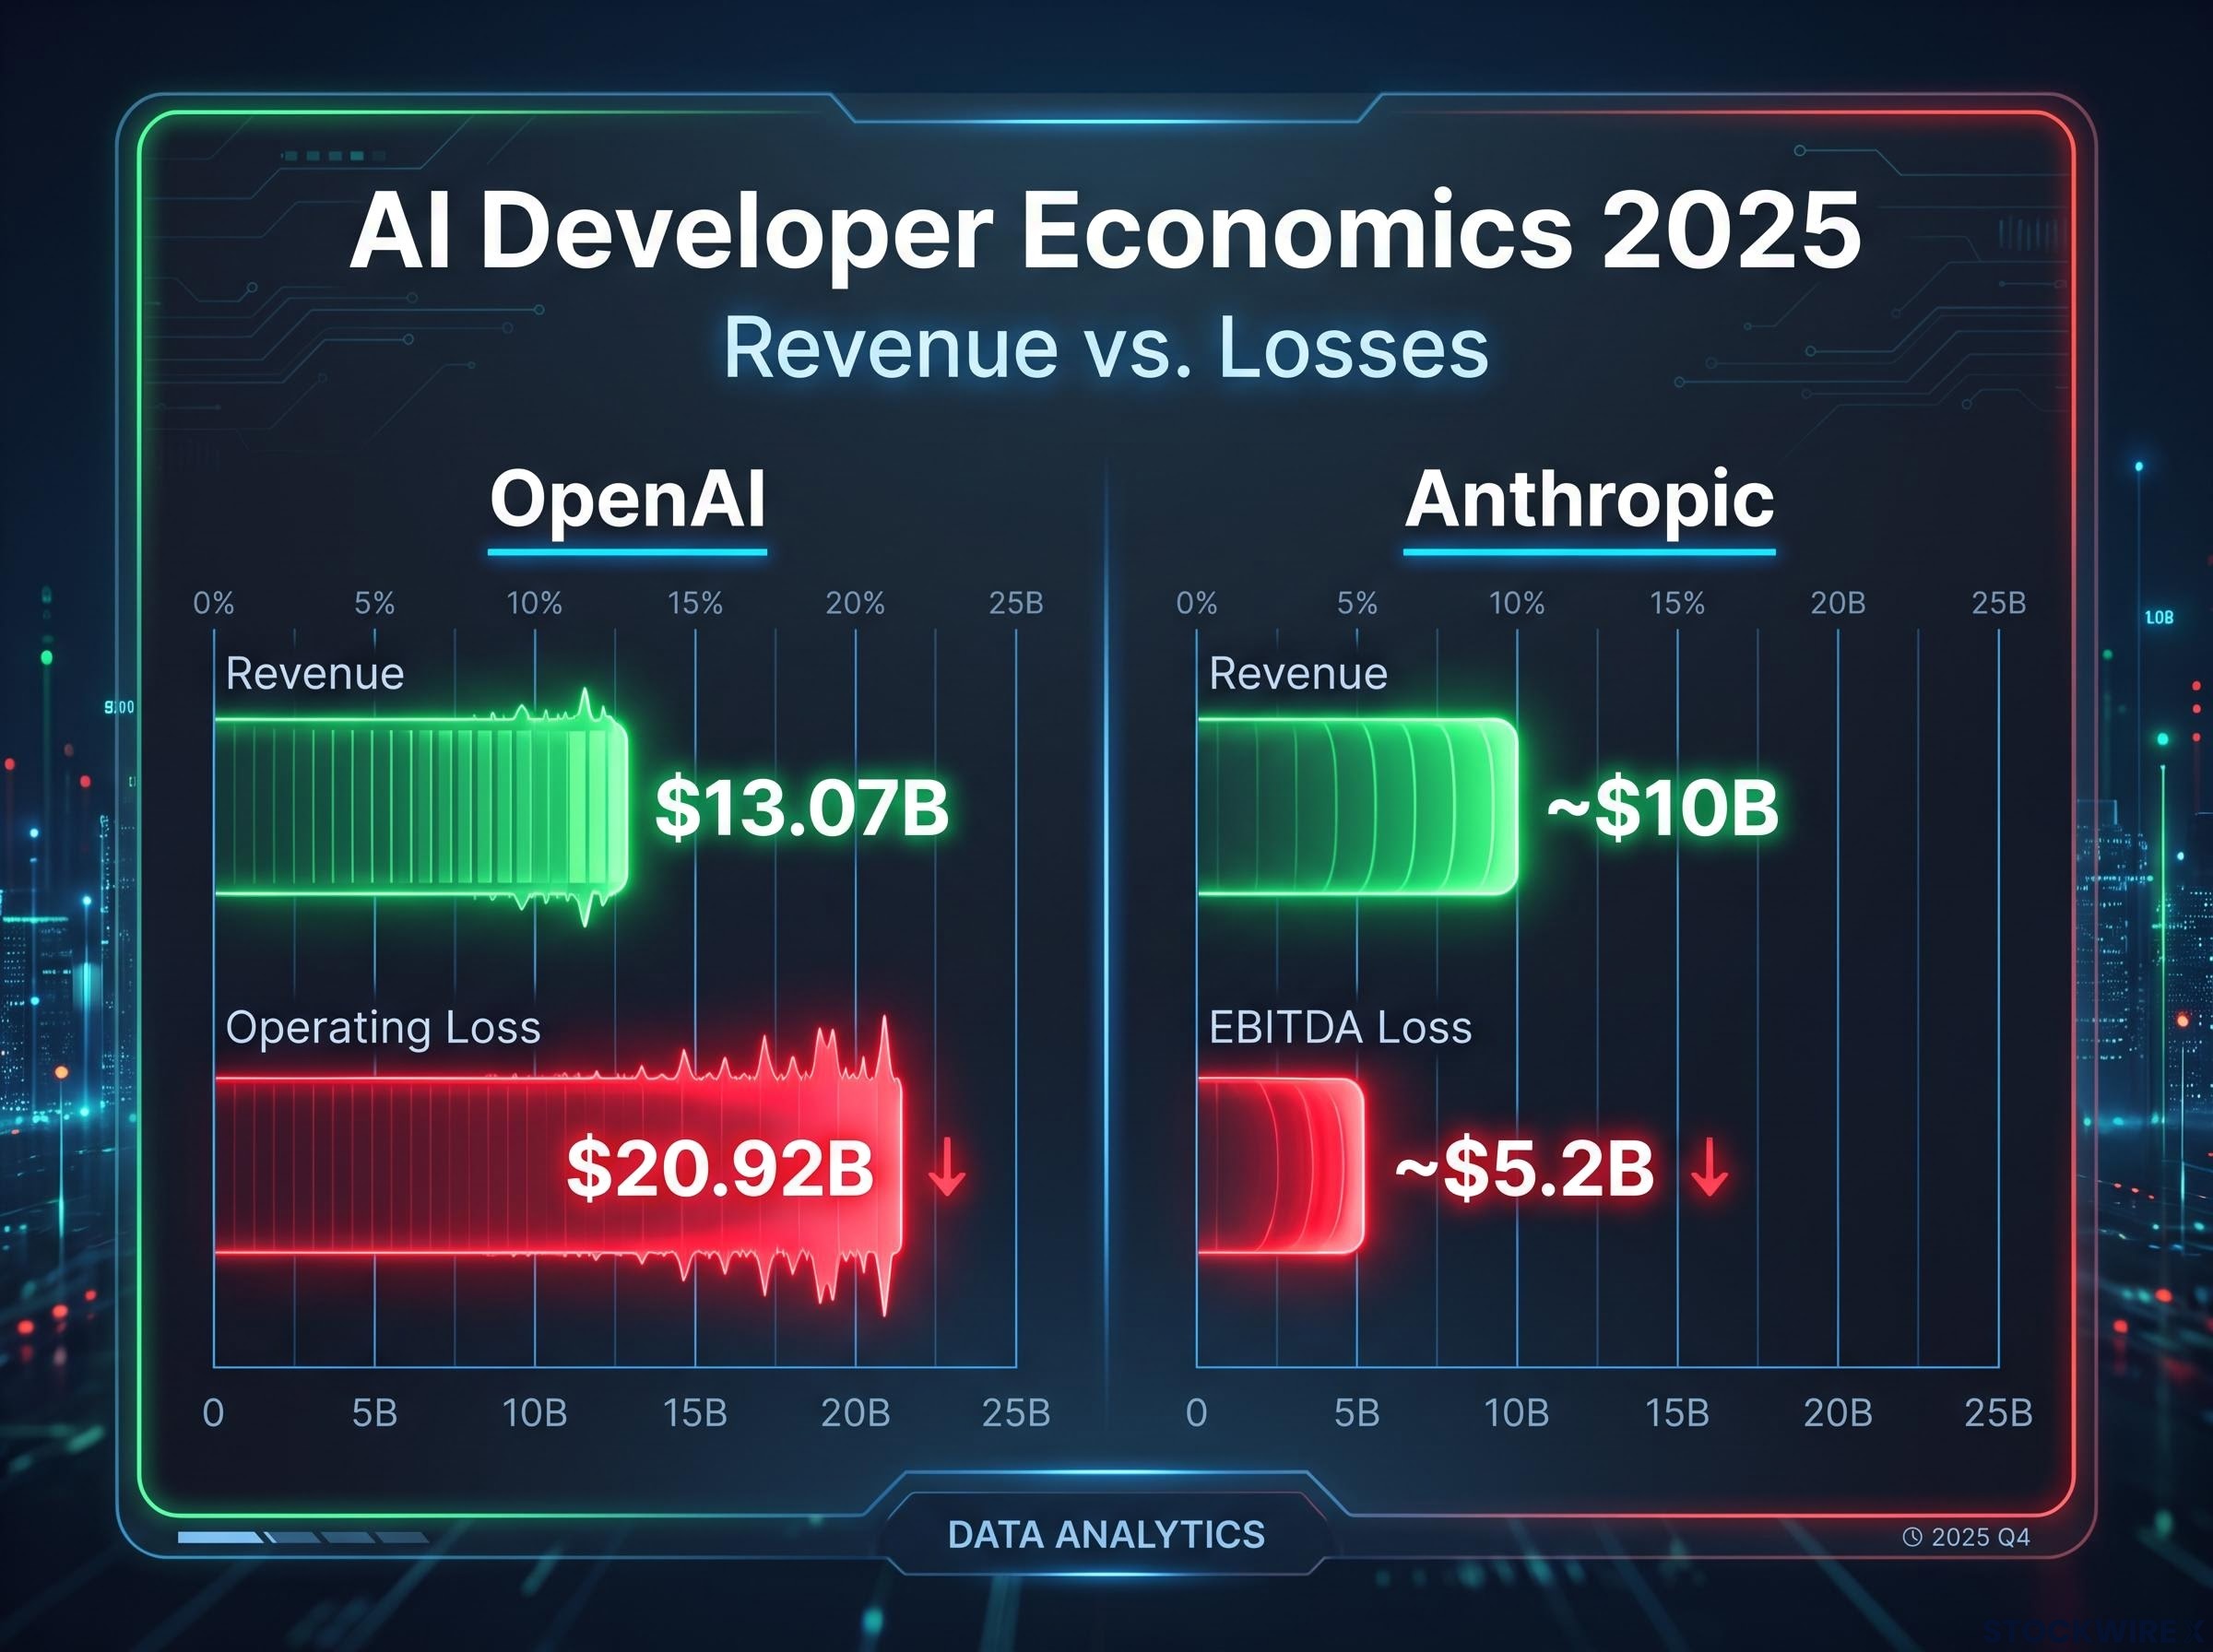
OpenAI‘s audited 2025 financials show revenue of $13.07 billion against $34 billion in total costs and expenses. That produces an operating loss of $20.92 billion. The net loss attributable to the company came in far higher, at $38.53 billion, inflated by a one-time adjustment tied to its conversion from a nonprofit to a for-profit structure.
Now look at the trajectory. In 2024, OpenAI reported revenue of $3.7 billion and a net loss of $5.09 billion. Revenue more than tripled year on year. The losses grew faster.
That is the detail most headlines skip. Scale is arriving, but it is not yet fixing the unit economics. Each new dollar of revenue is being met by more than a dollar of cost, and the gap is widening rather than closing.
Anthropic tells a similar story at smaller scale, generating around $10 billion in recognised revenue in 2025 while posting an EBITDA loss (earnings before interest, taxes, depreciation, and amortisation, a rough proxy for operating cash profitability) of roughly $5.2 billion.
| Company | 2025 revenue | 2025 operating loss | YoY revenue growth |
|---|---|---|---|
| OpenAI | $13.07B | $20.92B | ~253% (from $3.7B) |
| Anthropic | ~$10B | ~$5.2B (EBITDA loss) | Not disclosed |
Both companies disclose limited financial detail, excluding standard profitability metrics from public information. And there is a structural fragility beneath the headline losses that analysts have flagged directly.
The concern is circular financing dependency: funders across the AI developer ecosystem are cross-exposed to one another, so if any single major participant runs into difficulty, the stress propagates rather than staying contained.
What this tells you is straightforward. These valuations are not yet grounded in earnings. Any position in AI model developers carries binary outcome risk tied to external funding continuity, not to proven business fundamentals. For reference, prediction market odds of any company reaching artificial general intelligence before the relevant April deadline sat around 28%. That is the bet embedded in these prices.
The structural fragility is not limited to the circular financing dependency; model-lab economics face a second compression layer from open-weight alternatives, where frontier token prices have already fallen roughly 88% since March 2023, making each incremental dollar of revenue harder to defend at any margin.
When big ASX news breaks, our subscribers know first
What the hyperscaler capex numbers reveal about where AI money actually flows
Here is the figure that reframes everything: Microsoft, Alphabet, Amazon, and Meta have guided combined 2026 capital expenditure at $700-725 billion. That is not spending on models. It is spending on physical destinations.
Break it down and the map changes. The money flows into data-centre leases, graphics processing units (GPUs), central processing units (CPUs), and long-lived infrastructure assets. Concrete, steel, copper wire, and the power to run it all.
| Company | 2026 capex guidance | Primary stated destination |
|---|---|---|
| Microsoft | $175B | Data-centre leases, GPUs/CPUs, long-lived assets |
| Alphabet | $195-205B | Data centres and AI compute infrastructure |
| Amazon | $220B (cash capex) | AWS data centres |
| Meta | $130-145B | AI infrastructure, data-centre buildout |
The demand behind this spending is not speculative. According to the Lawrence Berkeley National Laboratory (LBNL), updated projections in June 2026 estimate US data centres will require between 521 and 843 TWh annually by 2030. The reference case sits at around 649 TWh, roughly 11.8% of total US electricity generation.
The International Energy Agency (IEA), in its August 2026 update, expects global data-centre electricity consumption to more than double to around 945 TWh by 2030, with US data centres accounting for nearly half of all US electricity demand growth over the same window.
Goldman Sachs projects a 15% compound annual growth rate in data-centre power demand from 2023 to 2030. That is structural demand, not a cycle.
Goldman Sachs data-centre power demand research projects a 15% compound annual growth rate in electricity consumption from 2023 to 2030, a trajectory driven by AI server density increases that dwarf the efficiency gains observed in prior compute cycles.
The grid constraint that money alone cannot solve quickly
Capital can buy GPUs. It cannot buy its way past the grid.
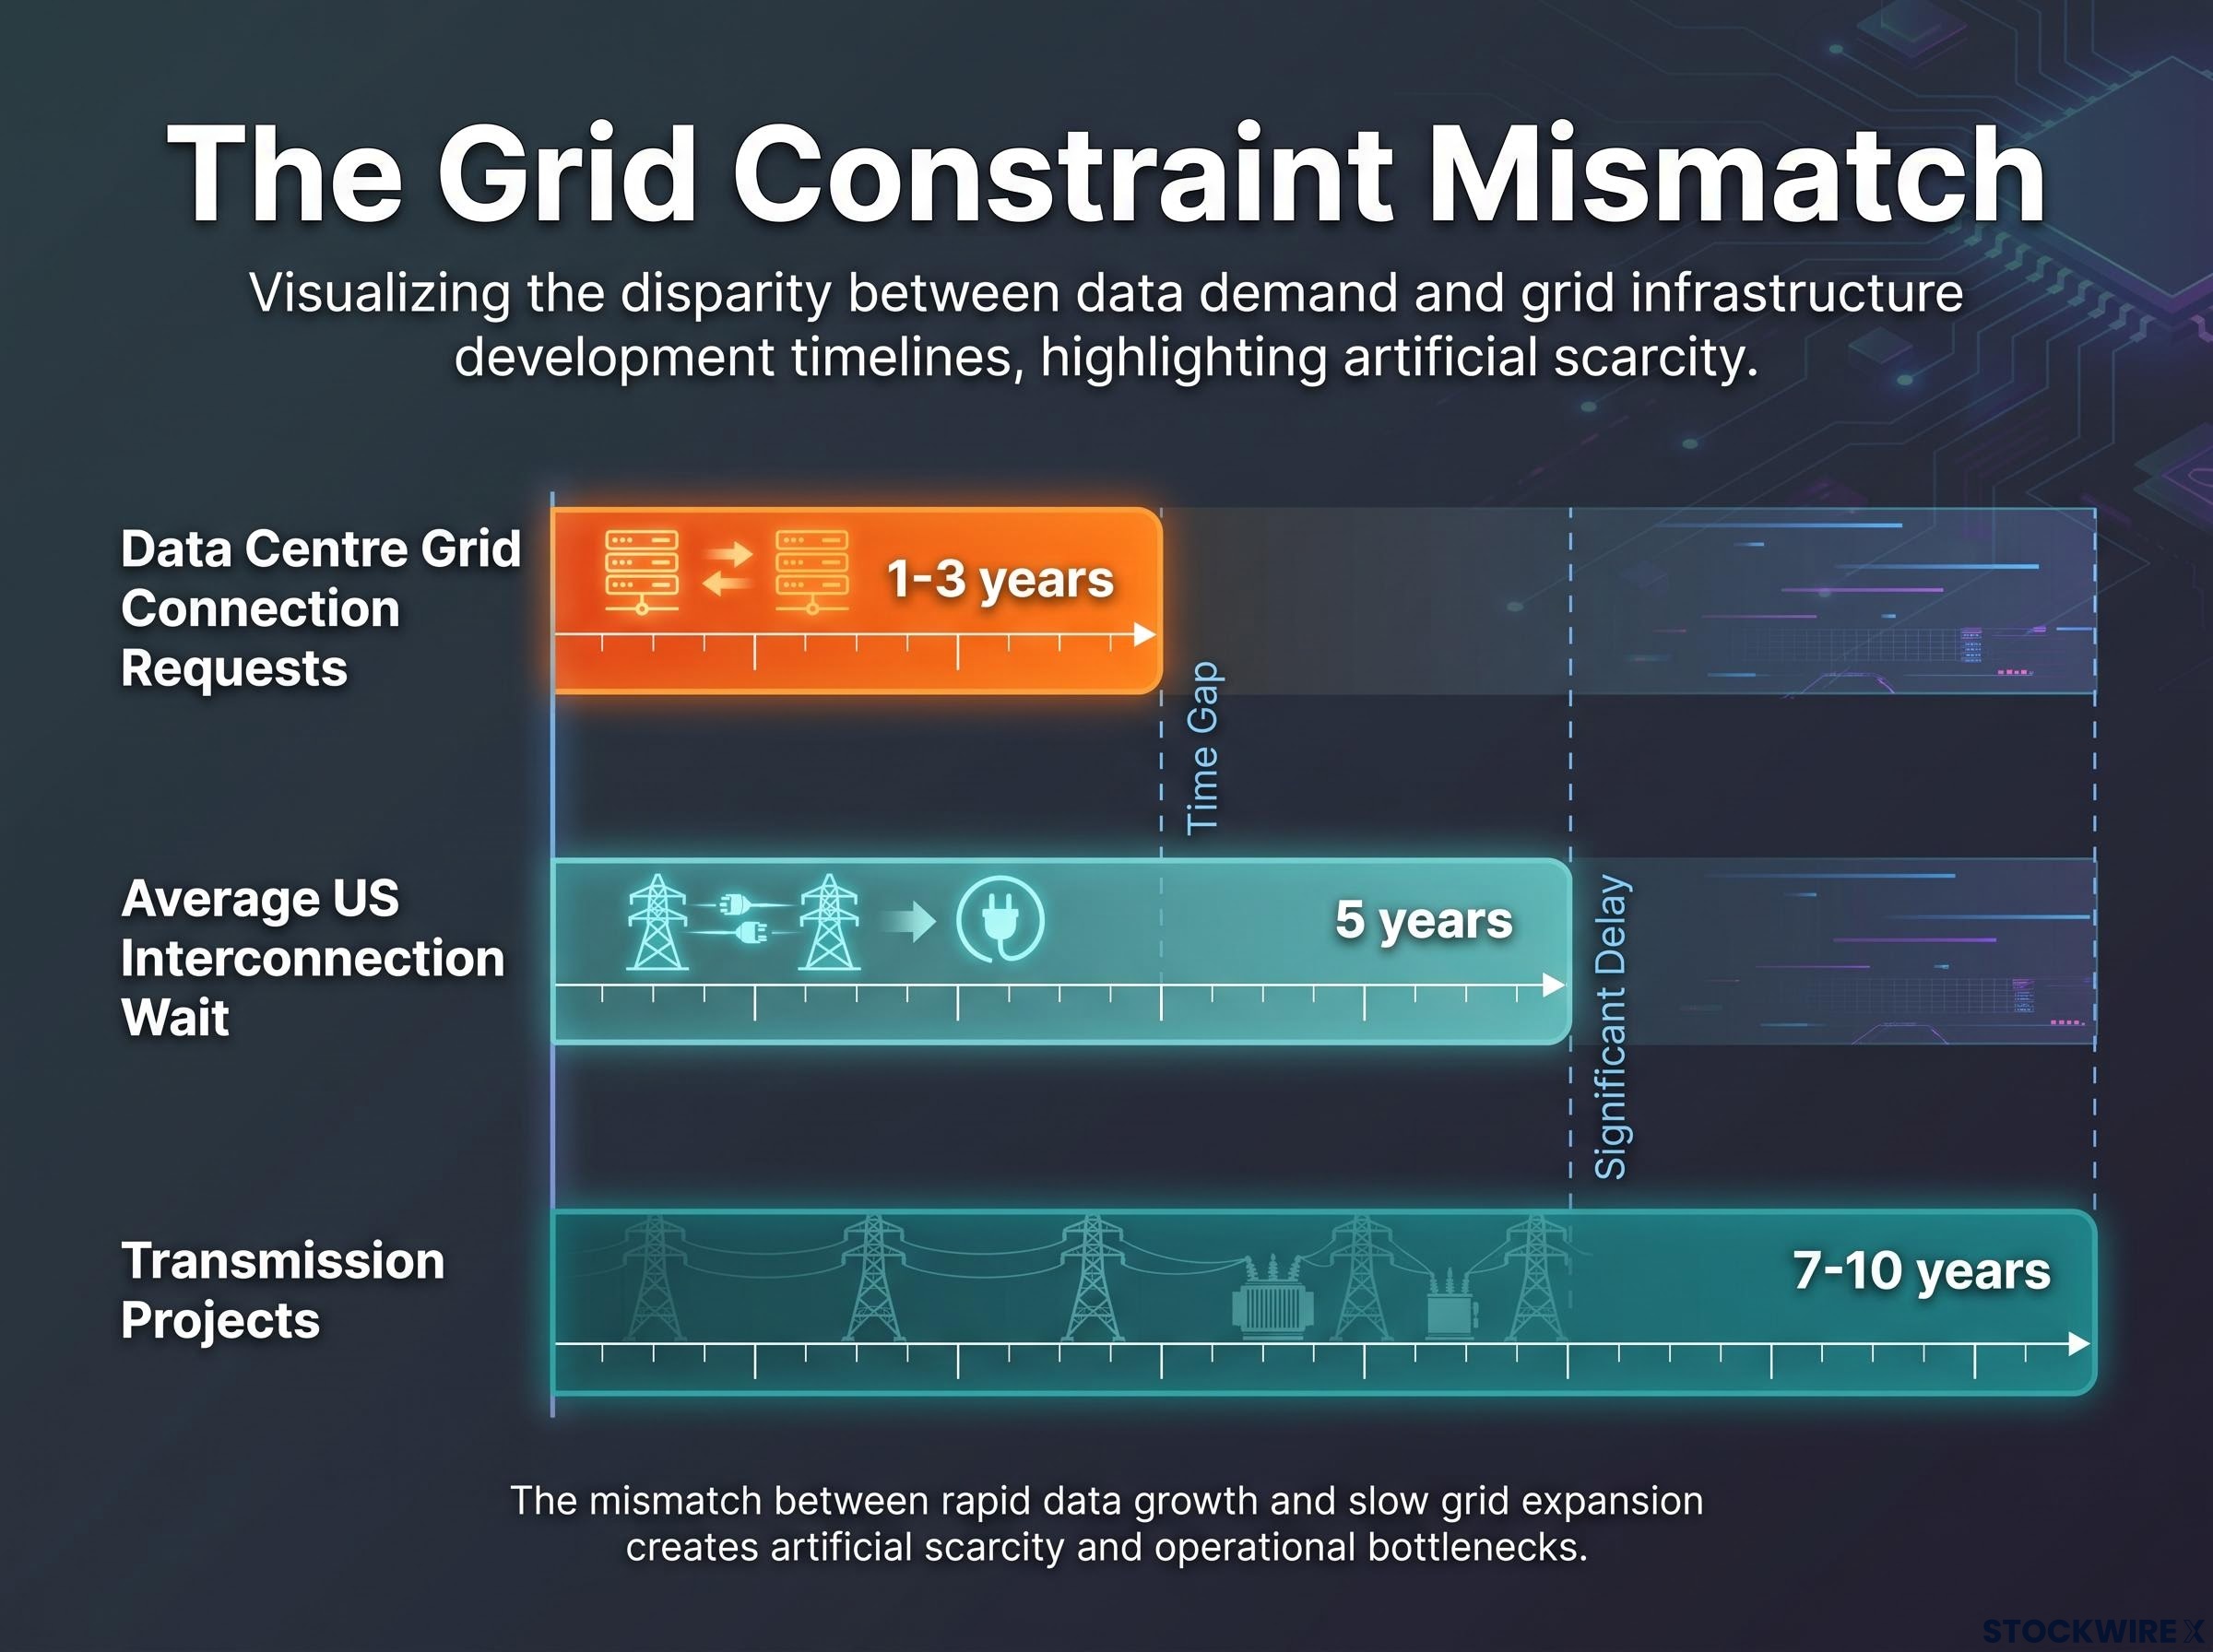
US interconnection wait times have more than doubled over fifteen years to an average of about five years, with nearly 2,300 GW of generation and storage already sitting in the queue. Major grid upgrades run on timelines of 5-10 years.
The mismatch is the whole point. Gigawatt-scale data centres are requesting grid connections within 1-3 years, while the transmission projects to feed them take 7-10 years. That is a structural bottleneck no amount of hyperscaler cash resolves on the deployment timeline they need.
Deloitte’s US infrastructure survey found 72% of executives rate power and grid capacity as very or extremely challenging. For an investor, that artificial scarcity is a tailwind: capital committed to grid infrastructure and power generation faces demand it cannot easily be displaced from, which is precisely what software-layer AI plays cannot claim.
The picks-and-shovels case, built from historical evidence rather than analogy
Picks and shovels. You have heard it a hundred times, usually as a lazy shorthand. The phrase only earns its keep when it is backed by numbers, so here are the numbers.
The picks-and-shovels framing gains analytical precision when mapped across AI supply chain layers, each with structurally different moat types: a GPU designer, a copper miner, and a power utility are all described as AI infrastructure plays, yet they sit at different positions along the value chain with different exposure to the bottleneck that matters most at any given stage of the buildout.
The pattern of suppliers outlasting the competitors they serve is documented across multiple industries:
- Semiconductor equipment: ASML, Applied Materials, and Lam Research sell tools to every chipmaker rather than betting on one. ASML and Tokyo Electron sit upstream at roughly 50% gross margins with recurring service revenue.
- Energy services: During the 1970s commodity boom, oilfield-services firm Schlumberger compounded revenues at 28% per year and earnings at 36% per year by servicing infrastructure rather than owning individual projects.
- Component suppliers: In consumer electronics, battery maker Varta returned 529% post-listing against device maker GN Store Nord’s 146%, showing essential component suppliers can out-earn the downstream brands.
This is not analogy. It is a repeated structural outcome, and it is already investable in AI.
A GWK Investment basket of 18 AI-infrastructure suppliers gained 166% since late 2023, outperforming the S&P 500 at 65% and the S&P 500 Technology Index at 111%.
That figure matters because it required no correct guess about which model developer survives. The suppliers won regardless.
Cybersecurity as the durability signal the model-developer narrative misses
Cybersecurity is where the thesis is playing out in real time, and the logic is clean. Every expansion of cloud footprint adds attack surface, and that attack surface grows with AI adoption no matter which vendor prevails. More surface area equals more to defend, permanently.
The performance data reflects it. The CIBR (First Trust NASDAQ Cybersecurity ETF) posted a 2026 year-to-date return of 40.4% with a one-year return of 37.4%. The BUG (Global X Cybersecurity ETF) delivered a 2026 year-to-date return of 45.57%, rebounding sharply from a negative 2025.
Contrast that with the broader Semiconductor ETF (SMH), which had been in decline since around late June or early July 2026. The market is already differentiating between AI exposure that compounds with adoption and AI exposure that does not.
What this tells you is that the repricing of non-developer AI names has begun. The open question is not whether the market sees it, but whether that repricing has run its course or remains early.
What could go wrong: the risks that honest analysis cannot omit
A thesis you cannot argue against is not a thesis. Three risks deserve genuine weight, and they differ in kind.
- Overbuilding and stranded assets: The Institute for Energy Economics and Financial Analysis (IEEFA), alongside JPMorgan, warns that utilities and data-centre REITs could face stranded costs, with AI capex in many cases outpacing monetisation and heavy tenant concentration among a few hyperscalers amplifying the risk if they change deployment plans.
- Efficiency gains: Machine-learning efficiency has historically improved fast, with the compute needed to reach a given performance level halving roughly every eight months since 2012, which could undercut the demand forecasts the whole infrastructure case rests on.
- Regulatory shift: A recently proposed US House bill would require large AI data centres to bear the full cost of generation and grid upgrades themselves, a legislative direction signal rather than confirmed law, but one that could restructure cost recovery for infrastructure investors.
Regulatory shift risk has already moved from theoretical to active in ways the article’s legislative bill example understates: New York’s Executive Order 62 created the first statewide moratorium on hyperscale data centre construction in US history, Texas hosts an effective interconnection freeze through queue saturation alone, and Maine’s legislature assembled a veto-margin coalition before the ban was narrowly defeated.
The Ratepayer Protection Act, which passed the US House in September 2026, would require data centres drawing 100 MW or more to cover the full incremental cost of grid and generation upgrades, including posting financial assurances, rather than distributing those costs across residential ratepayers.
The efficiency risk is the one to watch most closely.
The IEA’s August 2026 High Efficiency Case projects more than 15% energy savings, pushing global data-centre demand toward a plateau around 700 TWh rather than the near-1,000 TWh reference trajectory.
That is the variable that would falsify the power thesis. If compute-per-watt improves faster than demand grows, the forecasts anchoring these positions move materially, and position sizing should reflect that uncertainty rather than assume the reference case holds.
The overbuilding and regulatory risks are scenario-dependent, contingent on choices hyperscalers and legislators have not yet made. The efficiency risk is structural and continuous. That distinction should shape how you weight each one. Notably, the fact that 72% of executives already flag the power bottleneck cuts both ways: the constraint is real, but a widely known constraint is also, in part, a priced one.
How to position when the thesis is strong but the timeline is uncertain
Pull the three threads together and a single lens emerges. Durable AI returns flow toward physical scarcity (power and grid) and complexity-driven necessity (cybersecurity), not toward winner-takes-all model competition.
The market data underlines why this is differentiated exposure. Technology sits at roughly 40% of S&P 500 weight, with an estimated four of every ten dollars entering the market flowing into the top ten stocks, while breadth deteriorates across the S&P 500, 400, and 600. The crowded trade is the model-developer trade. The infrastructure thesis offers something scarce right now, which is differentiation, and the GWK basket’s 166% return since late 2023 shows it has already delivered without requiring any prediction about which lab survives.
The thesis is strong, but the timeline is genuinely uncertain. Rather than a buy-list, here are three variables to monitor as leading indicators of whether it is holding or shifting:
- Interconnection queue clearance rates. Faster clearance eases the bottleneck and weakens the scarcity tailwind; persistent backlogs confirm it.
- Compute-per-watt efficiency cadence. Improvement slower than demand growth supports the power thesis; a step-change acceleration undermines it.
- AI developer funding continuity. Steady external funding keeps the ecosystem stable; any disruption to the circular financing structure signals stress that could ripple outward.
This is not an argument against AI exposure. It is an argument about where within the AI supply chain the risk-reward favours a finance-educated investor.
For investors wanting a practical framework to separate genuine bottleneck positions from companies that are merely adjacent to one, our deep-dive into AI infrastructure binding constraints walks through a four-question checklist covering constraint validity, commoditisation resistance, customer dependency, and capital return quality.
This article is for informational purposes only and should not be considered financial advice. Investors should conduct their own research and consult with financial professionals before making investment decisions. Past performance does not guarantee future results. Financial projections are subject to market conditions and various risk factors, and forward-looking statements are speculative and subject to change based on market developments.