
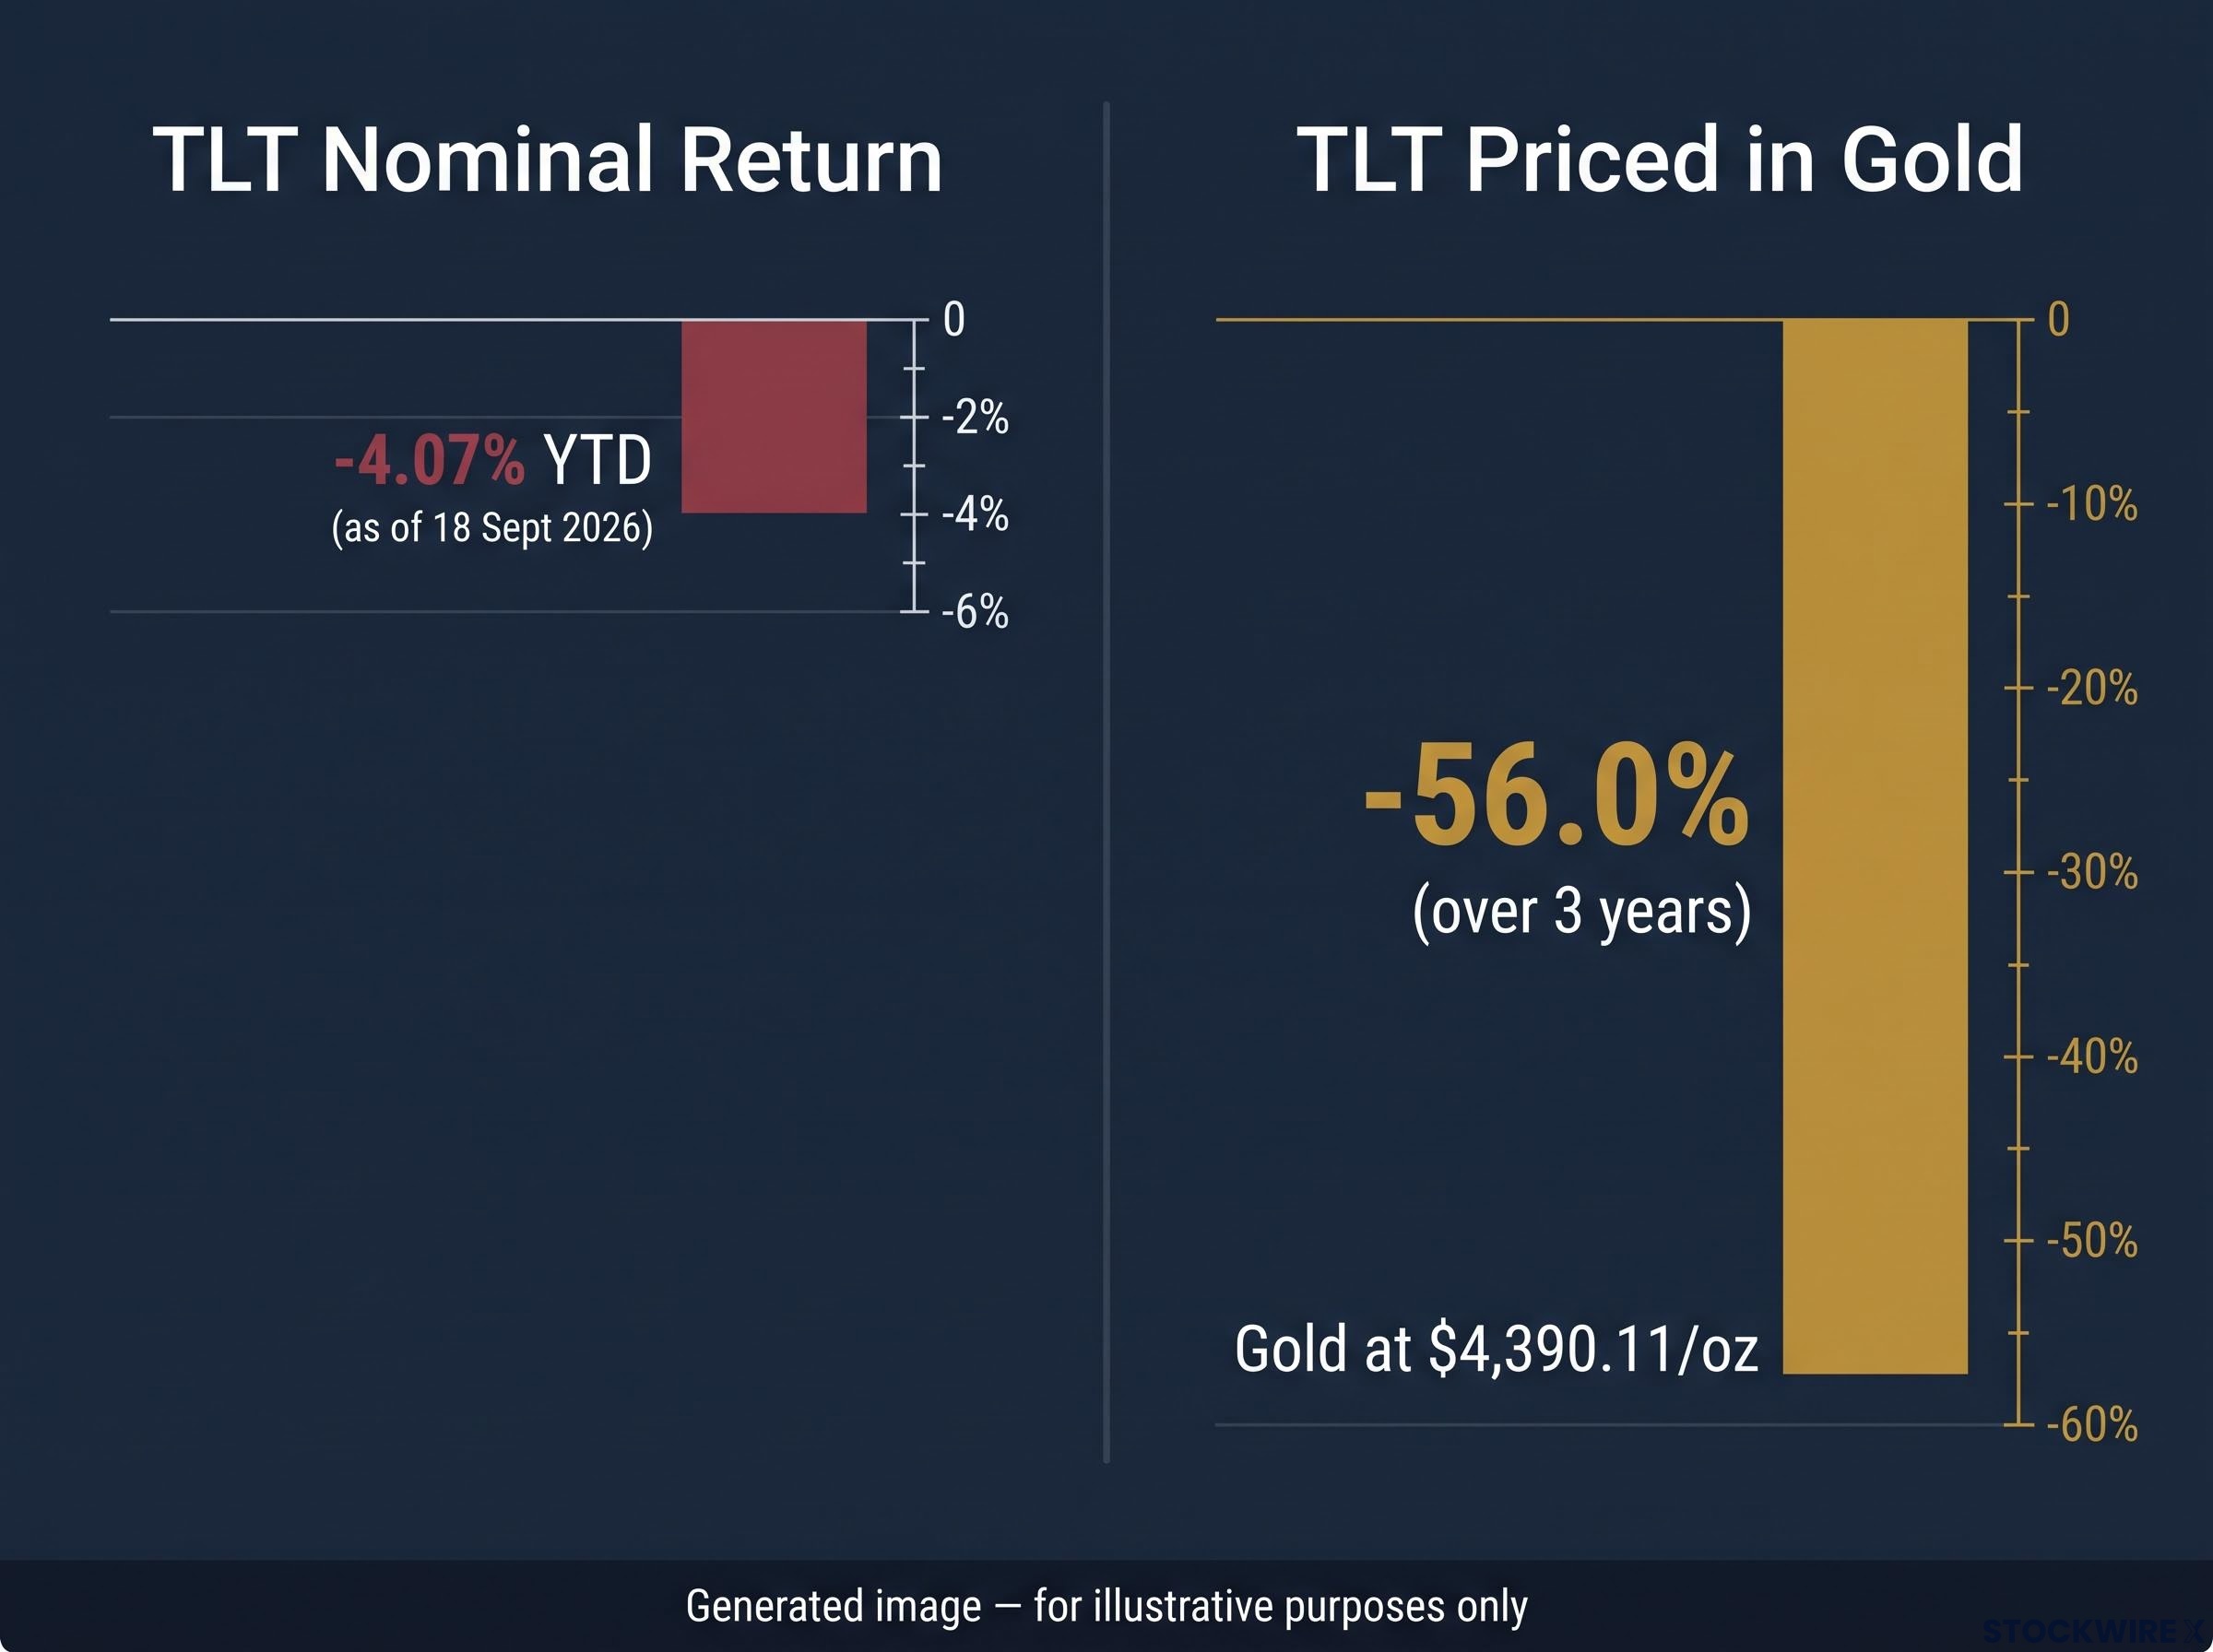
Consider a bond investor who bought TLT, the iShares 20+ Year Treasury Bond ETF, three years ago and left it alone. Checking the terminal in September 2026, the damage looked survivable: down just over 4% for the year. A manageable dent in a supposedly safe holding.
Now measure the same position in gold. Over three years, TLT has returned -56.0% in gold terms. More than half the real purchasing power, gone.
That gap is not a rounding error or a presentation trick. It is a structural feature of measuring returns in a currency that is itself losing value. With headline inflation running at 3.4% year-on-year as of August 2026, the 10-year Treasury yield touching 5.041% in September, and gold trading at $4,390.11 per ounce, the conditions that make nominal returns misleading are not a history lesson. They are present and active.
The comparison of gold vs bonds returns, measured in real purchasing power rather than dollars, is the discipline this analysis builds. After reading, you will have a framework for auditing your own portfolio in real terms, and a clearer view of which asset classes are genuinely preserving wealth versus which ones only appear to be.
What your dollar-denominated returns are not telling you
Start with the number your brokerage shows you. According to BlackRock NAV data, TLT was down 4.07% year-to-date as of 18 September 2026. Unpleasant, but the kind of loss a long-term holder shrugs off as noise.
Then change the ruler.
The same asset, two measuring sticks TLT nominal: -4.07% year-to-date TLT priced in gold: -56.0% over three years
The reason the two figures diverge so violently is that gold roughly doubled over the same three-year window, reaching $4,390.11 per ounce by 18 September 2026. When the denominator doubles, the numerator that looked flat in dollars collapses in real terms. The -56% figure is not a reframing gimmick. It tells you that a holding categorised as safe has destroyed more than half its purchasing power, which should change where it sits in your portfolio taxonomy.
This is what George Noble means when he frames gold as a real unit of account rather than a speculative bet. The point is not that gold will keep rising. The point is that gold has a fixed scarcity property the dollar lacks, which makes it a more honest measuring stick for what your other assets are actually delivering.
Three properties give gold that stability relative to fiat currency:
- A fixed supply ceiling that no policy decision can expand at will
- No central bank discretion over how much is issued
- No counterparty obligation attached to it, unlike a bond or a bank deposit
The intellectual foundation here predates the current cycle. Alan Greenspan’s congressional testimony drew the same distinction, separating the nominal value of government obligations from their real value once inflation is accounted for.
Why the dollar is not a neutral ruler
A measuring stick that shrinks flatters whatever it measures. Price a stagnant asset in a currency losing 3% of its value a year, and the asset appears to hold its ground when it is quietly eroding.
Louis Gave’s distinction between deflationary and inflationary policy environments explains why this matters now. In a deflationary regime, deficits and money creation carry limited consequences. In the inflationary regime the current data describes, the tools that would normally stabilise a currency, fiscal restraint and tighter money, are politically and structurally constrained.
The long-history evidence makes the erosion concrete. Macroradar’s gold versus long-term Treasury total-return ratio reads 464.1, rebased to 100 in 2004. Over two decades, gold’s total return has vastly outpaced long-dated US Treasuries. The dollar ruler has been hiding that gap the entire time.
When big ASX news breaks, our subscribers know first
How rising yields and sticky inflation combine to trap bond investors
The bond investor’s difficulty is not a single bad year. It is a sequence of forces that makes escape structurally hard, even when the headline yield looks attractive enough to tempt buyers back.
Start with duration. Long-dated bonds carry heavy sensitivity to rate moves, so when yields rise, the capital loss on the existing holding can swamp the income the coupon pays. The 10-year Treasury yield peaked at 5.041% on 15 September 2026, its highest since July 2007, before easing to 4.93% by 22 September 2026.
Jim Bianco’s framing reframes what those levels mean. Current rates are not anomalously high. They are reverting toward pre-Global Financial Crisis norms. The suppression of the post-crisis decade was the true anomaly, which means investors waiting for yields to fall back to the 2010s baseline may be waiting for a regime that is not coming back.
The Fed’s shrinking share of outstanding public debt, down from roughly 26% in 2021 to approximately 14% by mid-2026, has reshaped bond market dynamics so that long-term borrowing costs are now set by price-sensitive private buyers rather than central bank intervention, compounding the duration trap the current analysis describes.
The compounding problem is arithmetic. A bondholder earning 5% nominally in a 3.4% inflation environment earns roughly 1.6% in real terms, and that is before any mark-to-market loss if yields continue climbing toward the 6% level the source research characterises as plausible.
| Scenario | Nominal Yield | Inflation Rate | Real Return |
|---|---|---|---|
| Current environment | 5% | 3.4% | ~1.6% |
| Rising-yield scenario | 5% coupon | 3.4%+ | Negative, as principal loss offsets yield income |
| 1970s-analogue stagflation | Elevated | Double digit | Deeply negative |
The trap operates in three steps:
- Yields rise as rates normalise toward pre-crisis levels
- Existing bond prices fall, delivering an immediate mark-to-market loss
- The real yield cushion shrinks as inflation eats into the coupon that remains
BlackRock’s September 2026 commentary anticipates rates staying restrictive well into 2027 under Fed Chair Kevin Warsh, describing the backdrop as sticky headline inflation. With core CPI at 2.4% and headline at 3.4% as of August 2026, and the source research treating a return to the Fed’s 2% target as implausible given labour and commodity supply constraints, the cushion is unlikely to widen soon.
For anyone holding long-duration Treasuries, the math means a 5% yield that looks attractive may deliver close to zero in real terms while carrying real capital loss risk if yields climb further. That is the opposite of what safe is supposed to mean.
What the 1970s and gold’s track record actually teach us (and what they do not)
The strongest evidence for the thesis sits in the 1970s. During that stagflation, bonds delivered deeply negative real returns while real assets ran. Commodities returned 586% over the decade according to RBC Wealth Management, and gold gained roughly 2,300% per Eco3min.
That track record extends past a single decade. Since the end of the gold standard in 1971, gold has delivered approximately 7% annualised. Institutional backing is not fringe: State Street Global Advisors, Allianz Global Investors, and JPMorgan Asset Management all point to gold’s intrinsic worth holding up against inflation and rising debt.
Central bank net purchases above 1,000 tonnes for three consecutive years through 2024 underpin the case for treating gold as a monetary reset asset rather than a peripheral hedge, with gold’s share of official global reserves more than doubling from below 10% in 2015 to over 23% on current estimates.
The inflation-era real return figure State Street, Allianz, and JPMorgan cite historically high average real returns, in some cases up to 13% annualised, for gold during periods of elevated inflation.
Now the complication that keeps this from becoming a naive buy-gold trade. Man Group cautions that gold’s extraordinary 1973 to 1975 gains were heavily shaped by the one-off unwind of the Bretton Woods system. That mechanism cannot be extrapolated mechanically to every inflationary episode.
The environments rhyme in some respects and diverge in others:
- 1970s: Bretton Woods unwind, oil supply shocks, fiscal excess
- Now: Post-quantitative-easing rate normalisation, energy supply shocks, expanding fiscal deficits
The oil shocks and fiscal pressure rhyme. The monetary regime change that supercharged gold’s 1970s run does not have a clean modern equivalent, which is exactly why the historical return should inform position sizing rather than dictate it.
When gold loses its edge
Gold flips from outperformer to laggard under three conditions. First, disinflation, when price pressures fade and the inflation hedge loses its purpose. Second, rising real interest rates driven by a Fed that regains inflation credibility, which raises the opportunity cost of holding a non-yielding asset. Third, liquidity-driven selling in risk-off episodes, when investors dump gold to cover losses elsewhere.
Edward Jones and Hartford Funds note that gold lagged during the moderate inflation of the 1960s, 1980s, and 1990s, precisely the periods when central banks held credibility and real rates rose.
None of these three conditions characterises the base case in the current research. But the read you should take is that gold’s protective power is strongest specifically in the stagflationary regime the evidence identifies as most probable, and weakens fast if that regime gives way to a credibility restoration. The position requires an active macro view, not a passive hold.
What a portfolio designed for this regime actually looks like
The 60/40 portfolio, 60% equities and 40% bonds, was engineered for a specific world. Its failure in the current regime is not bad luck; it is a design mismatch.
The mechanism is correlation. Research from Russell Investments and PortfolioPilot shows that once inflation rises above 2%, stock-bond correlations flip from negative to positive. Equities and bonds fall together, and the diversification that makes the strategy work disappears.
UBS research places the two-month rolling stock-bond correlation at -0.69, the most extreme negative reading since 1996, but that figure is misleading as a comfort signal: the UBS analysis identifies a core PCE level of 3.1% as the threshold above which the correlation flips toward positive territory, and August 2026 core CPI at 2.4% sits close enough to that boundary to make the regime shift a near-term risk rather than a theoretical one.
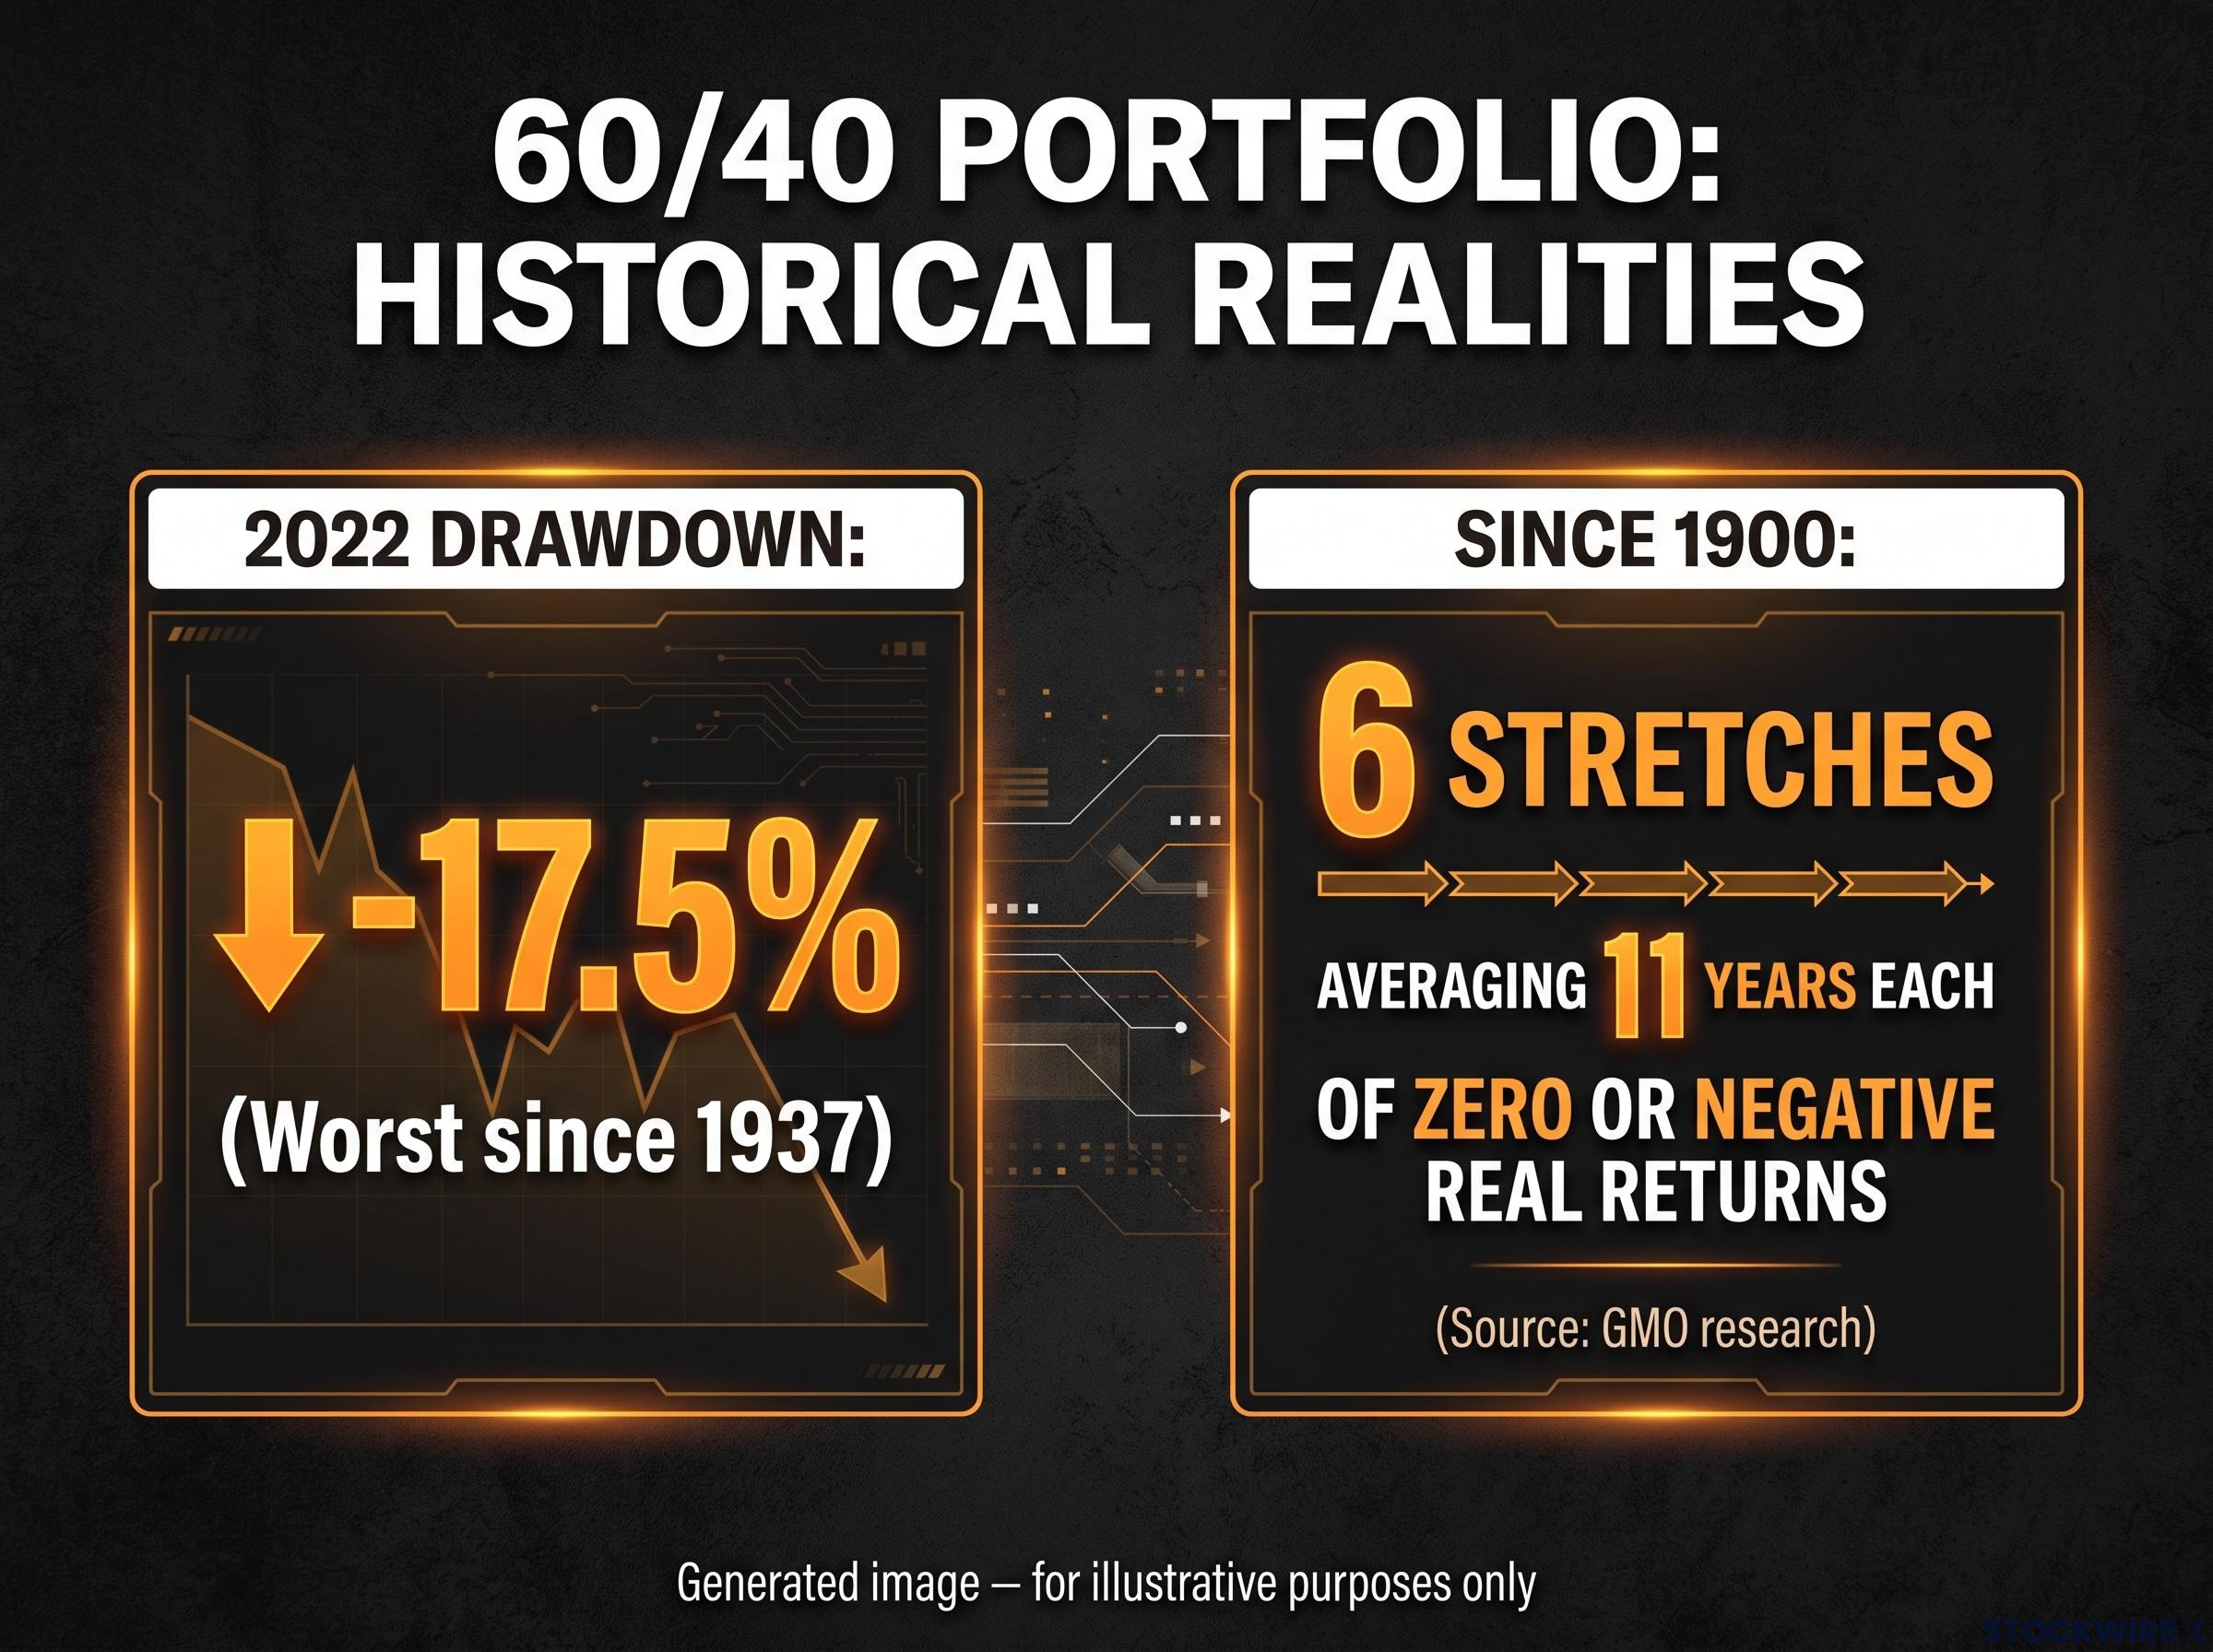
The evidence is recent and severe. In 2022, the 60/40 portfolio fell roughly 17.5%, its worst showing since 1937. GMO research adds the longer view: since 1900, there have been six multi-year stretches, averaging 11 years each, where a US 60/40 broke even or lost money in real terms despite positive nominal returns.
Three specific failures compound in an inflationary regime:
- The correlation shift, which removes the bond hedge exactly when equities fall
- Duration risk, which turns the bond allocation into a source of loss rather than ballast
- Real yield compression, which erodes the income that was supposed to compensate
For a reader holding a conventional 60/40 allocation, the correlation data means the portfolio is not diversified in the way it appears to be. The protection expected from bonds during an equity drawdown is least available precisely when it is needed most.
The research points toward a different architecture, with each holding tied to a specific macro risk.
| Asset Class | Role in Regime Portfolio | Key Risk to Monitor |
|---|---|---|
| Gold | Real unit-of-account anchor against currency debasement | Disinflation and rising real rates |
| Energy equities | Direct beneficiary of the oil and commodity inflation driver | Demand destruction in a deep recession |
| Cash | Optionality and capital preservation for corrections | Erosion of real value if inflation outruns yield |
| Inflation-linked bonds | Supplementary hedge tied directly to CPI | Underperformance if inflation surprises lower |
| Trend-following strategies | Historically reliable stagflation diversifier | Choppy, directionless markets that whipsaw signals |
Energy and gold equities appreciated roughly 30% to 50% during the current year per the source research, which is why the framework favours them alongside cash while explicitly avoiding consumer discretionary and long-duration technology equities. Amundi and Man Group treat inflation-linked bonds, short-duration Treasuries, and trend-following as pragmatic supplements, not core replacements. BofA and Morgan Stanley reinforce the caution that long-duration bonds offer little yield cushion but large downside in a rising-rate, high-inflation setting.
What the original 60/40 assumption required to hold
The strategy was built for a regime of low, stable inflation, where bonds and equities moved in opposite directions because a rate cut could reliably rescue a falling equity market. That inverse relationship was the entire engine.
It breaks down when inflation forces the Fed to hold rates elevated even as growth slows. The rate-cut rescue is off the table, and the bond-as-ballast mechanism vanishes with it.
Measuring your portfolio in a currency that is losing value is itself a risk management failure
Step back and the argument resolves into something simpler than a trade idea. When the unit of account is itself depreciating, every nominal return figure is a partial fiction. The investor who never adjusts for this is making an implicit bet on continued dollar stability that the current macro environment does not support.
The evidence for that erosion is not subtle.
Two decades in one number Macroradar’s gold versus long-term Treasury total-return ratio reads 464.1, rebased to 100 in 2004.
State Street, Allianz, and JPMorgan converge on the same underlying point: gold’s intrinsic worth is not eroded by inflation or rising debt, which gives it a floor that nominal bonds structurally lack.
Dollar reserve diversification has crossed a structural threshold: the OMFIF Global Public Investor survey released 30 June 2026, covering 90 sovereign institutions with over $7 trillion in assets, recorded the first-ever instance of net dollar-reduction intent outnumbering net dollar-increase intent among central banks, a shift that gives the gold-as-unit-of-account argument a demand floor that prior cycles lacked.
The analysis implies three concrete actions and one honest caveat. The actions:
- Run a gold-denominated return audit on your fixed-income and multi-asset holdings, so you can see what they deliver in real purchasing power rather than dollars
- Assess your real-asset allocation as a percentage of the total portfolio, and judge whether it is proportionate to the probability you assign to the stagflationary base case
- Identify the macro signal, a shift in the inflation-expectations regime, that would trigger a reassessment of the position
The caveat is the open question the evidence cannot close. Whether this inflationary regime is durable enough to justify a sustained real-asset overweight, or whether a Fed credibility event would shift the calculus quickly, is unresolved. BlackRock’s September 2026 framing of sticky headline inflation under Kevin Warsh is the operative base case through at least 2027, but base cases change.
Adopting a gold-denominated lens is not a call on gold. It is a discipline for seeing clearly what your existing allocations are actually delivering.
This article is for informational purposes only and should not be considered financial advice. Investors should conduct their own research and consult with financial professionals before making investment decisions.
Past performance does not guarantee future results. Financial projections are subject to market conditions and various risk factors. Forward-looking statements are speculative and subject to change based on market developments.