Nearly $18.5 million in Intel put options changed hands within about five minutes of each other. The natural reading is that someone is betting the stock has further to fall. One of those two trades, though, looks closer to an insurance policy than a wager.
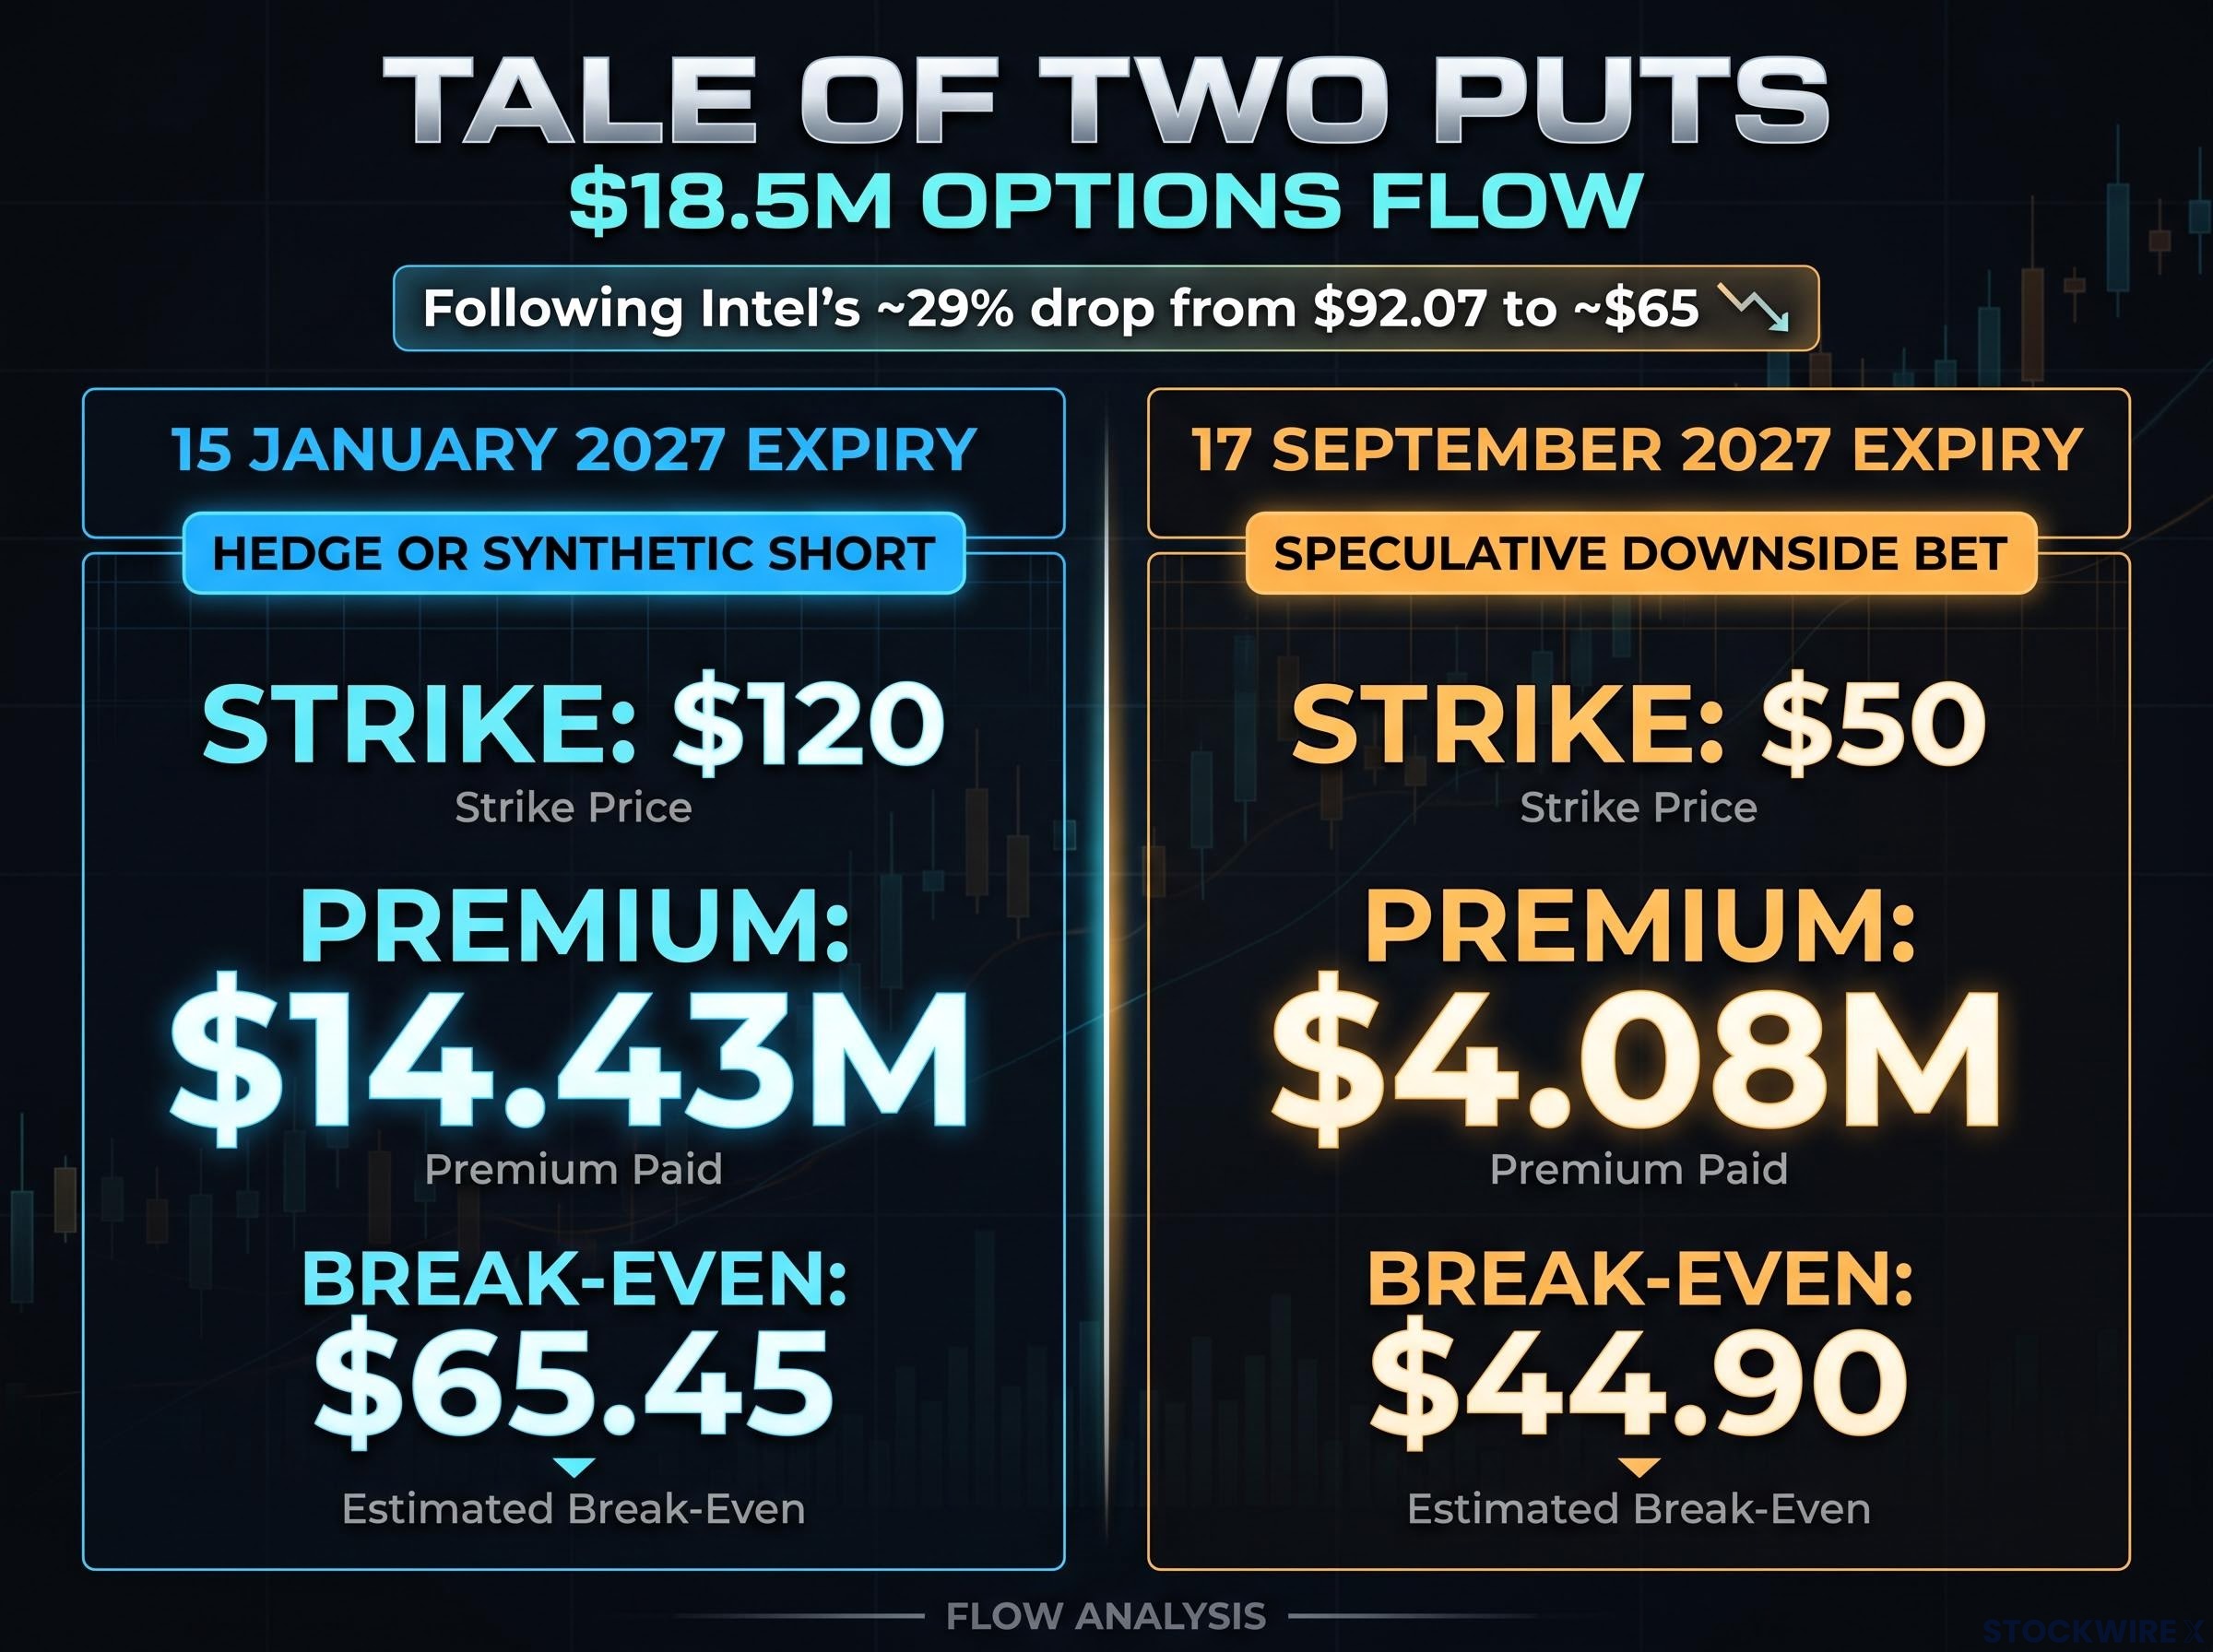
The trades landed yesterday, Friday 30 October 2026, as Intel shares dropped roughly 29%, from about $92.07 to around $65. CNBC described it as the company’s worst session since 1974.
Large options prints after a crash always draw attention. The tape records what traded, but it does not record why.
Here is a method for reading unusual options flow, so you can tell a hedge from a speculative bet and judge how much weight a headline print actually deserves.
What two large put trades hit the tape after Intel’s plunge?
The sell-off followed a weaker-than-expected fourth-quarter outlook. Intel pointed to shrinking PC demand, manufacturing bottlenecks and higher spending needs. The price moves, which sources round slightly differently, were:
- Prior close (29 October): about $92.07
- Intraday low area: a fall of roughly 29-31%, with Benzinga reporting $65.25 in morning trading
- Close: about $65.76, down 28.6%, per FinanceFeeds (CNBC rounds this to about $65 and 29%)
Into that fall came two put trades. They look similar on a headline but tell you very different amounts.
| Expiry | Strike | Contracts | Price | Premium |
|---|---|---|---|---|
| 15 January 2027 | $120 | About 2,643 (at the ask) | About $54.55 | About $14.43M |
| 17 September 2027 | $50 | 8,000 (crossed, side unknown) | About $5.10 | About $4.08M |
The January trade executed at the ask, the price sellers are asking. That points to an eager buyer. The September trade was a cross, a pre-arranged trade between two parties, so nobody outside the deal knows which side initiated it.
There is also a verification gap. No named publication independently confirmed the exact contract counts or the resulting open-interest changes, so treat these figures as reported by Tasty Life’s “Signal Versus Noise” trading segment.
The $18.5 million headline tells you money moved fast. It does not tell you which way anyone is positioned, and that distinction matters for everything that follows.
When big ASX news breaks, our subscribers know first
How does a deep in-the-money put work, and why would anyone buy one?
A put option gives you the right to sell a stock at a set price, called the strike, before a set date. The January trade is the more interesting one, because it is mostly stock exposure in different packaging.
If you are newer to contracts, how put options work is worth pinning down first: one contract controls 100 shares, and the premium you pay is the most you can lose, which is why defined risk shapes every use case below.
Intrinsic value, time value and delta in plain terms
Intrinsic value is the amount a put is worth if exercised right now: the strike minus the share price. With Intel near $65.45, the $120 put carries roughly $54.55 of intrinsic value. That is almost the whole premium.
Time value is whatever you pay above intrinsic value for the chance that things move further in your favour before expiry. The original source put it at about $0.42, against $54.13 intrinsic. A simplified calculation gives near zero.
Delta measures how much an option’s price moves for each $1 move in the stock. This put’s delta sits near -1.00, so it gains about a dollar for every dollar Intel falls, much like a short stock position.
The break-even point: $120 minus $54.55 gives roughly $65.45. The January put pays off at about where Intel already traded. It does not need another crash.
A buyer’s maximum loss is the premium paid, unlike an uncovered short sale, where losses can keep growing if the stock rallies. That defined risk opens up several uses:
- Portfolio insurance: a price floor on shares you already own.
- Stock replacement or synthetic short: short-like exposure without borrowing shares.
- Defined-risk speculation: a bearish bet with a capped loss.
- Protection without selling: useful when selling shares creates tax or operational problems.
- One leg of a spread or risk reversal: part of a larger, possibly neutral, position.
If you hold a large stock position after a shock, this is the logic of a floor you can buy without selling. Recognising it stops you reading every big put as a prediction.
Why the $50 put is a different animal
With Intel near $65.23 when it crossed, the September $50 put was out of the money: it had no intrinsic value at all. Its entire $5.10 price was time value, paid for roughly 322 days of possibility.
Its delta was far less negative, so it moves less with each dollar of share price. Break-even sits near $44.90, which needs roughly a further 31% fall. That is a genuine bet on more downside, if someone bought it.
What can the tape actually tell you, and what can’t it?
It is tempting to stack the clues into a verdict. Each clue, taken in turn, has an innocent alternative.
| Evidence | May suggest | Why not conclusive |
|---|---|---|
| Trade at the ask | Aggressive buying | Could be hedging stock; the seller may be a market maker |
| Trade at the bid | Put selling, often bullish or for income | Could be someone closing a long put |
| Cross | Negotiated institutional trade | Direction usually unknown; other legs may be hidden |
| Volume above open interest | New positions opening | Could be closings, rolls or repeated executions |
| Large deep in-the-money put | Hedge, synthetic short or insurance | High delta signals exposure management, not a crash bet |
Open interest is the number of option contracts still open at the end of a day. The Options Industry Council and the Options Clearing Corporation (OCC) both treat it as a simple count. It does not identify buyers or sellers, and it updates only after trades clear overnight.
Volume measures activity, while next-day open interest shows whether exposure was actually created; flat or falling open interest after a heavy print usually points to closing, rolling or offsetting legs rather than fresh positioning.
Cboe adds two cautions. Heavy deep in-the-money volume without an open-interest rise can reflect large players managing early-assignment risk, and market makers hedge dynamically rather than adopting the customer’s view.
Other distortions to keep in mind:
- Multi-leg packages: one leg can look bearish while the full trade is neutral.
- Dealer delta hedging: dealers buy or sell shares as deltas shift, which can move the stock itself.
- Stale information: trades placed after a 29% fall may react to news already in the price.
Reading the September cross
The $50 line traded 13,312 contracts against open interest of 3,737. Volume more than three times the existing positions hints that new ones opened. It does not prove it, and the next day’s open-interest update is the data that clarifies it.
What research says about options flow as a signal
Work by Pan and Poteshman, and studies on option-induced order imbalance, found that options volume can carry information about future returns. Cao, Chen and Griffin found option net volume added little beyond stock volume, and Muravyev showed imbalances can reflect dealer inventory rather than insight.
The fair reading is that aggregated, repeated activity may carry signal, but one or two prints do not. Even a large surge in put volume can mean the opposite of fear: in the August 2024 sell-off, Interactive Brokers reported heavy put selling from dip buyers.
Treat a single unusual print as a question to investigate, not a signal to follow.
Where do analyst downgrades fit alongside the options flow?
The options tape is ambiguous. Analyst revisions stand on firmer ground, because they rest on earnings estimates, demand, guidance and valuation.
| Firm | Action | Prior target | New target |
|---|---|---|---|
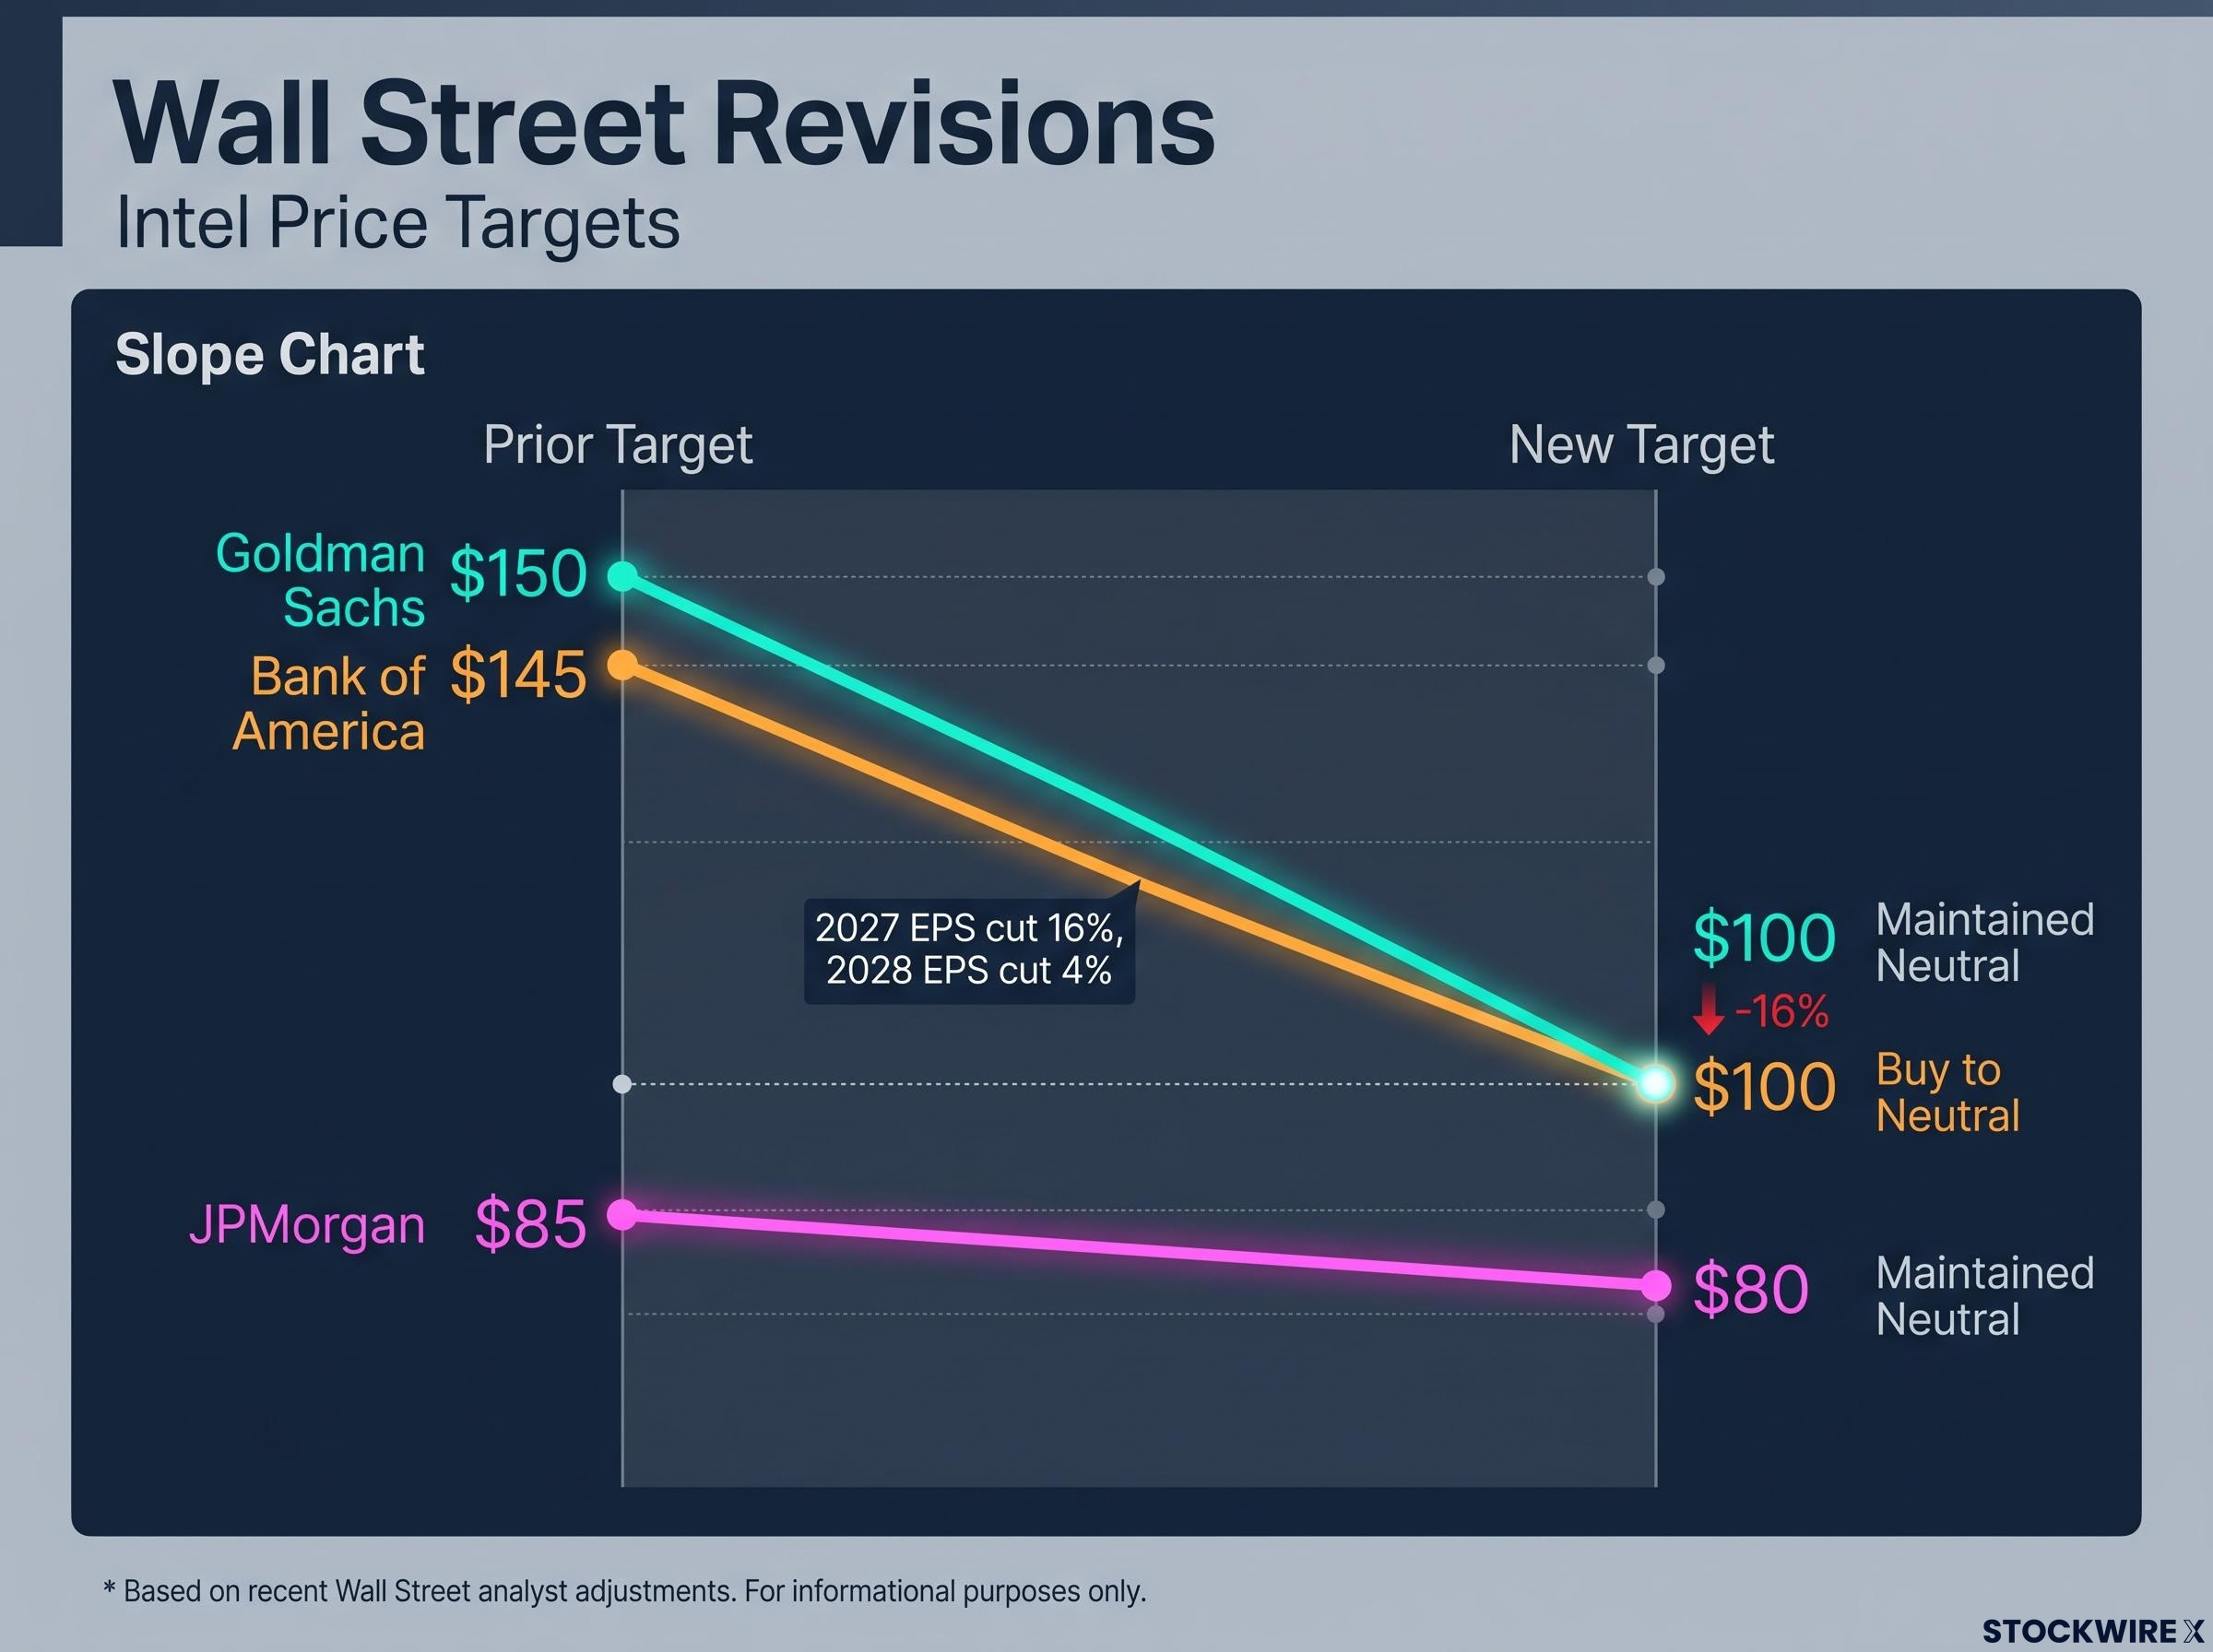
| Bank of America | Buy to Neutral | $145 | $100 |
| JPMorgan | Maintained Neutral | $85 | $80 |
| Goldman Sachs | Maintained Neutral | $150 | $100 |
Bank of America’s Vivek Arya pointed to sharply lower PC shipments, supply constraints and a delayed turnaround, according to CNBC, Business Insider and the News & Observer.
Bank of America’s estimate cuts: 2027 earnings per share (EPS) lowered by 16%, and 2028 EPS by 4%.
Intel reportedly warned the PC slowdown could run into at least the first half of 2027. Together, the three firms’ moves show Wall Street re-rating the fundamentals after the guidance reset.
Analyst work on fundamentals also feeds into semiconductor cycle timing, where Truist argues chip stocks have typically peaked about a quarter after revenue growth peaks, which frames how much weight earnings revisions deserve.
Neither source tells you where the stock goes next. Downgrades do not prove Intel has bottomed, and the options flow does not prove anyone expects $50.
When both are loud, weigh the analyst work as a view on earnings and the options print as a clue about risk positioning. Then decide which question you are actually trying to answer.
This article is for informational purposes only and should not be considered financial advice. Investors should conduct their own research and consult with financial professionals before making investment decisions.
A practical checklist for the next unusual options headline
Run any big print through these six checks:
- Check the side. Ask, bid or cross.
- Check the strike against the share price. In or out of the money.
- Compute the break-even. Does it need a further move at all?
- Compare volume with next-day open interest. Did positions actually open?
- Ask whether a hedge explains it. Deep in-the-money often means protection.
- Weigh it against fundamentals. Analyst revisions answer a different question.
As of 31 October 2026, two things remain unresolved: who initiated the $50 cross, and whether the open-interest update confirms new positions in that line. That open-interest figure is the single number worth watching next.