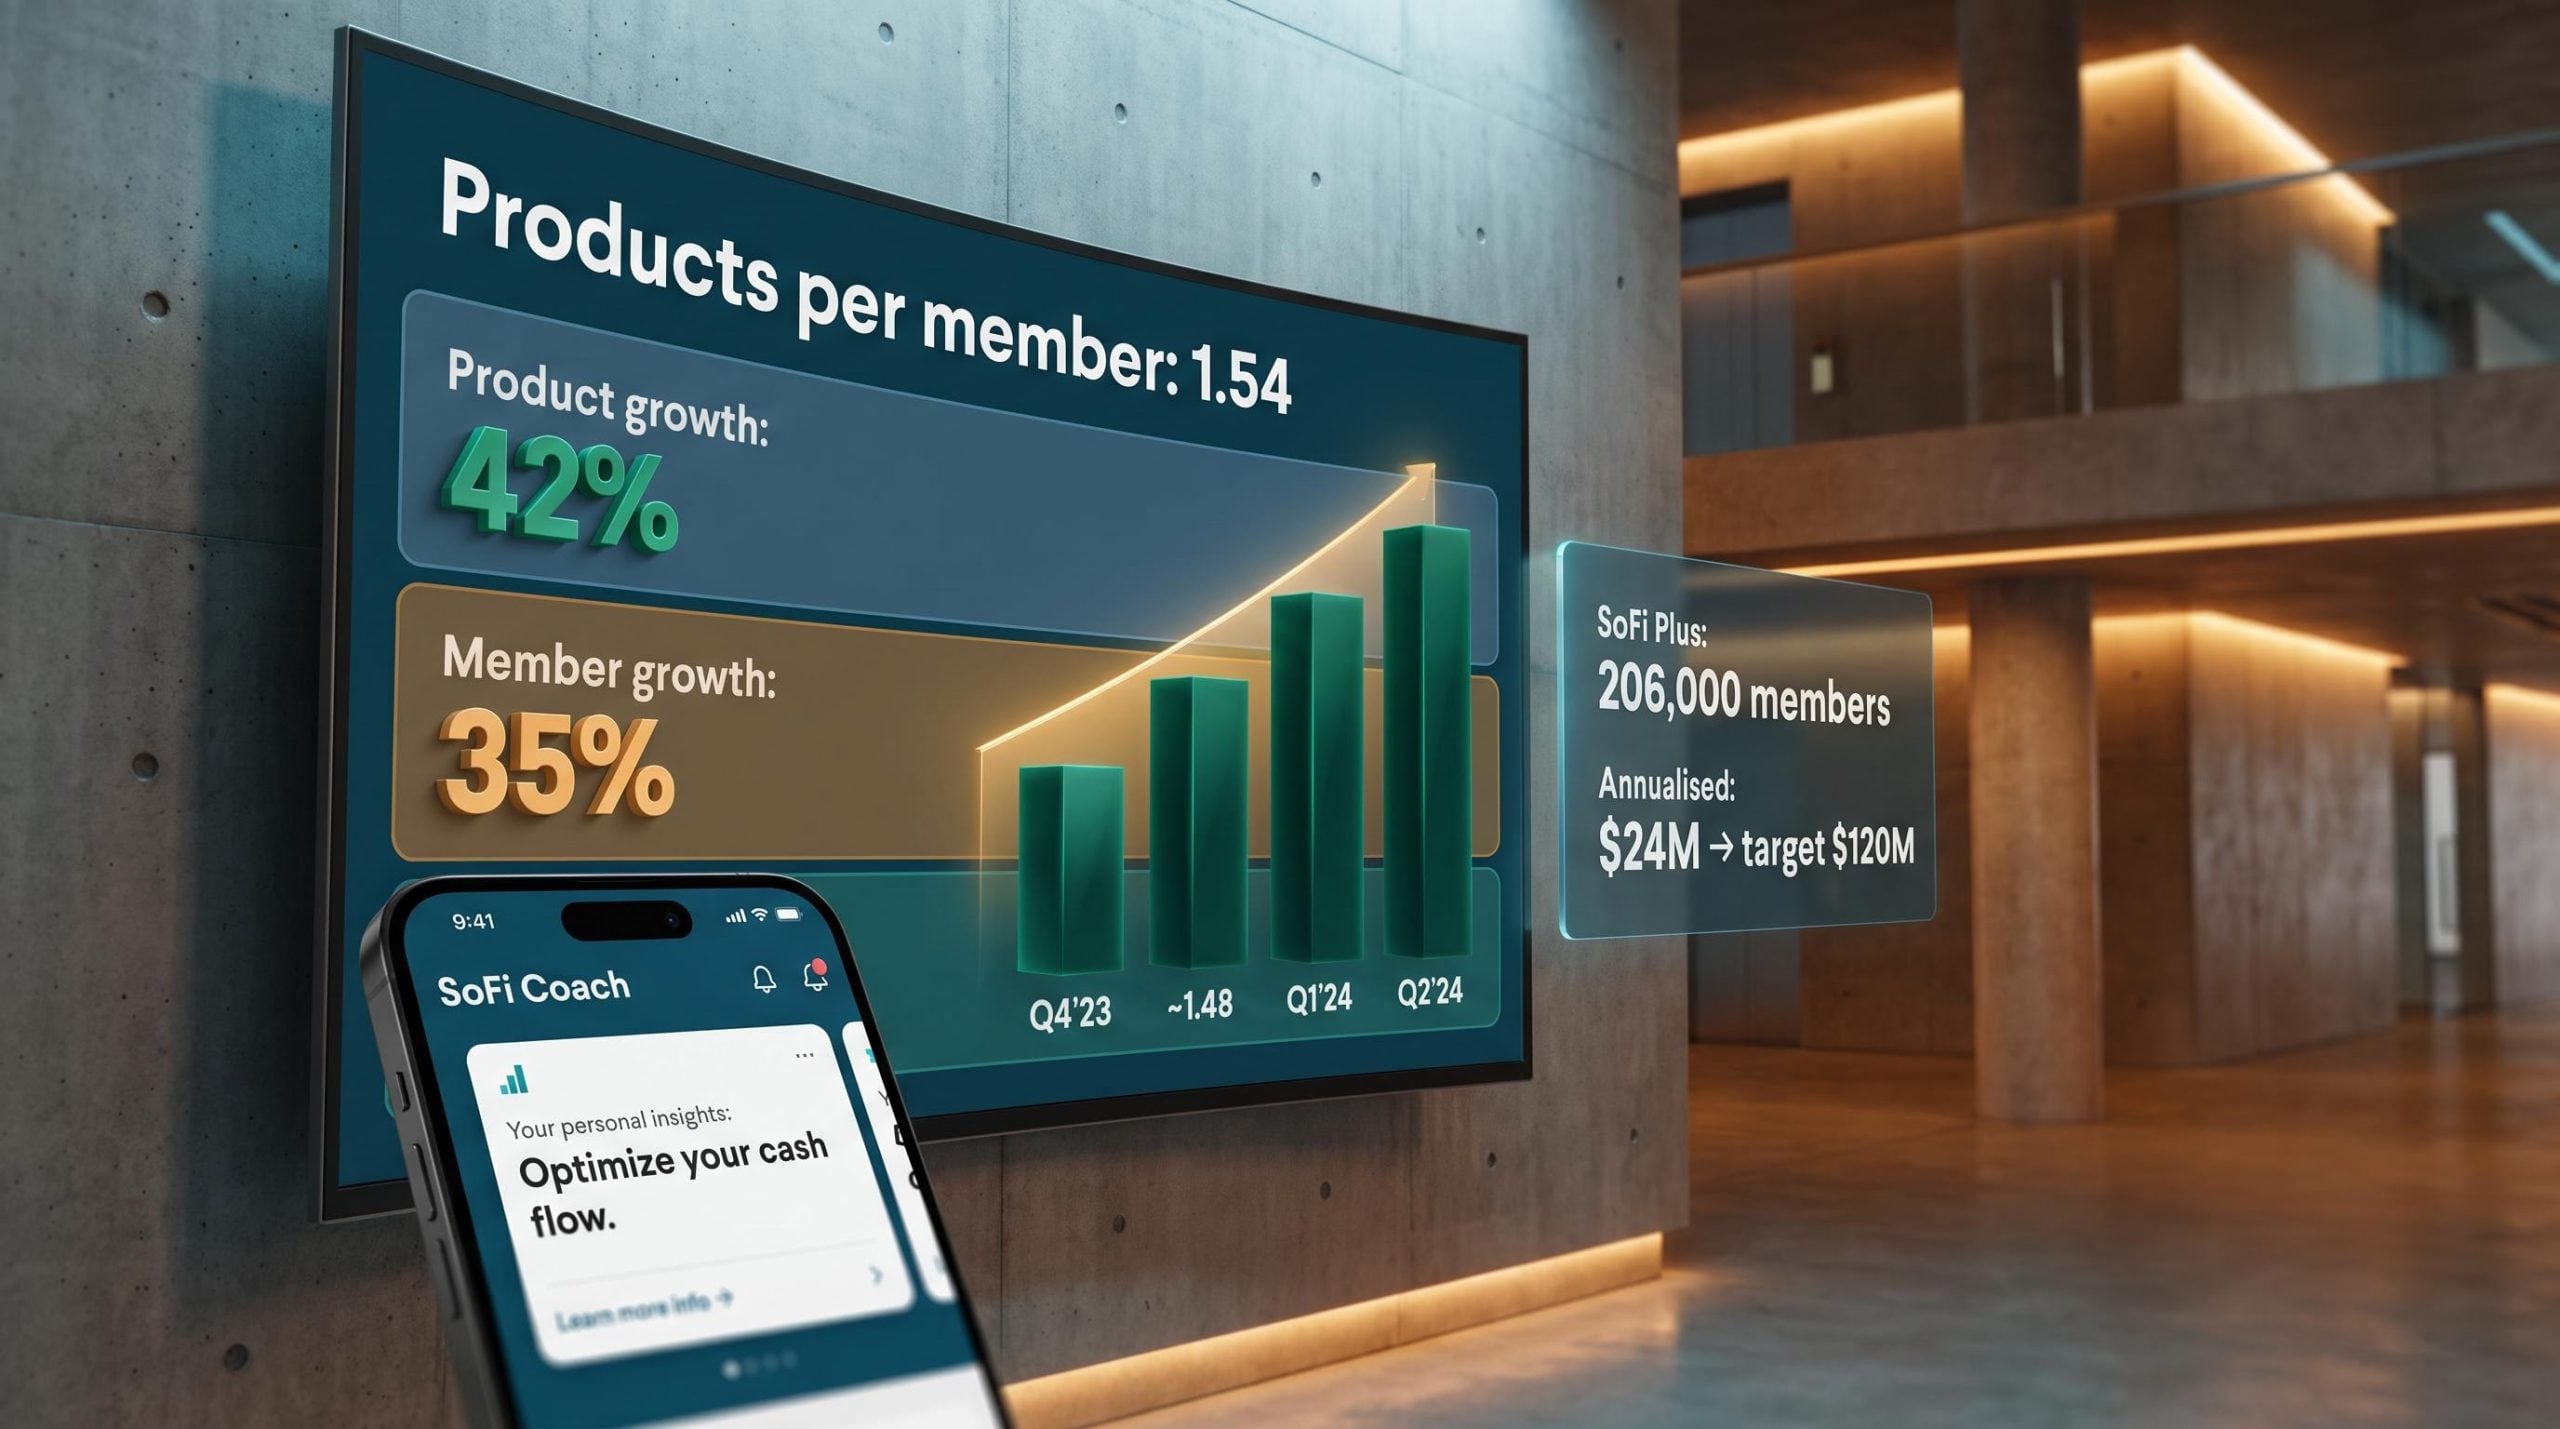
SoFi’s products grew 42% in Q2 while its members grew 35%. That is not a rounding difference. It is a structural gap, and it tells you something specific about where the company’s growth is actually coming from.
The tension sits between two models. Acquisition-led growth scales by spending more to bring new members through the door. Compounding growth scales by making every existing member worth more over time. SoFi is visibly shifting from the first to the second, and the Q2 data is the clearest evidence yet that the shift is gaining traction.
Here is the actual internal machinery driving that gap: the subscription layer concentrating high-value members, the AI infrastructure converting data into product adoption, the credit card and SMB lending initiatives stress-testing the thesis in new verticals, and the specific metrics that will confirm whether the system compounds as designed.
The economic logic behind products-per-member growth
The financial services productivity loop is the framework that ties all of SoFi’s recent initiatives together. The logic is straightforward: when an existing checking customer adds a loan, an investing account, or a credit card, SoFi earns incremental revenue without paying a second customer acquisition cost (the marketing spend required to bring in a new member). Variable profit contribution per member rises. Marketing spend per member stays flat.
That reframes how every marketing dollar should be evaluated. A dollar spent on in-app awareness or personalisation has higher return on investment than a dollar spent on external acquisition, because it drives product adoption without additional acquisition cost.
The super-app monetisation model, in which a single platform layers subscriptions, interchange, lending spread, and advisory fees across a shared member base, is being tested simultaneously by multiple challengers in different markets, each using product bundling to lower effective customer acquisition cost over a member’s lifetime.
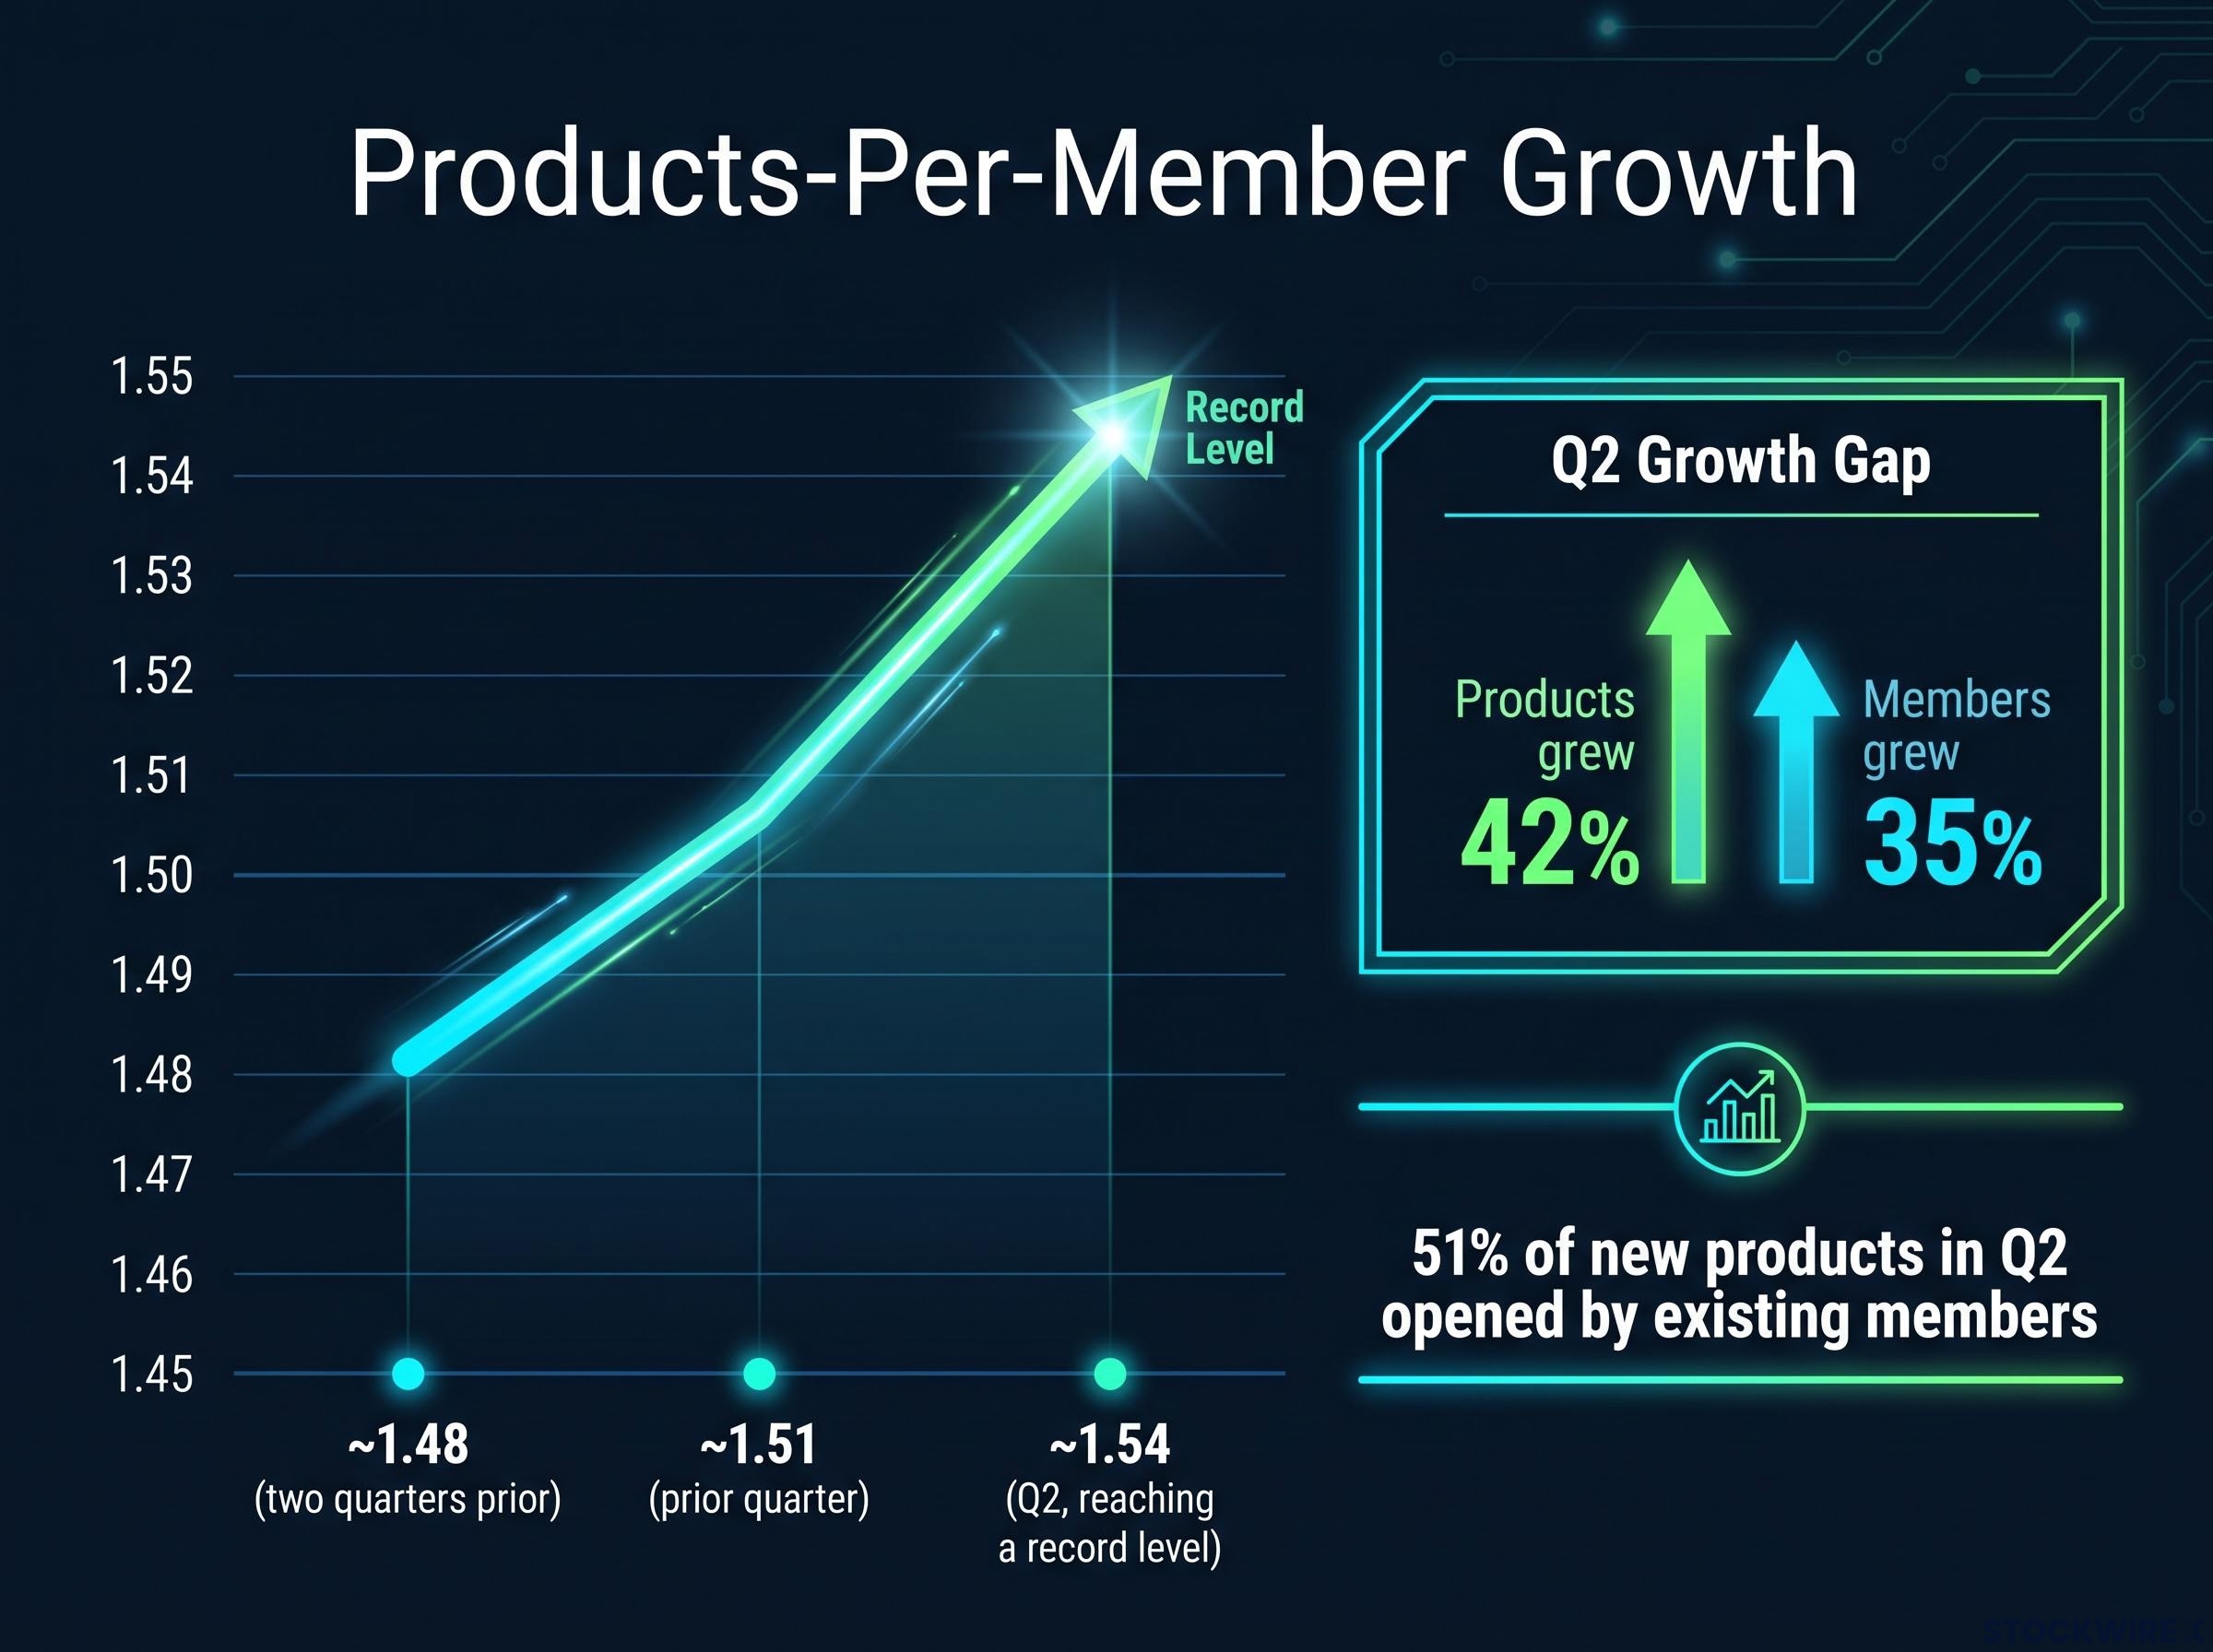
The Q2 data grounds the logic. Members grew 35%. Products grew 42%. 51% of new products opened in the quarter were opened by existing members. Products-per-member hit an all-time high:
- ~1.48 (two quarters prior)
- ~1.51 (one quarter prior)
- ~1.54 (Q2, reaching a record level)
51% of new products opened in Q2 were opened by existing members.
| Quarter | Products per member | Key driver |
|---|---|---|
| Two quarters prior | ~1.48 | Baseline cross-sell activity |
| Prior quarter | ~1.51 | SoFi Plus relaunch and rising product awareness |
| Q2 (current) | ~1.54 (all-time high) | 51% of new products from existing members |
The cohort data sharpens the picture further. Looking back at the Q1 2021 cohort, the subset of those members who held SoFi Money as a primary account saw their average product count rise by a full additional product across the period. That tells you past acquisition spend keeps generating returns years later, which means SoFi’s historical customer acquisition cost is structurally cheaper than it looks on any single-period income statement.
When big ASX news breaks, our subscribers know first
SoFi Plus as a relationship-deepening subscription
SoFi Plus is a $10-per-month subscription layer offering more than 20 benefits across SoFi’s product suite:
- Higher savings APY tiers
- 1% match on eligible non-retirement investing deposits
- Enhanced credit card rewards
- Rate discounts on personal loans
- Mortgage and home equity perks
- Unlimited access to financial planners
- Experiential benefits including sports events and concerts
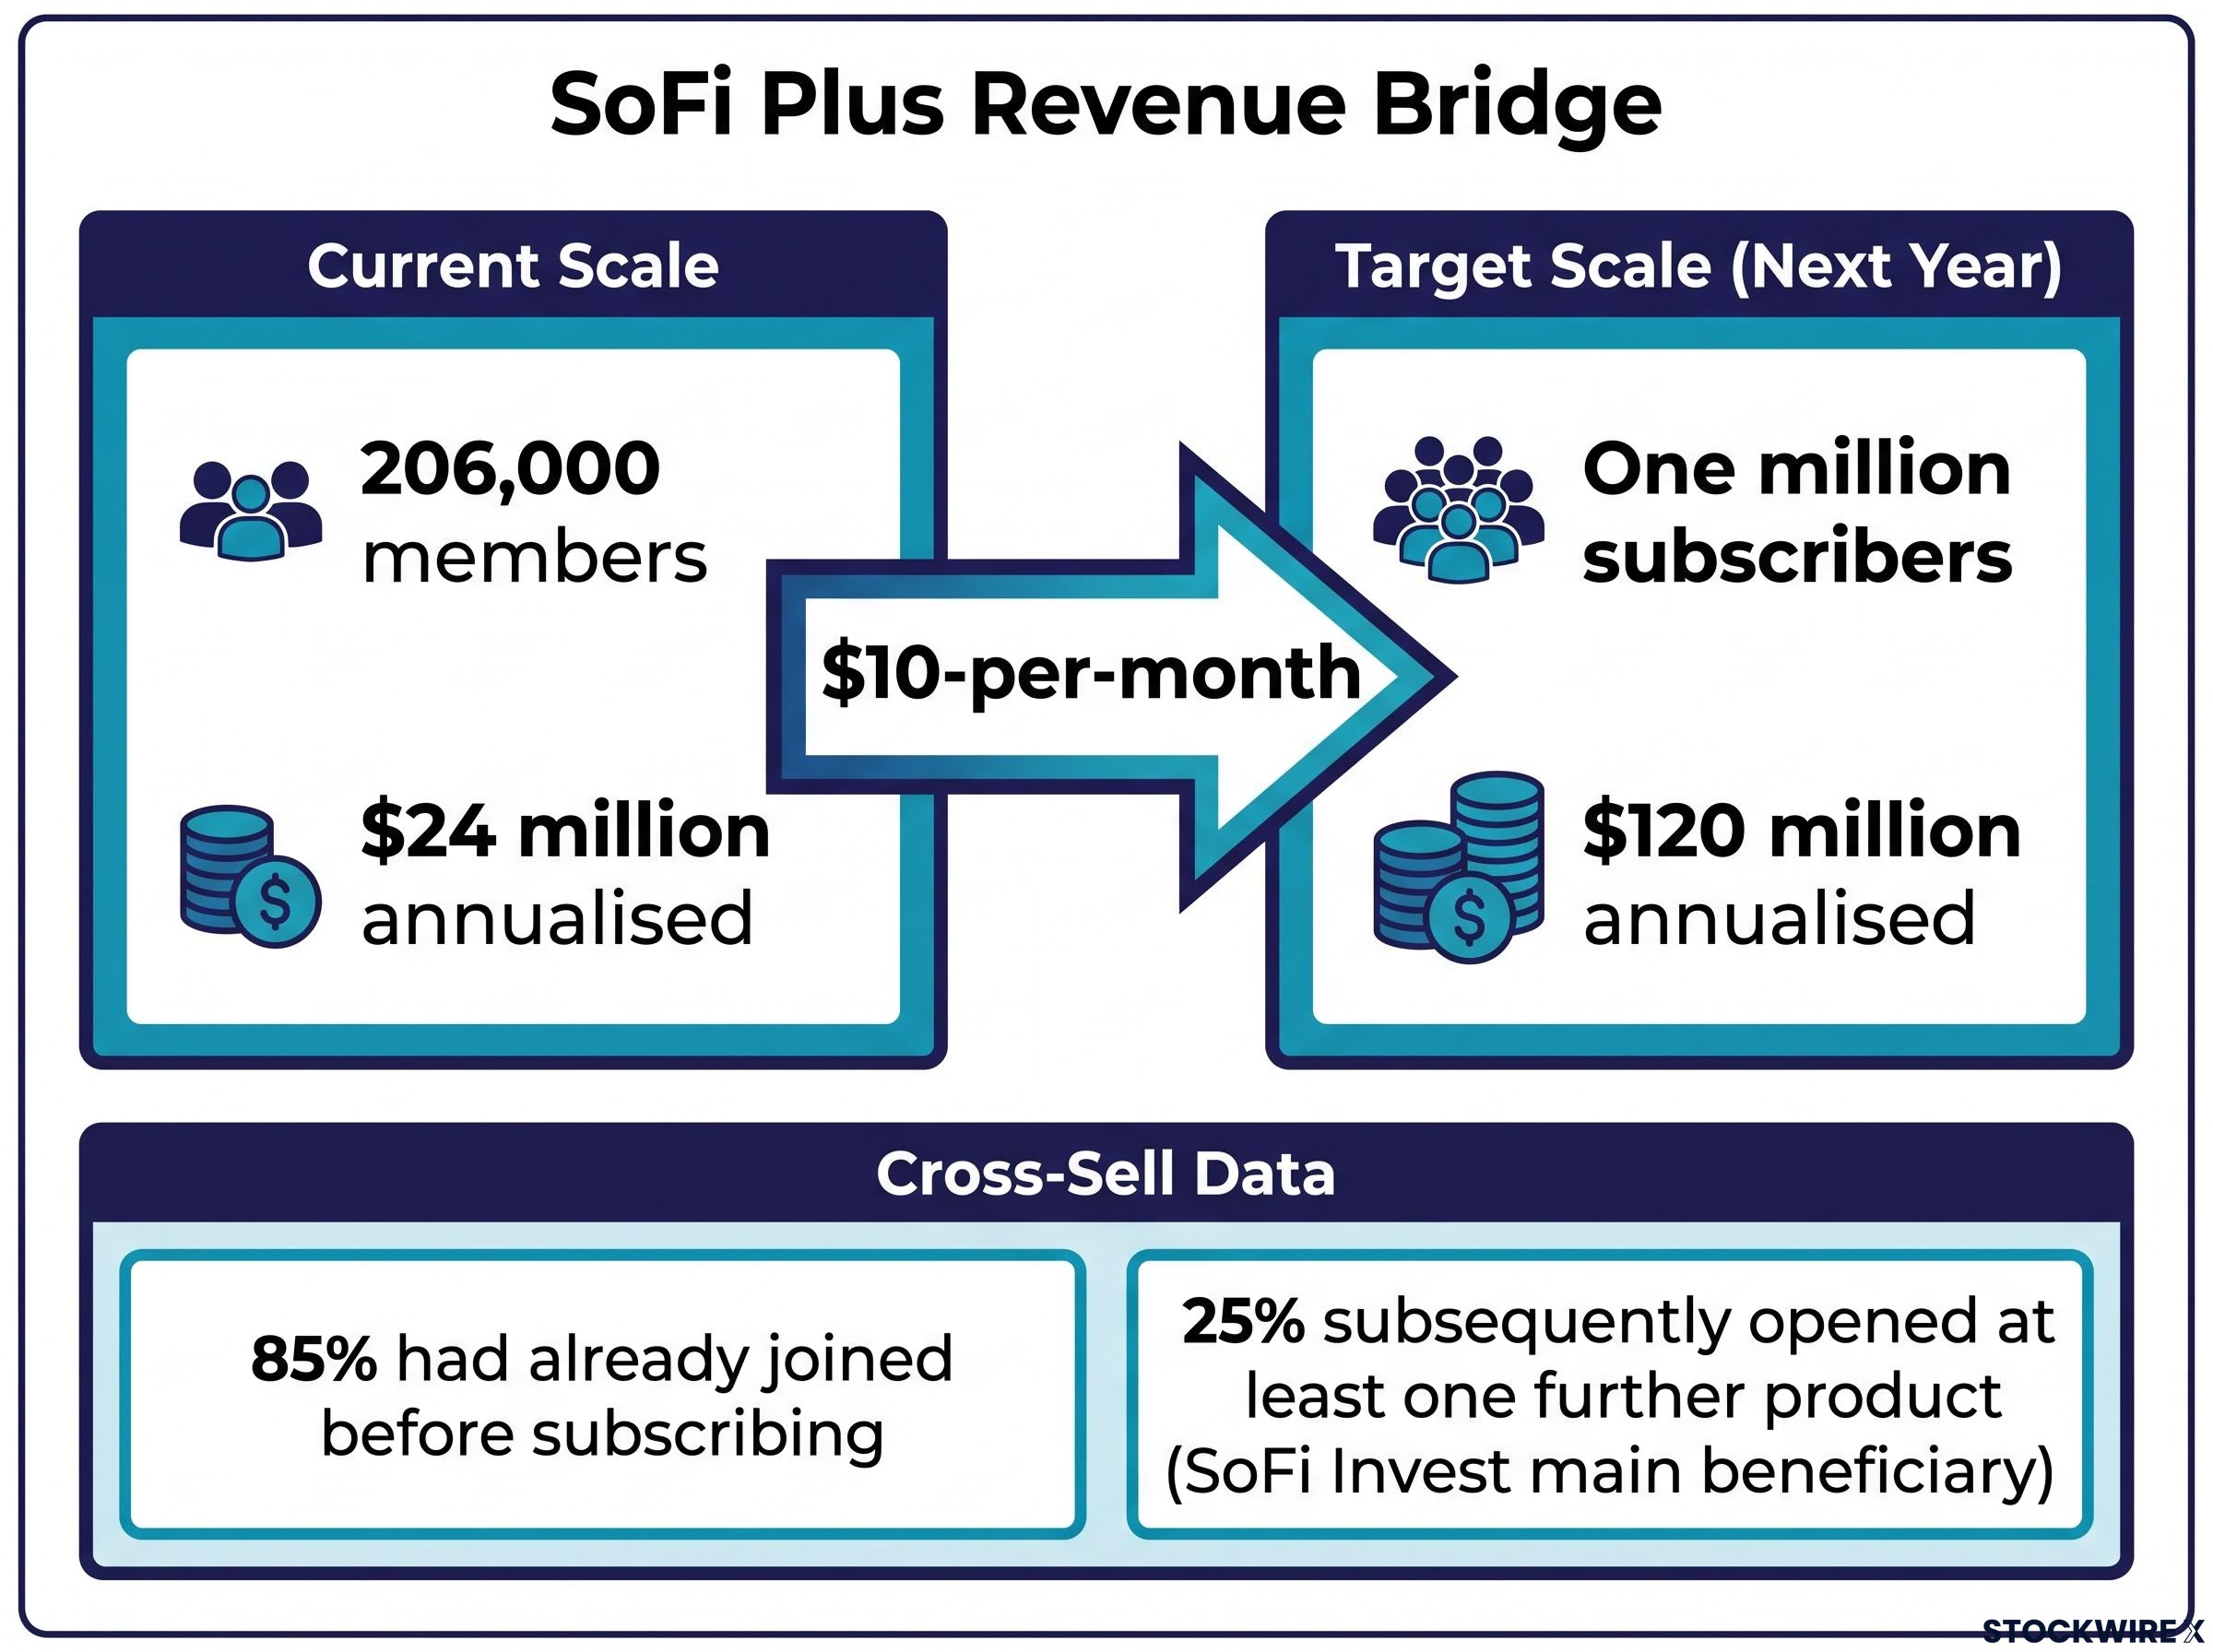
Each enrolled member contributes roughly $120 per year to the subscription line. With current enrolment sitting at approximately 206,000 members, that works out to around $24 million on an annualised basis. SoFi’s stated target is to reach approximately one million subscribers within the next year, which would lift that annualised figure to around $120 million.
The revenue bridge: approximately $24 million annualised today versus approximately $120 million at target scale.
The subscription fee is interesting. The cross-sell conversion data is more interesting.
What the enrollment data reveals about cross-sell conversion
Roughly 85% of current SoFi Plus members had already joined SoFi before subscribing to Plus. This composition indicates that Plus is functioning as a relationship concentrator rather than a new-member acquisition vehicle, drawing in existing members and prompting deeper engagement across the product suite.
Among those pre-existing members who joined Plus, around 25% subsequently opened at least one further product, with SoFi Invest emerging as the main beneficiary of that downstream activity. That 25% conversion rate is the metric that determines whether Plus earns its place as a cross-sell catalyst rather than a simple revenue add-on. SoFi is also rolling SoFi Coach out to Plus members first, reinforcing the subscription tier as the premium advisory layer.
The gap between $24 million today and $120 million at target scale shows how much of the Plus revenue story is still ahead. But the cross-sell data already tells you the mechanism is working at current scale.
The economics of freemium-to-subscription conversion visible in Life360’s 2025 results illustrate the same dynamic SoFi is engineering through Plus: pricing power and subscriber growth can accelerate simultaneously when the product suite creates genuine lock-in rather than relying on discount-driven upgrades.
How SoFi Coach turns member data into product adoption at near-zero marginal cost
SoFi Coach is not a chatbot. It is a personalised cross-sell engine with the appearance of financial advice, and that distinction matters for the economics of the entire system.
Coach is an AI-powered guide embedded in the SoFi app that analyses a member’s own account data to surface personalised financial insights and product suggestions. The team that built it operated with minimal resources across a roughly six-month development window, delivering a broad member rollout in Q3 of the current year. CEO Anthony Noto has noted that he went into his own product test expecting little and came away concluding the output was genuinely strong, well beyond what he had anticipated.
Noto noted that he had low expectations going in but was persuaded of Coach’s quality after personally testing it, describing the experience as substantially exceeding what he anticipated.
Because Coach is tied to SoFi’s internal data rather than generic prompts, it can identify idle cash earning low yield, high-interest debt that could be refinanced, or inconsistent investing behaviour, then surface suggestions that feel like rational advice rather than advertising.
Current capabilities:
- Spending and saving pattern analysis
- Budgeting and investing guidance using transaction history and balances
- Granular transaction breakdowns by merchant, vendor, and individual household spender
- In-chat money movement and troubleshooting
Roadmap capabilities:
- Account origination directly within the chat interface
- Redeploying idle funds into yield-bearing products
- Guidance on refinancing existing debt at reduced rates
- Setting up systematic, diversified investment contributions
For anyone evaluating SoFi’s long-term economics, Coach represents the closest thing to a free marginal cross-sell salesperson: every personalised insight generated by existing member data is also a low-friction, high-relevance product opportunity with no incremental acquisition cost. The transition from Coach as a member benefit to Coach as scalable infrastructure is what makes this analytically significant.
Proprietary data as a competitive moat behaves differently across financial services businesses: platforms where AI operates on internally generated transactional data tend to produce more defensible recommendation quality than those relying on licensed third-party data sets, because the underlying input cannot be commoditised away.
Two proof points where the strategy is being stress-tested
The productivity loop works in SoFi’s core consumer banking and lending products. The credit card restructuring and the SMB lending expansion test whether it holds in new verticals.
| Initiative | Current status | Key metric | Strategic function |
|---|---|---|---|
| Credit card (back book) | Profitable as of most recent reporting | Former losses of a few hundred million dollars resolved | Legacy remediation; clears path for front book |
| Credit card (front book) | Investment-phase; overall segment negative | 18-36 month J-curve to expected profitability | High-frequency engagement surface; spending data feeds Coach |
| SMB lending | Direct origination recently launched | Multi-billion dollar platform partnerships announced | Dual-relationship member acquisition at zero consumer CAC |
Credit card: from loss-generating legacy portfolio to investment-phase profitability
Under a previous management team, the credit card portfolio accumulated losses that management has described as perpetual in character, reaching a cumulative figure of a few hundred million dollars before the programme was stopped and the book restructured. The work to rehabilitate that legacy portfolio has now borne out, with the back book having turned profitable as of the most recent reporting period.
New front book originations follow a different pattern: a standard J-curve in which early acquisition and seasoning costs weigh on results before the cohorts mature into positive returns, which management anticipates occurring within an 18-36 month window. The overall credit card segment contribution remains negative in the interim, though management characterises the current drag as a planned investment phase rather than evidence of a structural problem.
Consumer credit deterioration in the broader US lending market creates a meaningful external variable for SoFi’s J-curve thesis: front book credit card cohorts maturing over an 18-36 month window will season through whatever credit environment emerges across 2026-2027, making macro credit conditions a direct input into the profitability timeline management has outlined.
Cards matter beyond interchange revenue. Annualised card spending reached approximately $28 billion, and interchange revenue was reported at approximately $40 million for the quarter (debit and credit combined). But the strategic value sits in engagement: members interact with their card constantly, keeping SoFi top of mind, and the granular spending data feeds directly into Coach, sharpening recommendations across loans, savings, and investing.
SMB lending: importing the consumer cross-sell playbook into business banking
The SMB opportunity came into focus during the COVID-19 pandemic. The volume of PPP loan enquiries that arrived from SoFi’s existing member base made clear that a meaningful portion of those members were running small businesses. Initially, SoFi responded by building out a comparison marketplace under the Lantern brand, where applicants could be matched with third-party lenders in exchange for referral fees. The business has since moved beyond that intermediary role: direct origination is now live, having launched within the past several weeks, supported by loan platform business arrangements with institutional funding partners. Several multi-billion dollar partnerships have been announced, along with at least one further arrangement that has not been publicly named, reported to be in the several-hundred-million-dollar range.
The dual-relationship dynamic is the compounding mechanism. Business owners who enter through an SMB loan often become SoFi consumer members as well, bringing personal checking, saving, investing, and lending relationships alongside their business needs. The consumer acquisition cost on these members is effectively zero because the business relationship comes first. Over time, SoFi intends to add SMB checking, savings, and additional banking services, mirroring the consumer playbook.
The FDIC small business lending survey documents how deeply personal and business banking relationships tend to overlap for small business owners, reinforcing why SoFi’s dual-relationship model, where a business loan functions as a zero-cost entry point for consumer product adoption, is structurally sound rather than speculative.
A reader evaluating SoFi’s reported earnings should understand that current period losses in both credit cards and SMB lending reflect deliberate near-term profit compression in exchange for long-term member depth, not structural failure.
The metrics that will confirm or challenge the thesis
The analysis above describes a system. Whether the system compounds as designed depends on five signals, listed in priority order:
- Products-per-member and its cohort breakdown: The sequential improvement to 1.54 is the current benchmark. The cohort compounding behaviour in older member classes is the most meaningful long-horizon signal.
- SoFi Plus subscriber trajectory toward one million: The path from approximately 206,000 to one million subscribers is the clearest external milestone for subscription-led cross-sell traction.
- Coach engagement-to-product conversion rates: How frequently AI-driven suggestions convert into actual product actions will determine whether Coach functions as infrastructure or remains a feature.
- Credit card front book cohort profitability: The 18-36 month J-curve sets a timeframe. Cohort-level economics after seasoning will validate or undermine the investment-phase framing.
- SMB lending attach rates into consumer products: Direct origination launched recently. Attach rates into consumer products are not yet reported.
The path from $24 million to $120 million in annualised SoFi Plus revenue is the most visible near-term signal of whether the subscription cross-sell model is gaining traction.
If products-per-member continues rising while member growth moderates, the data will confirm that SoFi is successfully extracting more value from its existing base rather than masking slower growth with broader member counts. That is the confirmation signal worth waiting for.
What the shift from breadth to depth means for SoFi’s long-term economics
These are not five parallel initiatives. They are a single compounding system:
- Productivity loop: the economic logic (1.54 products per member, 42% product growth versus 35% member growth)
- SoFi Plus: the relationship concentrator (206,000 members, $24 million annualised, targeting $120 million)
- Coach: the data-to-adoption engine (Q3 broad launch, near-zero marginal cost per insight)
- Credit card: the engagement surface (back book profitable, front book on J-curve)
- SMB lending: the dual-relationship expander (direct origination launched, zero consumer acquisition cost on business owners)
A model where depth drives revenue growth is more durable than one where breadth requires constant acquisition spending. The cost of deepening a relationship is lower than the cost of acquiring a new one, and SoFi’s Q2 data shows the relationship-deepening machinery is producing measurable output.
The honest uncertainty remains. Coach is new. SMB direct origination just launched. The subscriber trajectory from 206,000 to one million is unproven. The thesis is internally coherent, but the confirmation data is still accumulating. SoFi’s long-term bull case rests not on adding members faster than competitors but on making each member cohort progressively more valuable over time. The current data is consistent with that trajectory without yet being conclusive.
This article is for informational purposes only and should not be considered financial advice. Investors should conduct their own research and consult with financial professionals before making investment decisions. Forward-looking statements regarding subscriber targets, revenue projections, and product roadmaps are subject to change based on market developments and company performance.
—