Australian labour productivity fell 0.6% in the March 2026 quarter. That figure, on its own, would be unremarkable. Economies have bad quarters. What makes it disorienting is that the decline arrived after six consecutive years of near-zero growth, not at the bottom of a cycle but along the floor of one that never recovered.
Into this environment, the government’s new capital gains tax rules have landed. This is not a standalone tax story. It is a policy decision that arrives with a macroeconomic address: an economy where business investment has halved as a share of GDP, where workers have fewer tools per person than they did a decade ago, and where the broadest productivity measures have turned negative.
Here is the framework for reading what comes next. After this, you will understand the transmission mechanism that connects tax design to corporate reinvestment decisions, why growth-oriented firms bear the heaviest cost, and how to track whether the concern is materialising in real time. The productivity numbers tell you where Australia stands. The capital allocation decisions that follow will tell you where it is heading.
Six years of near-zero growth: what the productivity numbers actually show
Through the 1990s and 2000s, Australian labour productivity grew at roughly 1.5% per year. That pace was sufficient to support real wage growth, expand fiscal headroom, and absorb the occasional bad quarter without structural concern.
Then the trajectory changed. The Parliamentary Library describes the decade from 2010 to 2020 as Australia’s weakest for productivity growth in 60 years. The Australian Industry Group (Ai Group) reports that whole-economy productivity growth has been effectively zero for six years. And the most recent data confirms the pattern has not broken.
The key figures tell the story plainly:
Per capita output contraction provides the demand-side context that sits alongside the productivity story: even as aggregate GDP grew 2.6% annualised in Q4 2025, output per person fell roughly 0.7% across the full year, and corporate insolvencies reached approximately 12,000, the highest level since the 1990-91 recession.
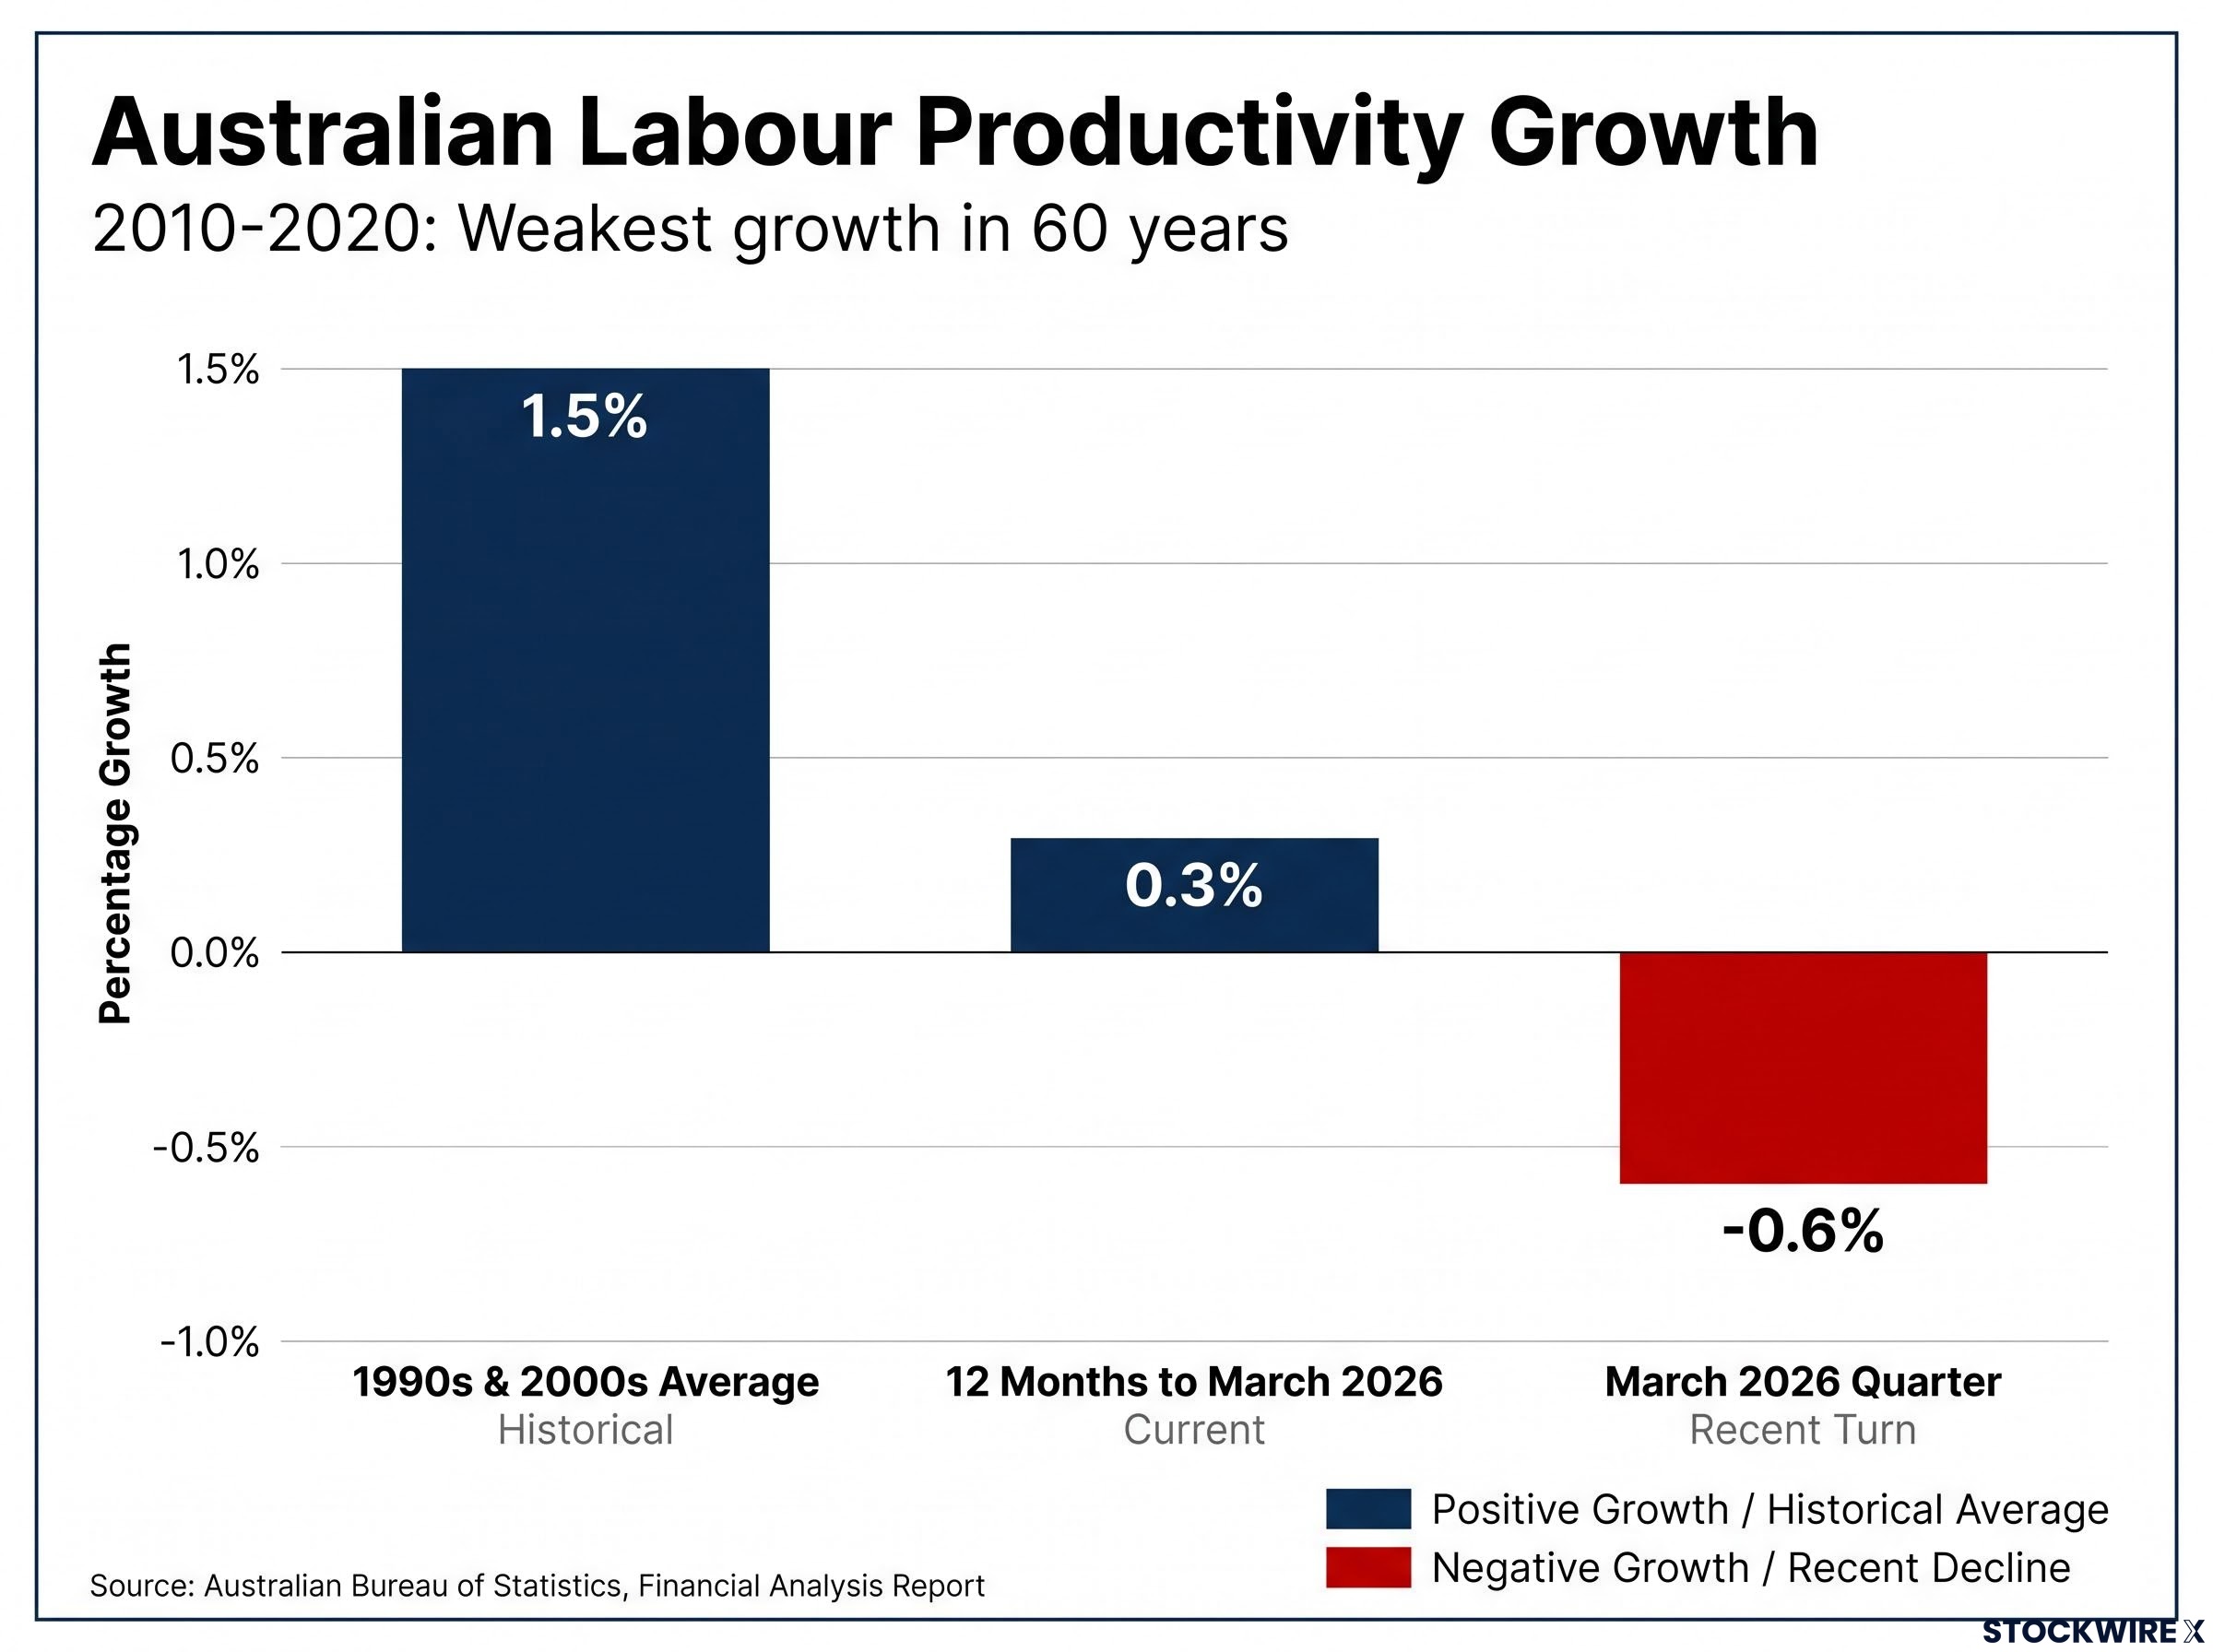
- The Productivity Commission recorded a 0.6% decline in labour productivity for the March 2026 quarter
- Over the twelve months to March 2026, annual labour productivity expanded by only 0.3%
- The historical benchmark from the 1990s and 2000s was sustained growth of around 1.5% per year
The Grattan Institute warns that the broadest measures of Australian productivity have turned negative over the past five years, and that economic prospects will deteriorate significantly if this is not reversed.
The length and breadth of that deterioration matters for how you read everything that follows. This is not a cyclical trough with a natural recovery ahead. It is a structural condition, one where the baseline has shifted so far that any further policy headwind to investment lands on an economy with almost no buffer. That is why the capital gains tax debate is not an abstraction.
When big ASX news breaks, our subscribers know first
Why capital shallowing is the mechanism, not just the metaphor
Capital shallowing is a direct concept: workers have less machinery, less equipment, and less technology per person than they used to. When the capital available per worker declines, each hour of labour produces less output. Productivity stalls regardless of how skilled or motivated the workforce is.
How the investment gap built over time
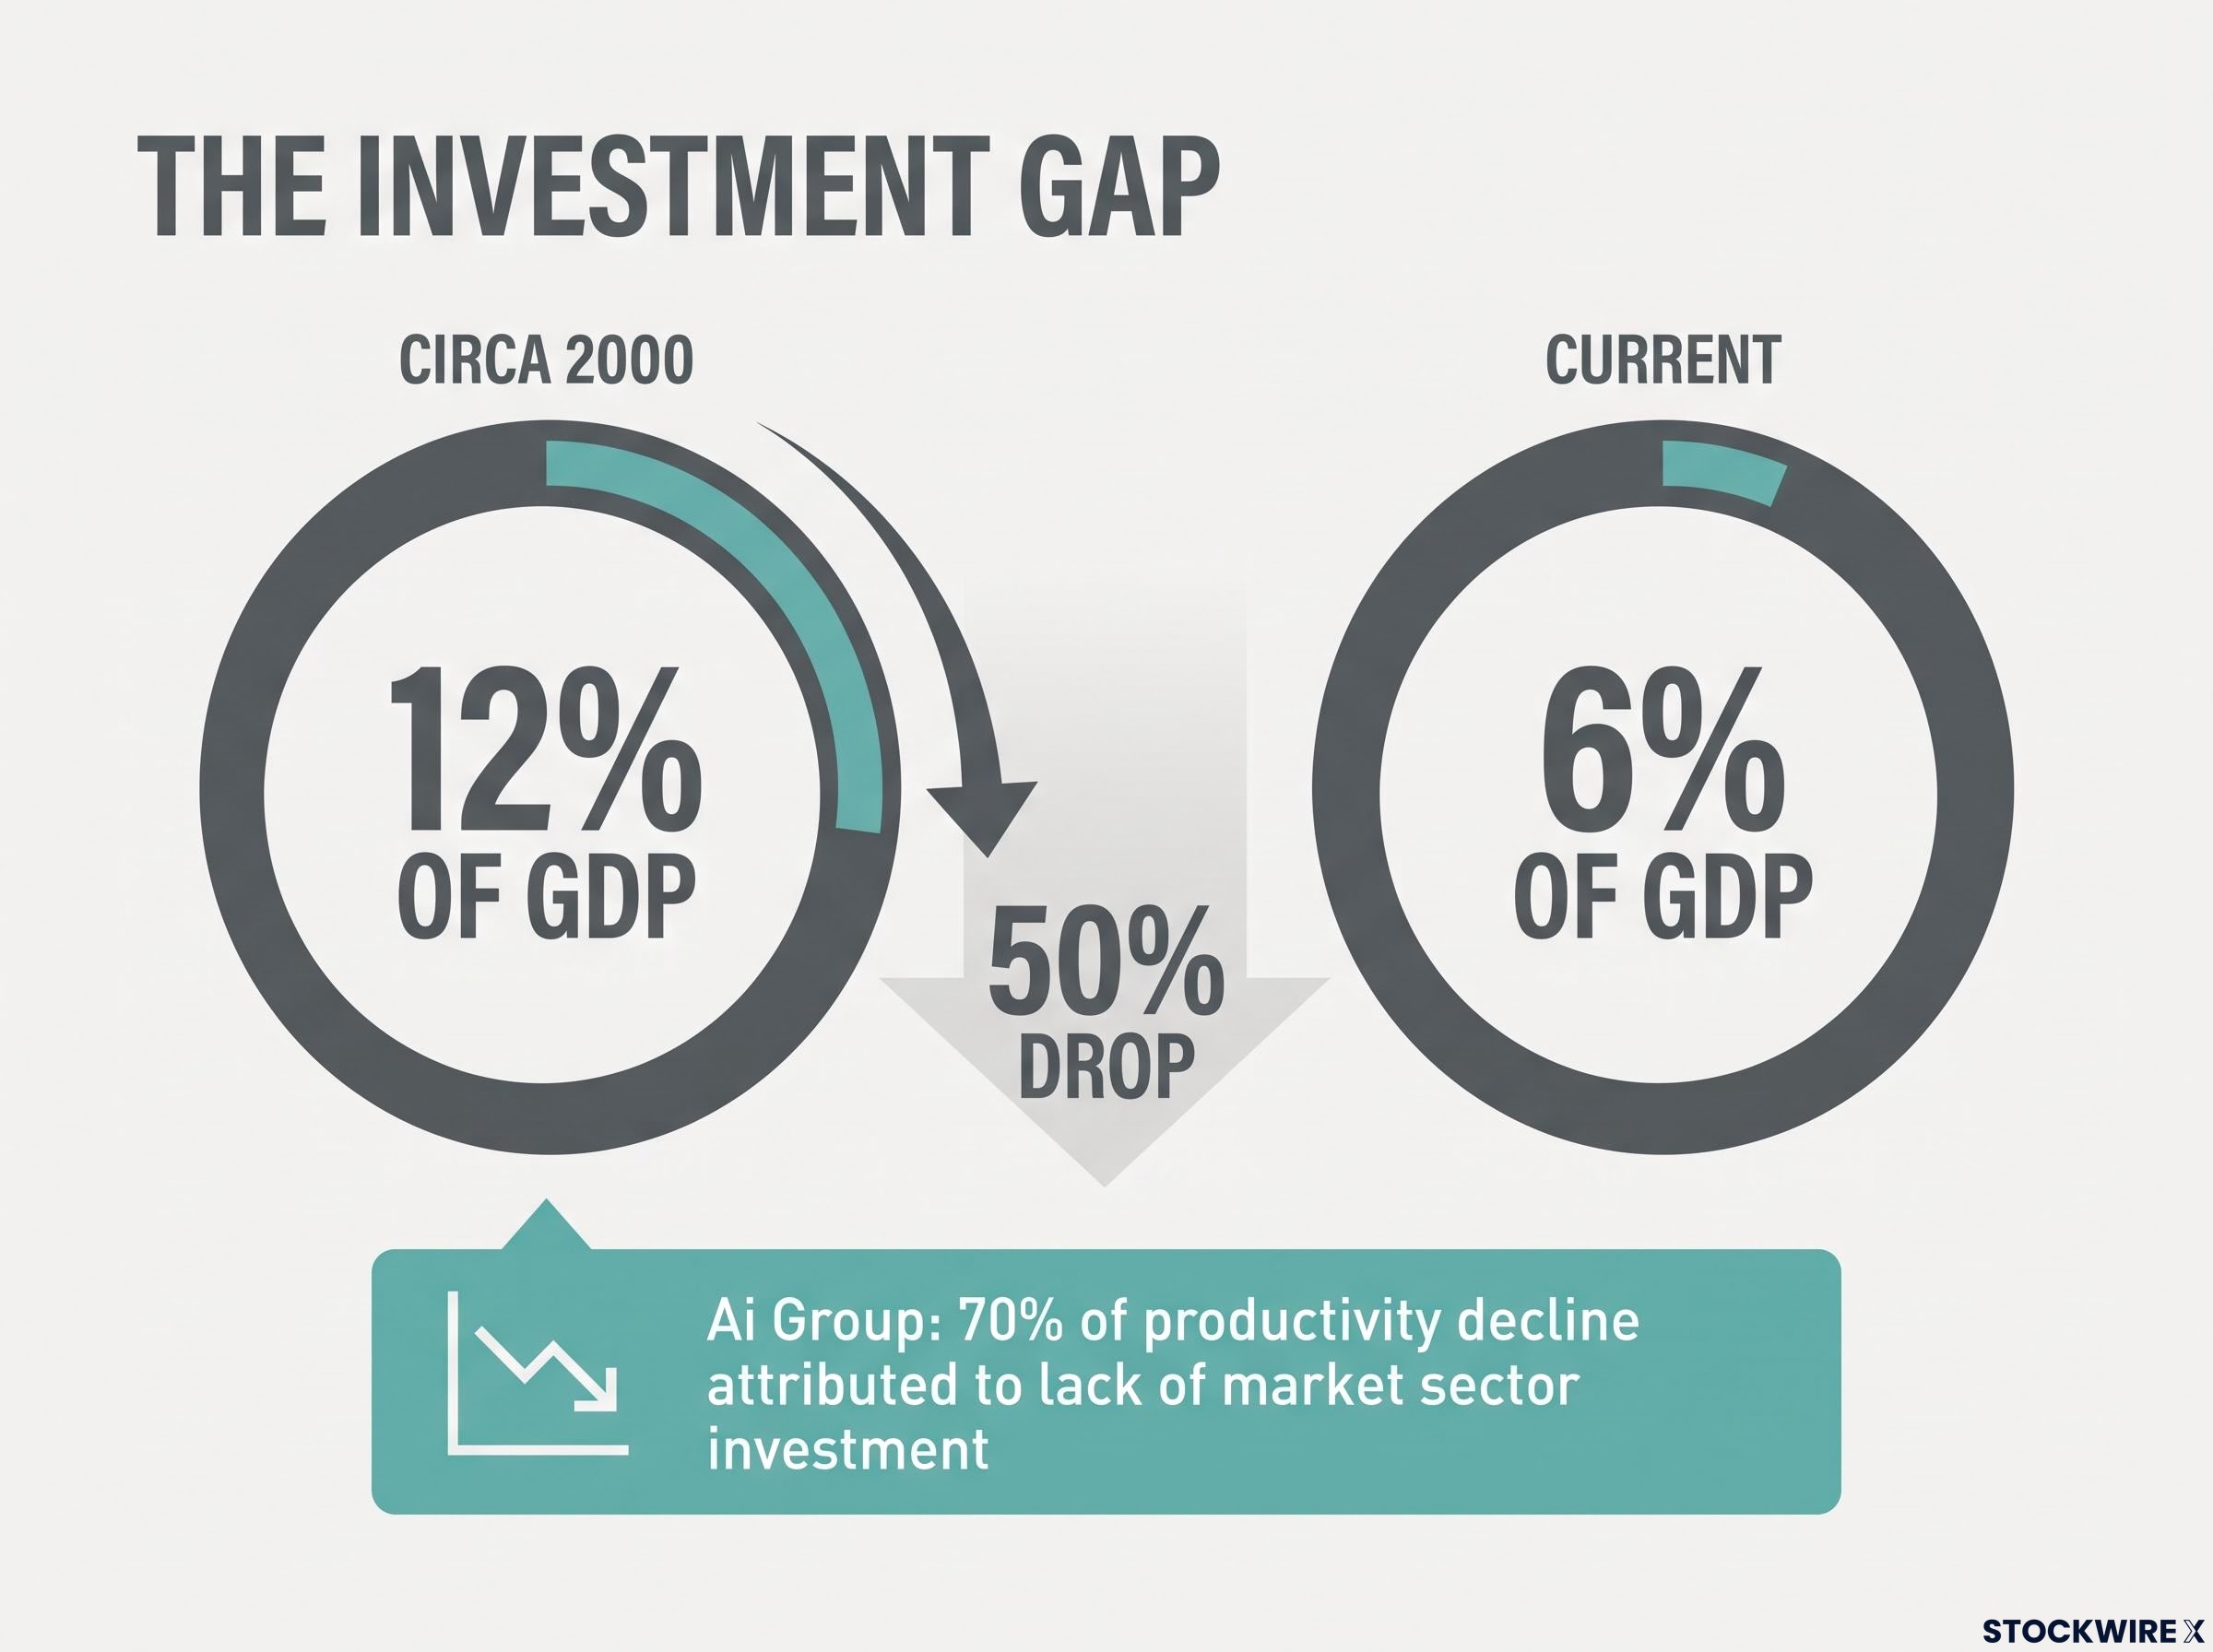
The numbers behind the concept are stark. According to Rich Hirst, business investment has fallen from approximately 12% of GDP to around 6% of GDP. That halving did not happen overnight. It built gradually after the global financial crisis, as mining investment retreated and non-mining capital expenditure failed to fill the gap.
| Period | What was expected | What happened |
|---|---|---|
| Circa 2000 | Business investment around 12% of GDP | Investment broadly at expected levels |
| Circa 2010 | Non-mining investment to offset mining capex decline | Non-mining capex remained subdued; gap widened |
| Current | Investment recovery to support productivity rebound | Business investment approximately 6% of GDP |
Ai Group attributes roughly 70% of the productivity decline to lack of investment in the market sector. Oxford Economics notes that output per hour worked is barely higher than it was in 2017.
The tax dimension compounds the problem. Australia’s effective company tax rate sits among the highest in the OECD, according to Ai Group. The existing franking credit system, as Hirst identifies, already tilts corporate incentives toward paying dividends rather than reinvesting in productive capital. The investment gap is not a mystery. The incentive structure explains it.
That halving of business investment as a share of GDP is the single most important number in this analysis. Without capital deepening, workers cannot become more productive regardless of training, effort, or policy aspiration. It is the mechanism through which tax design connects to the productivity figures at the top of this piece.
The Grattan Institute’s Stagnation Nation report documents the decline in non-mining business investment to levels not seen in more than 50 years, situating the current capital shallowing problem within a long-run structural shift rather than a post-pandemic cyclical dip.
What the new CGT rules change about the reinvestment calculus
The transmission from tax settings to boardroom behaviour follows a logical sequence. Understanding each step matters because the CGT rules do not act in isolation; they interact with an existing distortion.
- The neutral baseline. Under a tax-neutral regime, boards choose between reinvestment and distribution based primarily on expected returns. If a project generates a higher risk-adjusted return than shareholders could earn elsewhere, the board retains earnings and invests. If not, it pays a dividend. Tax does not tip the scales.
- The distortion introduced. Where the CGT framework raises the effective tax burden on retained earnings relative to distributed profits, the after-tax return on reinvestment is reduced. Projects sitting at the margin of viability tip into unviability. Distributing profits becomes comparatively more attractive, not because underlying investment opportunities have changed but because the tax calculation has moved against retention.
- The board response. Boards are not acting irrationally when they raise payouts in response to changed tax settings. They are responding correctly to incentives, which is exactly why the policy design matters so much. When investors are focused on after-tax income, boards face sustained pressure to distribute rather than retain.
This mechanism deepens an existing problem. Rich Hirst documents that franking credit pressure already pushes Australian firms toward higher dividends. Tony Dillon, a freelance writer and former actuary, identifies tax incentives as increasingly shaping corporate decisions toward distribution rather than reinvestment. The new CGT rules risk compounding the distortion rather than creating it from scratch.
No direct empirical studies on the new CGT rules’ investment effects exist yet. The argument rests on established tax-incidence theory applied to a documented structural problem. The directional logic is sound; the magnitude remains unknown.
That distinction matters for intellectual honesty. What you can say with confidence is that the incentive structure has shifted. What you cannot yet quantify is by how much.
Growth firms bear the cost that mature firms do not
Picture two distinct categories of business listed on the same exchange. The first is a large, established company with predictable cash flows, a limited pipeline of reinvestment opportunities, and a policy of paying out a substantial share of its earnings as dividends. The second is a growth-focused firm that holds back a greater portion of its profits to finance new equipment, technology, and research and development (R&D).
Both face the same tax change. But the consequences are sharply different.
The mature firm’s model is already aligned with the incentive to distribute. It pays out most of its earnings anyway. A tax shift that rewards distribution over retention changes very little about its behaviour, because its behaviour was already pointed in that direction.
The growth firm faces a different equation entirely. It retains earnings precisely to fund the investments that drive productivity gains: new equipment, technology platforms, R&D programmes. A tax change that penalises retention relative to distribution creates a meaningful marginal headwind at exactly the point where the reinvestment decision is being made.
| Firm type | Capital allocation tendency | Exposure to CGT reinvestment headwind |
|---|---|---|
| Mature income firm | Distributes most earnings; fewer productive reinvestment opportunities | Low: existing model already aligned with distribution incentive |
| Growth-oriented firm | Retains larger earnings share; invests in capital, technology, and R&D | High: faces stronger marginal headwind on reinvestment |
Ai Group and the Parliamentary Library both stress that Australia already has too few high-growth, high-productivity firms. A tax framework that disproportionately burdens reinvestment-intensive businesses deepens precisely the structural imbalance that official analysis identifies as a core problem.
The pressure on angel investor capital flows is a concrete early signal of the broader reinvestment dynamic the current article describes: a 260-person survey submitted to the Senate Economics Legislation Committee found 91% of sophisticated investors reported reduced willingness to back Australian startups, with an estimated $90-180 million in private capital already delayed or redirected offshore.
For your portfolio, this asymmetry is a signal. Examine whether the companies you hold are positioned to absorb a higher reinvestment tax burden, or whether their capital allocation patterns are likely to shift toward distributions that flatter near-term yield at the cost of long-run earnings growth.
Why the timing amplifies the risk
A tax change that might register as a minor headwind in a high-productivity economy takes on a different character when three constraints arrive simultaneously:
- Near-zero growth baseline. Six years of zero productivity growth, with the most recent quarter negative, means there is no momentum to absorb a further drag.
- Documented investment gap. Business investment has roughly halved as a share of GDP since the early 2000s, and Australia’s investment shortfall since the GFC appears materially larger than the OECD average, though precise comparisons across different measurement bases require caution.
- Structural imbalance toward low-growth industries. Policy and research bodies repeatedly call for rebalancing toward innovation-intensive sectors, yet the current tax framework risks tilting capital further toward mature, distribution-oriented firms.
CPA Australia describes the productivity situation as “serious enough to threaten economic growth, competitiveness and living standards” unless governments act decisively.
Hard landing risk builds on the same structural conditions the current analysis identifies: VanEck’s assessment describes the Australian economy as having ‘stalled’ with trimmed mean inflation still at 3.5% in the March quarter of 2026, removing the rate-cut cushion that would typically offset the earnings pressure created by a shift in tax settings.
Productivity growth is the primary driver of sustainable real wage growth. It is also the variable that determines whether government budgets can support an ageing population without persistent deficit expansion. Prolonged weakness compounds into social and budgetary constraints over time, not just economic ones.
The Grattan Institute’s warning that economic prospects will deteriorate significantly if the trend is not reversed carries more weight when you recognise how little buffer remains. The concern is not that the CGT rules are individually catastrophic. It is that they arrive when Australia has almost no cushion, making the same policy change more consequential than it would be under healthier conditions.
What to watch as the policy beds in
The analytical case above converts into a practical monitoring framework through three signals, split between what you can track at the company level and what you watch at the economy-wide level.
- Payout ratio trends in growth-oriented firms. Rising payouts without corresponding declines in investment opportunity or strategic rationale should prompt scrutiny. If a firm that historically retained earnings for R&D and capital expenditure begins raising distributions, ask whether the shift reflects genuine lack of opportunity or a tax-driven recalculation.
- Capex, R&D, and intangible investment alongside dividends and buybacks. Track these as a set, not in isolation. A company can maintain a stable dividend while quietly reducing capital expenditure, and the productivity consequence is identical. The investment line items are where the signal lives.
- Productivity Commission quarterly data. This is the macro-level instrument for separating cyclical noise from structural deterioration.
The macro signal to watch
The Productivity Commission’s quarterly bulletins track changes in labour and multifactor productivity and are designed to distinguish cyclical from structural drivers. The March 2026 baseline, showing 0.3% annual growth and a negative quarterly result, is your starting reference point.
The Productivity Commission quarterly bulletins track labour and multifactor productivity at the economy-wide level, providing the authoritative baseline against which any claim about structural deterioration versus cyclical noise must be tested.
If productivity remains near zero or deteriorates further despite broader cyclical recovery in the economy, that pattern would strengthen the case that Australia’s investment and policy settings, including tax, are not supporting a return to healthy productivity growth. Oxford Economics notes that output per hour worked is barely higher than it was in 2017; any further stagnation from that already weak base would be difficult to attribute to cyclical factors alone.
An investor or board member who tracks these signals is in a materially better position to distinguish between a company making a sound capital allocation decision and one responding to a tax distortion at the expense of long-run earnings capacity.
A structural risk in a zero-buffer economy
The analytical thread through this piece is straightforward. Australia’s productivity problem is structural and documented. Business investment has halved as a share of GDP. The tax system already tilts corporate incentives toward distribution over reinvestment. The new CGT rules arrive into this environment, and their design risks deepening the distortion rather than correcting it, with growth-oriented firms bearing the heaviest cost.
The inferential limit matters. The chain running from CGT design through investment behaviour to productivity outcomes draws on well-established economic reasoning, yet how large the real-world effect will prove remains an open question until the data arrives. The direction of the risk is identifiable; its size is not yet measurable.
What you take from this is a framework. When you see payout ratios rising, you now know what question to ask. When the Productivity Commission publishes its next quarterly figures, you know what baseline to measure against. The productivity numbers will either confirm or challenge the concern as data accumulates. You are now equipped to read that data through a more complete lens.
For investors who want to translate the structural imbalance argument into a practical portfolio response, our dedicated guide to ASX home bias and structural allocation examines how the index’s concentration in financials and resources compounds the productivity and reinvestment risk identified here, and what reallocation decisions follow from that diagnosis.
This article is for informational purposes only and should not be considered financial advice. Investors should conduct their own research and consult with financial professionals before making investment decisions.
The connection between the new CGT rules and investment behaviour is grounded in established economic theory rather than direct empirical measurement. These forward-looking observations are subject to change as real-world data on the policy’s effects becomes available.