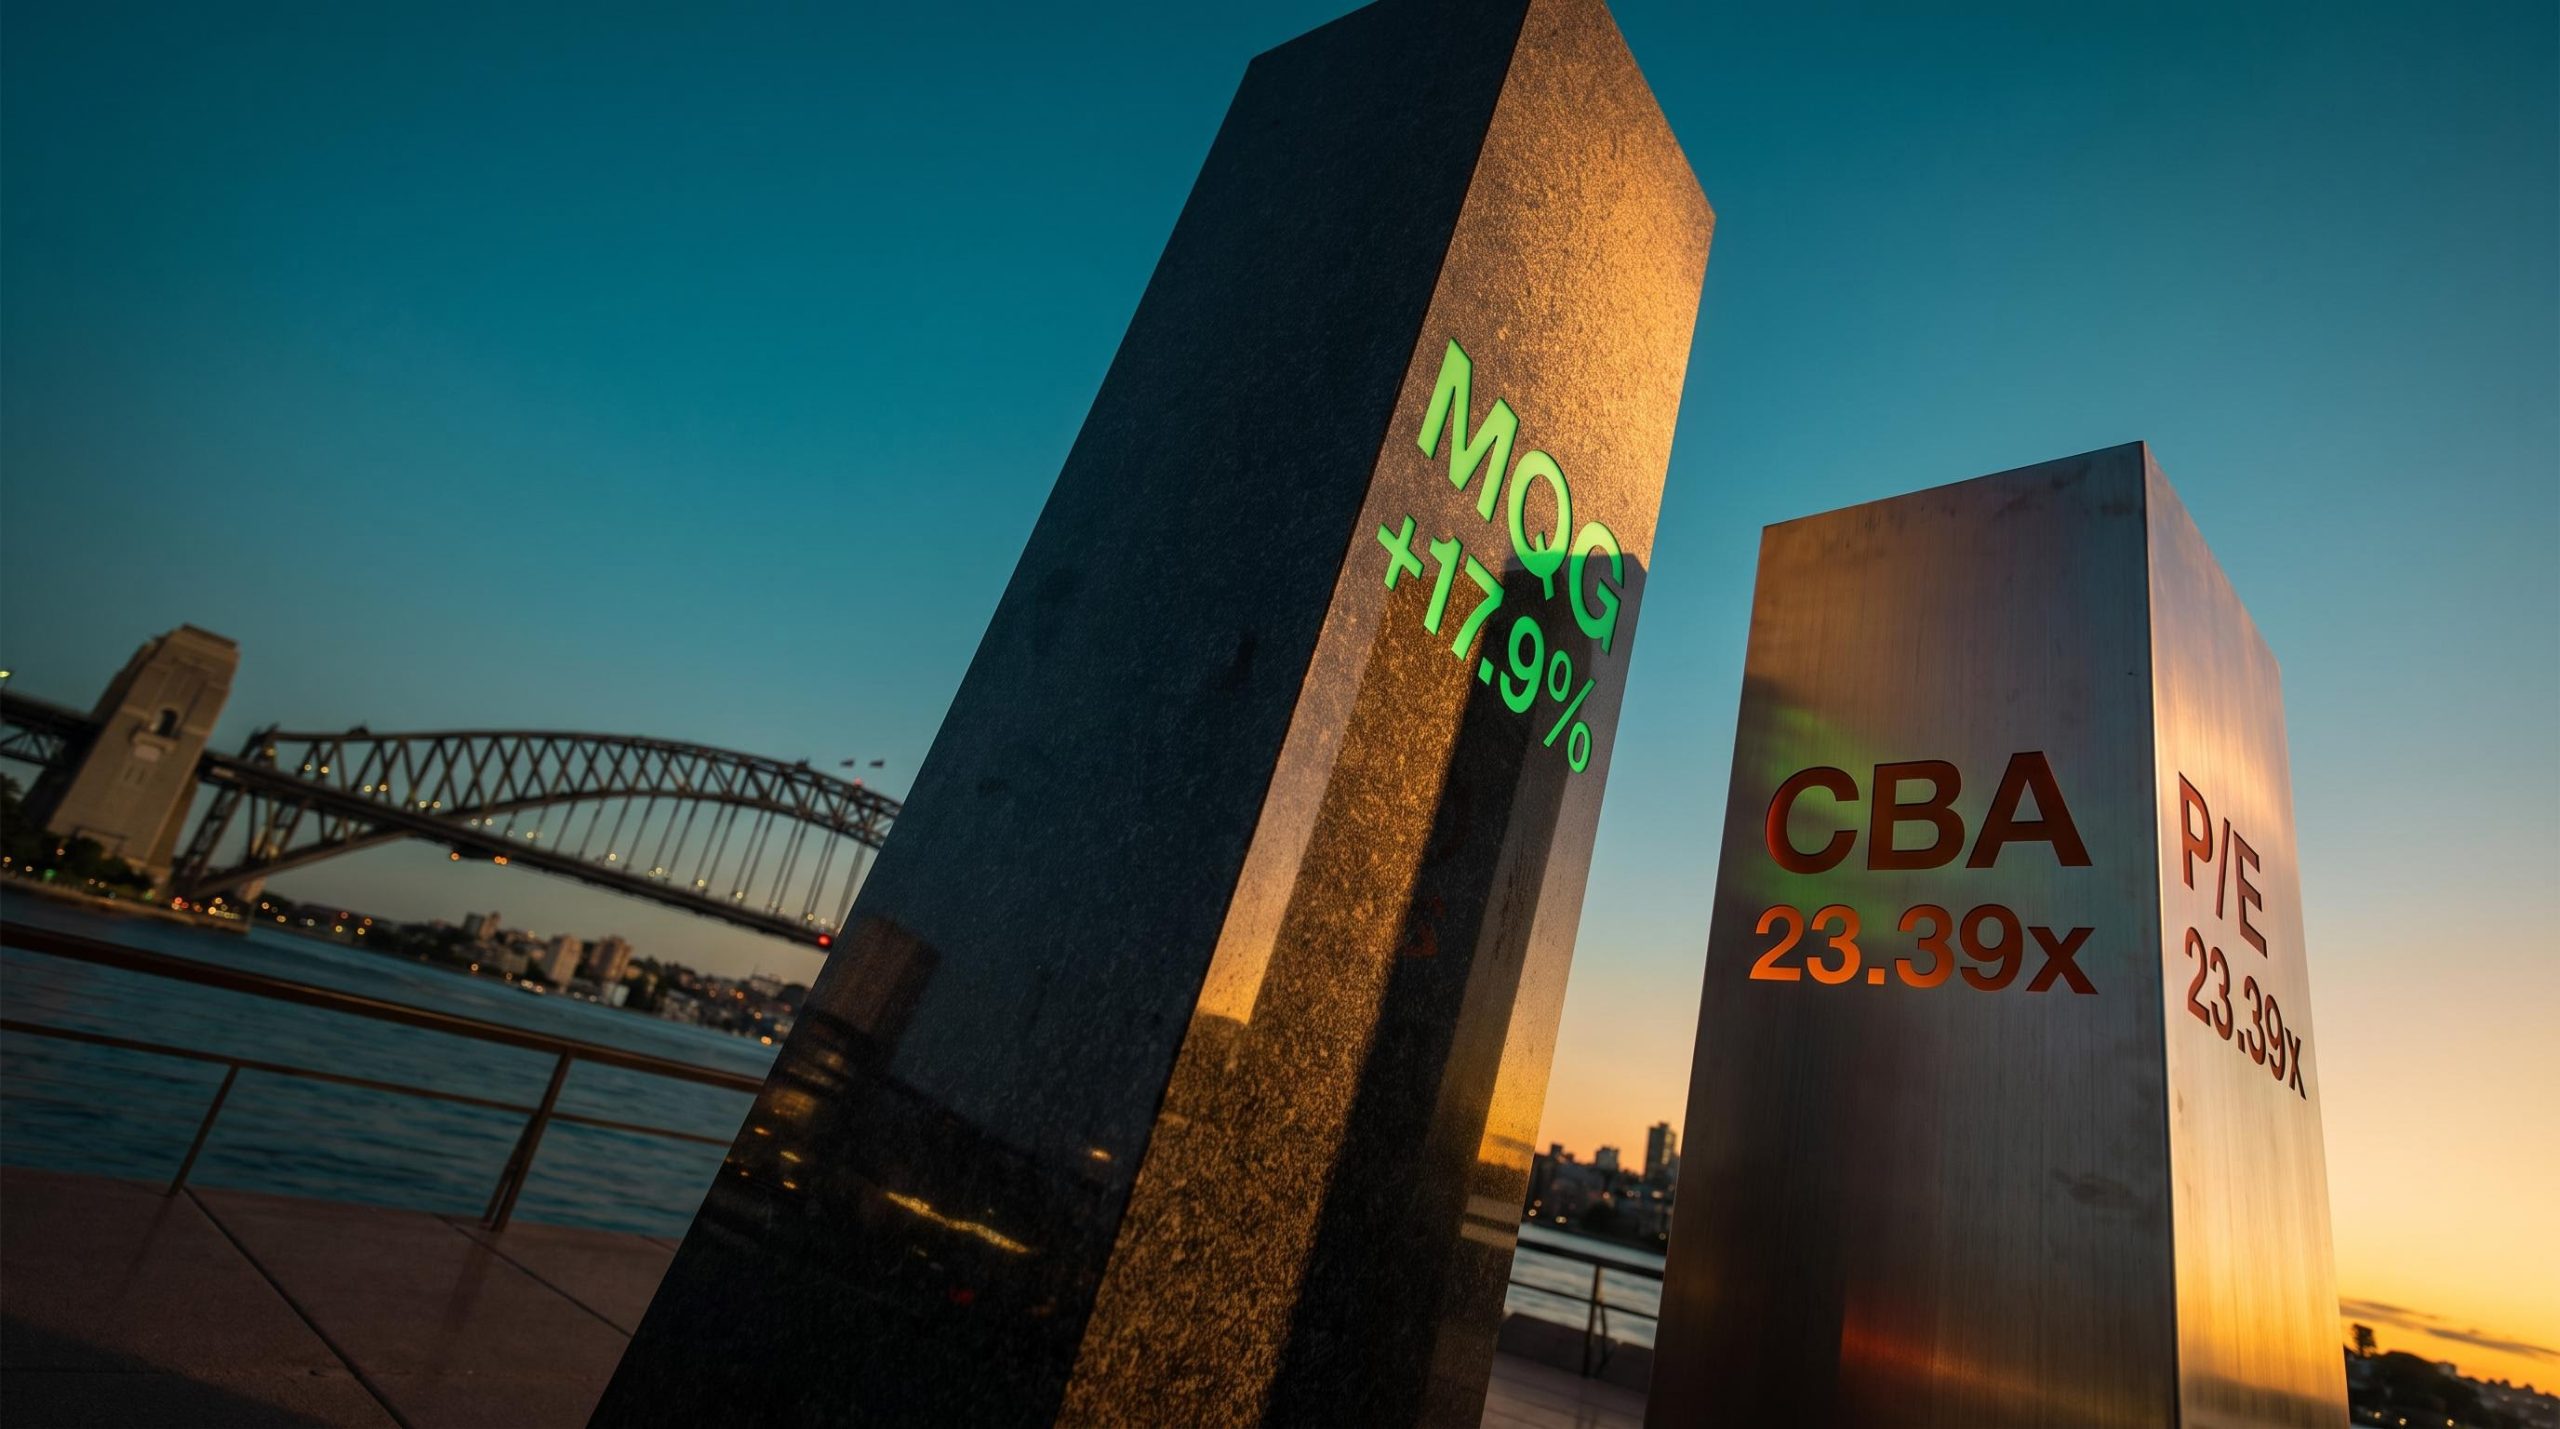
Here is a number that should stop most Australian income investors in their tracks. Through the first eight-and-a-half months of 2026, Macquarie Group has climbed roughly 18%, while Commonwealth Bank has slipped into the red. Yet ask a typical dividend-focused investor which is the safer, better-performing bank stock, and most will still name CBA without hesitation.
That gap between the assumption and the data is worth understanding right now. As of 18 September 2026, CBA trades at a trailing price-to-earnings ratio of 23.39 against Macquarie’s 18.83-19.06, every one of the 14 analysts surveyed on CBA has a Sell rating with not a single Buy, and Macquarie has just posted a 30% jump in annual profit to $4.85 billion. With Reserve Bank of Australia rate cuts on the horizon, the valuation question has real urgency.
Here is what this comparison of Macquarie Group versus Commonwealth Bank actually gives you: a clear read on which stock fits your objective, whether that is tax-advantaged income or capital growth with global reach, and why the same metrics deserve to be read very differently for each.
Two very different businesses wearing the same “bank stock” label
The first mistake investors make with this comparison is treating both companies as variations on the same theme. They are not. Running Macquarie and CBA through an identical bank-stock checklist is a category error, and getting past that error is the only way the rest of the numbers start to make sense.
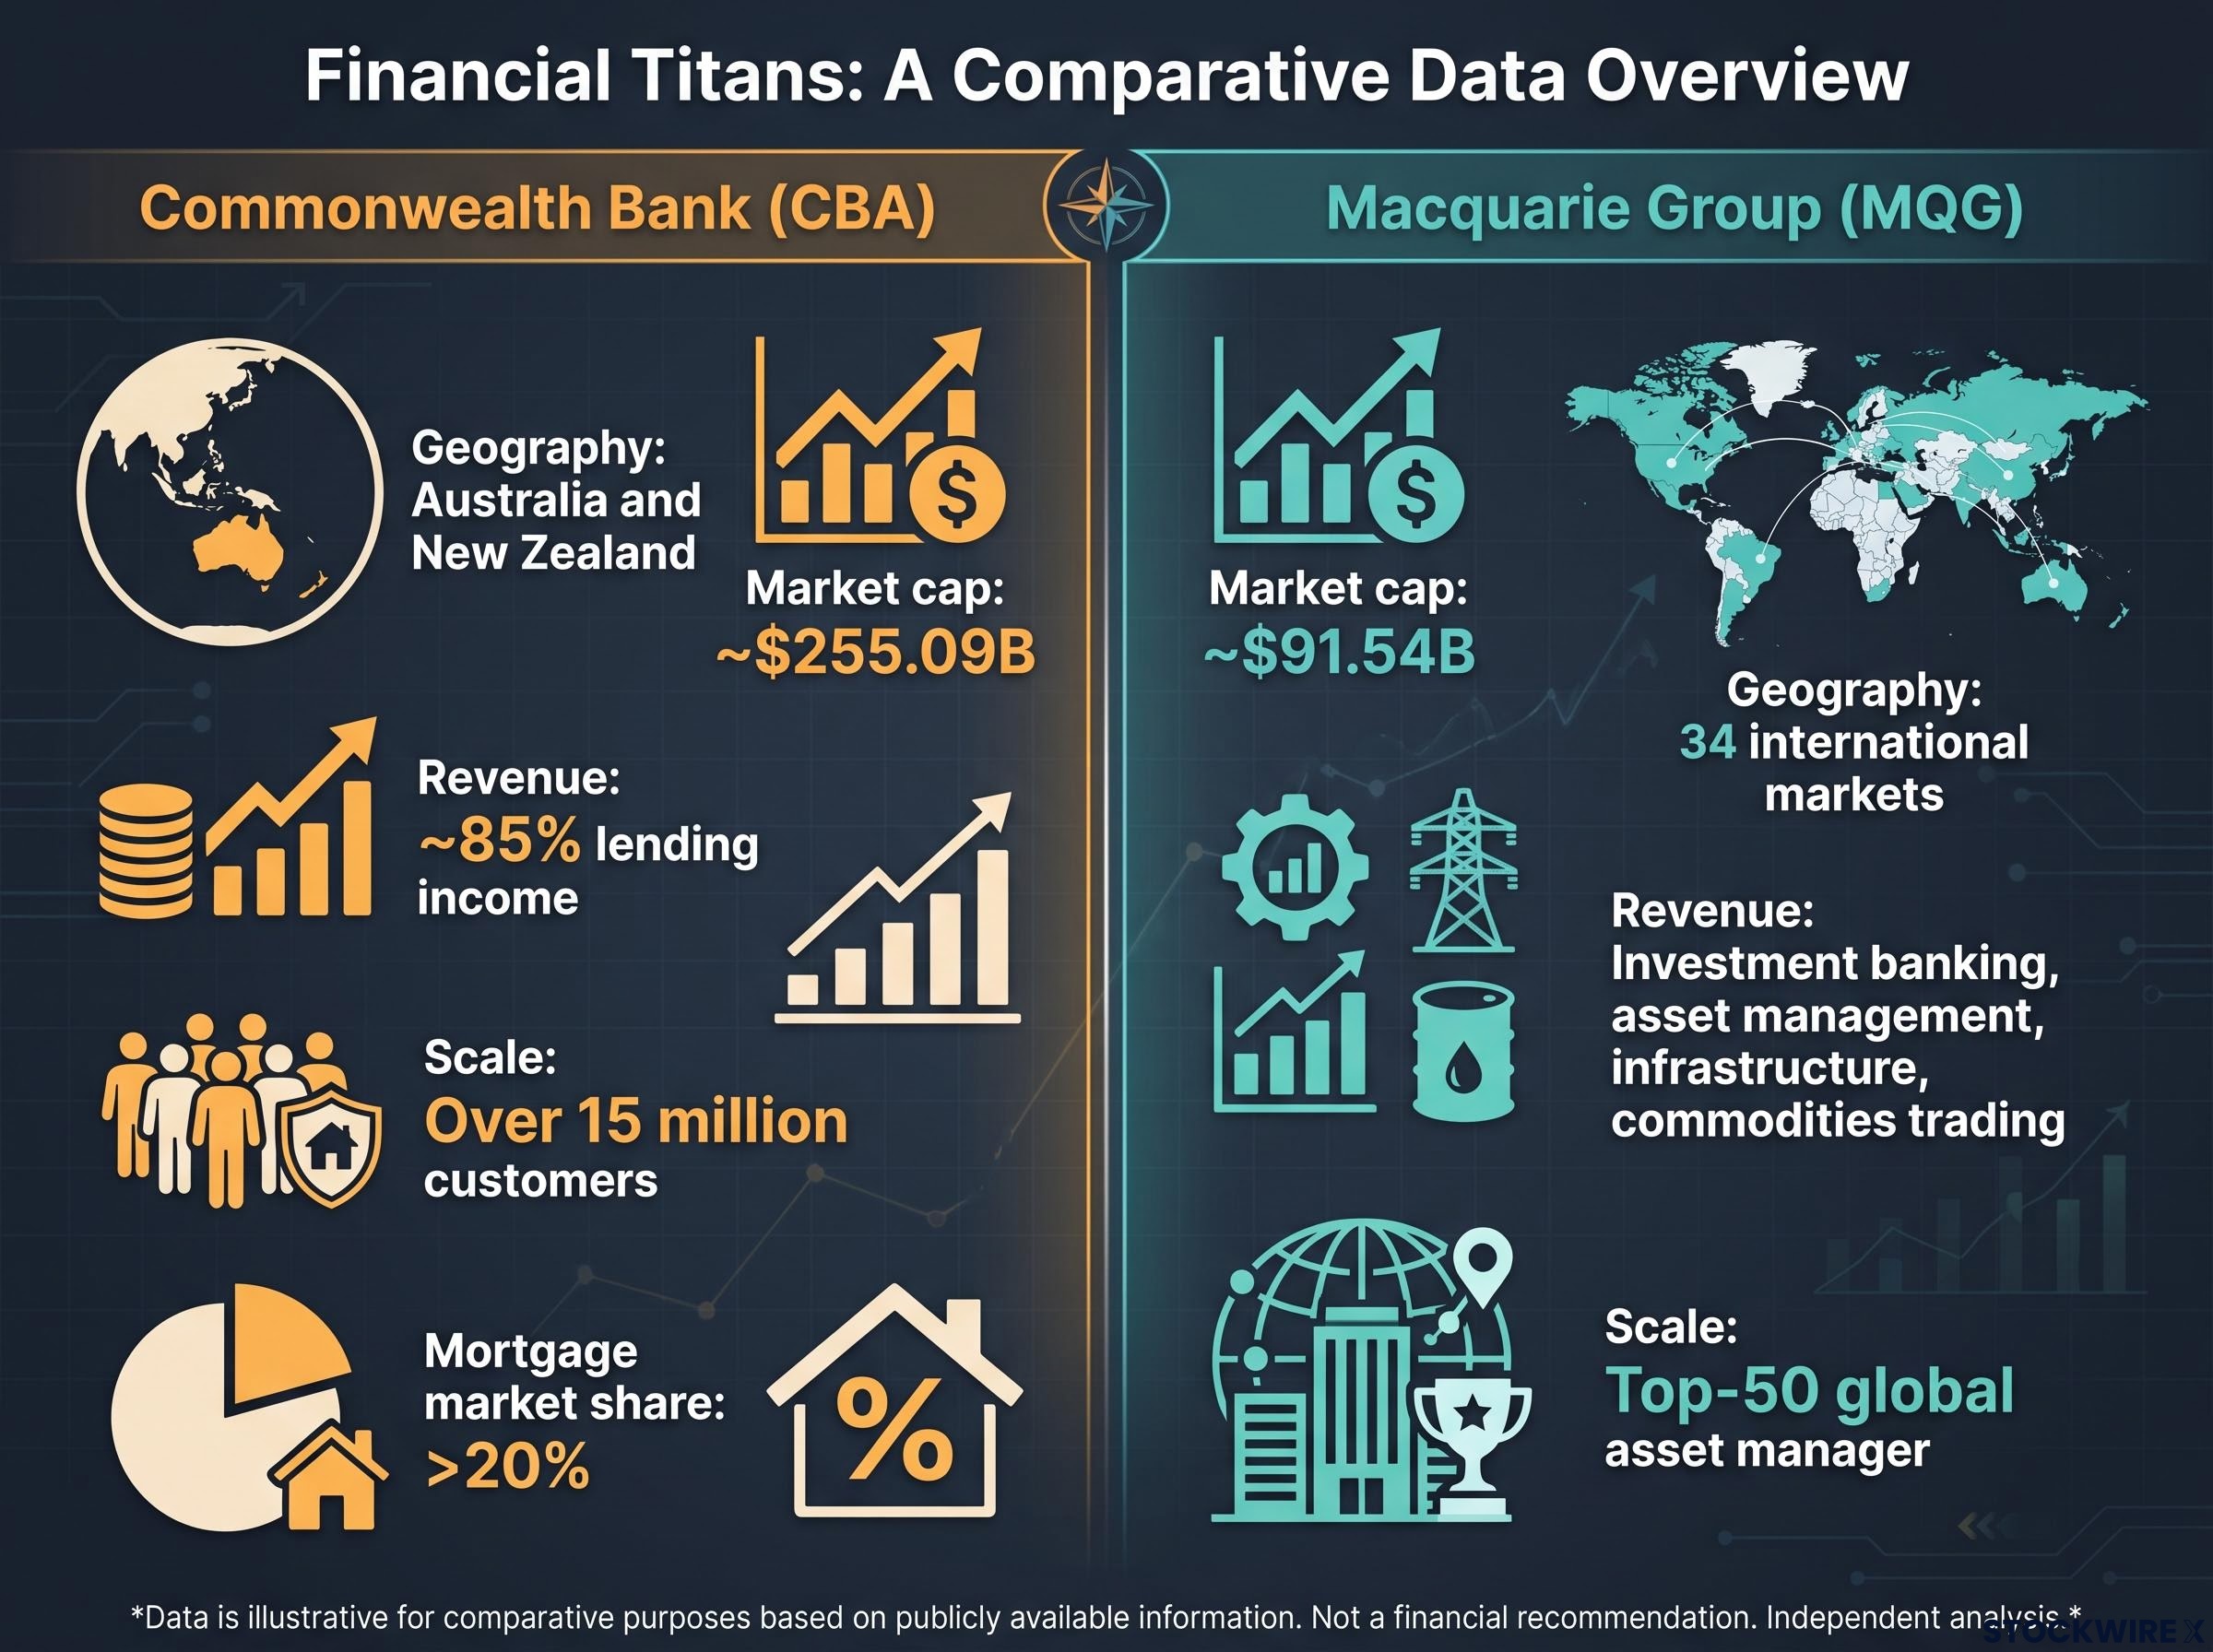
Macquarie operates across 34 international markets, with earnings driven by investment banking, asset management, infrastructure, and commodities trading. It ranks among the world’s top-50 asset managers. Its market capitalisation sits at roughly $91.54 billion. In practical terms, it is a globally diversified alternatives manager that happens to hold a banking licence, and retail banking is only a minor slice of what it does.
The global diversification argument for Macquarie is more specific than it first appears: unlike a broad international ETF that concentrates 70-75% in US equities, Macquarie’s cross-market exposure spans infrastructure, commodities, and advisory businesses across 34 countries, offering a genuinely different risk profile from simply buying a global index fund.
CBA is the mirror image. It is Australia’s largest bank by market capitalisation at approximately $255.09 billion, serving over 15 million customers with a mortgage market share above 20%. Lending income makes up around 85% of total revenue, and its operations are anchored almost entirely in Australia and New Zealand.
Why the difference matters for valuation
CBA’s domestic profitability is genuinely strong. Its return on equity of 13.1% sits well above the sector average of roughly 9.35%, and its net interest margin of 2.04% beats the sector’s approximate 1.78%. Return on equity measures how much profit a company generates from shareholder funds; net interest margin is the gap between what a bank earns on loans and pays on deposits.
Those metrics describe a high-quality earnings engine. They also describe a business whose profits are tethered almost entirely to Australian credit cycles, rate decisions, and household balance sheets. Owning CBA is closer to a concentrated bet on the Australian consumer than a diversified financial holding, and that is the exposure you are actually taking on.
| Metric | Commonwealth Bank (CBA) | Macquarie Group (MQG) |
|---|---|---|
| Business model type | Domestic retail and business bank | Global diversified alternatives manager |
| Geographic exposure | Australia and New Zealand | 34 international markets |
| Revenue concentration | ~85% lending income | Advisory, asset management, commodities |
| Market cap | ~$255.09B | ~$91.54B |
| Return on equity | 13.1% | Diversified, cyclical earnings base |
When big ASX news breaks, our subscribers know first
What the performance gap actually tells you about 2026
The divergence in 2026 is stark. Macquarie is up approximately 17.9% year-to-date as of mid-September, while CBA has posted a negative return of roughly 1.9%. Both drifted lower in the month to 18 September 2026, CBA down about 3.5% and MQG down around 3.9%, but that near-term wobble does nothing to close the year’s gap.
This is not luck or fickle sentiment. It is a direct consequence of how each business is built, and Macquarie’s engine simply had a stronger year.
Macquarie FY26 net profit: $4,847 million, up 30% on FY25
That headline figure carried a remarkable second half. Macquarie delivered a record 2H26 profit of $3,192 million, up 93% on the first half of the year. Three drivers did the heavy lifting:
- Commodities trading tied to oil and gas volatility from the Middle East conflict
- Robust advisory, equity, and debt capital markets activity
- Rising performance fees from unlisted funds, estimated at around $353 million (an unverified figure)
CBA’s negative return is the flip side of the same coin, but for a different reason. Trading at a trailing P/E of 23.39 and a price-to-book ratio of roughly 3.73x, the stock is priced for near-perfect execution. Price-to-book compares the share price to the accounting value of the company’s assets, and CBA’s sits far above the 1.3-1.5x range of its big-four peers.
When a stock is priced that richly, it needs positive surprises just to stand still. With RBA rate cuts expected to squeeze net interest margins, the market is quietly repricing that risk.
Here is the trap, though. The performance gap is not an invitation to chase Macquarie today. It is a prompt to ask whether the tailwinds behind it, commodity volatility, deal flow, and lumpy performance fees, are durable. Several of them are not, and that matters enormously for what comes next.
Decoding the valuation gap: which multiple deserves its premium?
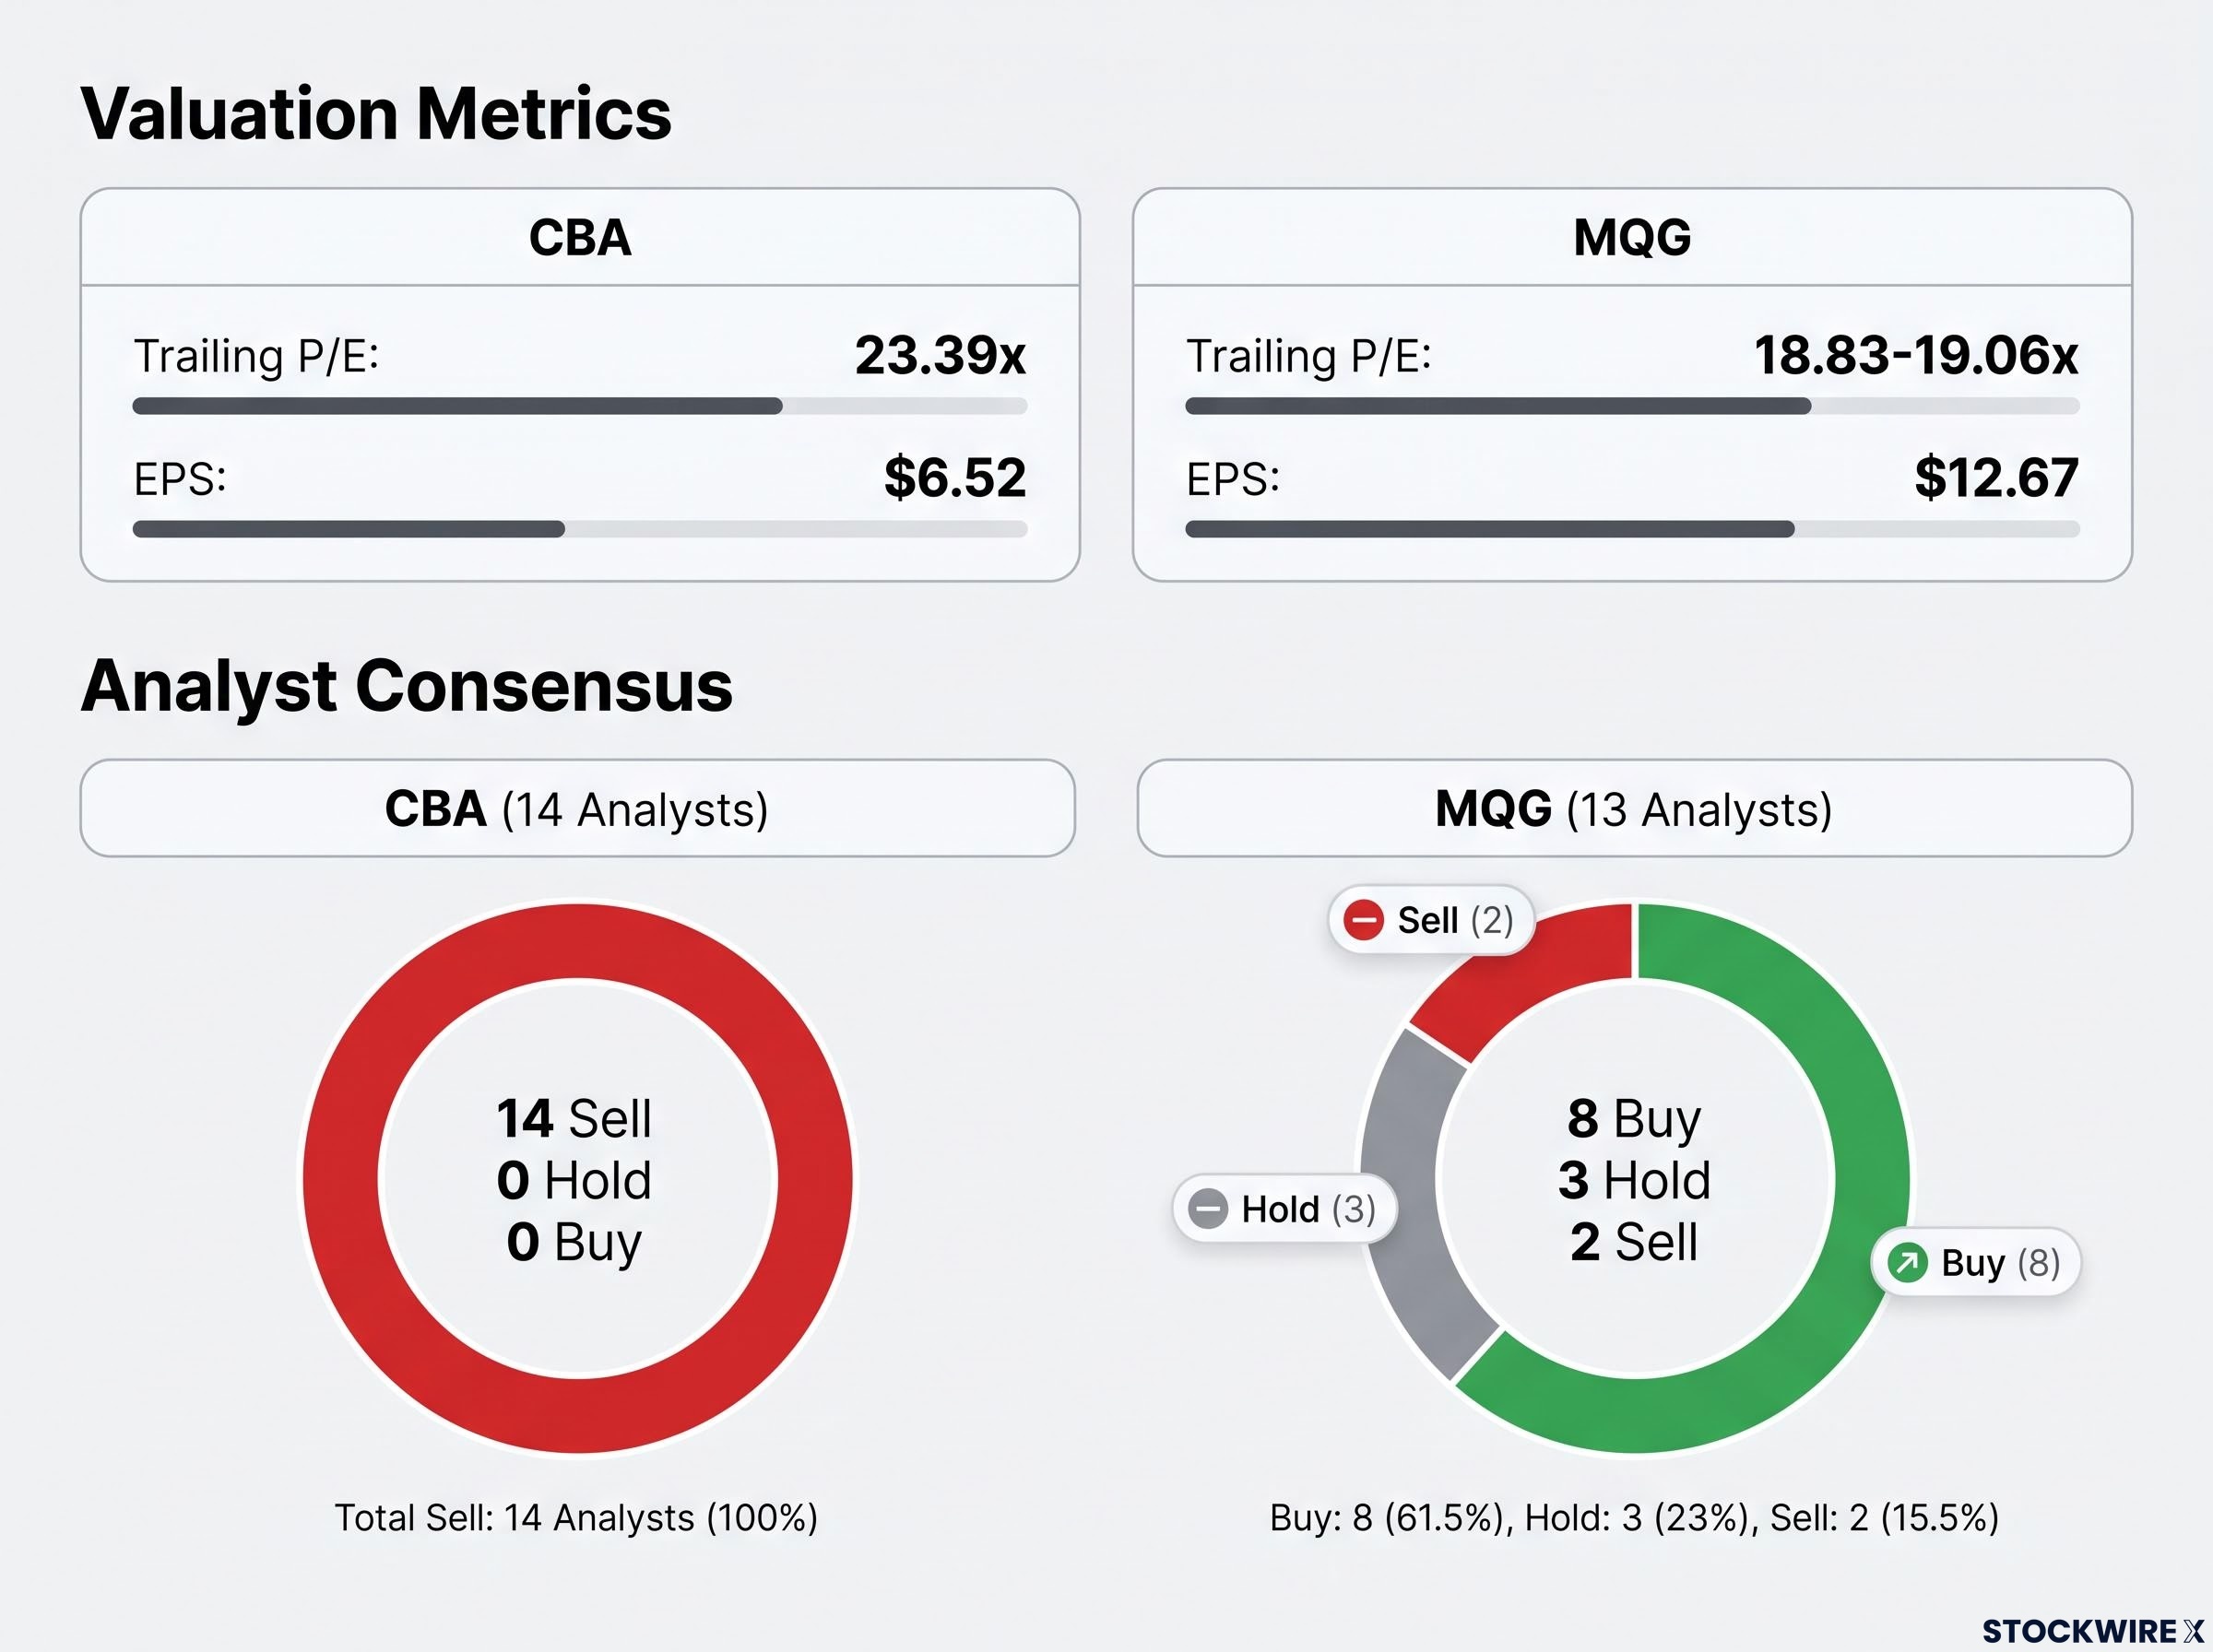
Start with the raw comparison. Macquarie trades at 18.83-19.06x trailing earnings; CBA sits at 23.39x. Macquarie also earns far more per share, with EPS of $12.67 against CBA’s $6.52. On the face of it, the cheaper stock is also the faster grower, which should give any investor pause.
The case for CBA’s premium
CBA’s higher multiple is not irrational. The bank leads its sector on the metrics that matter most, with a net interest margin of 2.04% and return on equity of 13.1%, both comfortably ahead of peers. Its dividends are 100% fully franked, meaning the company has already paid Australian tax on the profits distributed, and shareholders receive credits for that tax.
Dividend discount modelling for CBA illustrates why the stock’s franking-adjusted yield and its stretched price-to-book ratio pull in opposite directions: the grossed-up income case looks supportable, but the capital return implied by a DDM anchored to realistic growth assumptions comes in well below the current price.
The payout ratio sits at 77%, within CBA’s stated 70-80% target, and the franchise itself is difficult to replicate. More than 15 million customers and a mortgage share above 20% give it a deposit and lending base no rival can easily challenge. A premium for that quality is defensible.
Why analysts are uniformly bearish
The problem is not the quality. It is the price attached to it.
Every one of the 14 analysts covering CBA rates it a Sell. Zero Buy, zero Hold. The average 12-month price target is $125.64 (an unverified consensus figure), which sits well below the recent share price of $152.43 and implies material downside. Macquarie, by contrast, holds a consensus Buy across 13 analysts, with 8 Buy, 3 Hold, and 2 Sell, and an average target of $255.84 (also unverified).
| Metric | Commonwealth Bank (CBA) | Macquarie Group (MQG) |
|---|---|---|
| Trailing P/E | 23.39x | 18.83-19.06x |
| Price-to-book | ~3.73x | Not directly comparable |
| EPS | $6.52 | $12.67 |
| Analyst consensus | 14 Sell, 0 Hold, 0 Buy | 8 Buy, 3 Hold, 2 Sell |
| Average price target | ~$125.64 (implied downside) | ~$255.84 (modest upside) |
When the entire professional analyst community rates a stock a Sell and the average target sits roughly a quarter below the market price, the message is not that you are buying a great business cheaply. You are paying a steep speculative premium on that quality continuing without a hitch. High-quality business and attractive investment are not the same thing, and they part ways at exactly this kind of valuation.
Income versus growth: matching the stock to your actual objective
Here is where the decision becomes personal, and where a raw yield comparison will actively mislead you. CBA offers a dividend yield of about 3.31%; Macquarie sits slightly lower at 2.93%. On headline numbers, CBA wins narrowly. On an after-tax basis for an Australian investor, it wins by far more.
The reason is franking. CBA’s full-year dividend of $5.05 per share ($2.35 interim plus $2.70 final) is 100% franked, grossing up to roughly a 4.3% pre-tax equivalent for a top-marginal-rate investor. Macquarie’s $7.00 full-year dividend ($2.80 interim plus $4.20 final) is only 35% franked, so its effective grossed-up return lands materially lower.
CBA’s fully franked dividend grosses up to approximately 4.3% pre-tax equivalent for a top-marginal-rate investor.
This is not a footnote. For a self-managed superannuation fund in pension phase, a fully franked dividend can be received as a cash refund of the imputation credits, pushing the effective yield well above the headline 3.31%. That is a concrete financial outcome, not a theoretical one, and it should weigh directly on your comparison.
The franking credit advantage is particularly pronounced for pension-phase SMSF investors, who convert imputation credits attached to fully franked dividends into direct ATO cash refunds, a mechanism that pushes CBA’s effective yield well above the headline 3.31% visible to a casual screener.
Macquarie’s income story is different but not weaker in its own context. Its payout ratio sits at just 55%, against CBA’s 77%, which leaves far more retained earnings to reinvest and, potentially, to grow future dividends as profits compound. You are trading current tax-effective yield for the prospect of a rising, if less franked, payment.
So which suits you? The honest answer depends on what you actually need from the position:
- CBA suits you if: you prioritise tax-effective franked income, you want capital preservation, you are a retiree or SMSF investor, and you are comfortable with a purely domestic exposure.
- MQG suits you if: you want capital growth over yield, you can tolerate earnings volatility, you value global diversification across infrastructure and capital markets, and you accept lower franking.
Making the call in September 2026 without overfitting to recent returns
Pulling the threads together, Macquarie carries the more attractive risk-reward profile at current prices. It trades on a lower starting multiple, grows earnings faster, and spreads its risk across markets and business lines. Analyst consensus implies modest upside of roughly 4.4-6.6% to the average target of $255.84 (unverified), which is hardly explosive but points in the right direction.
The honest caveat is earnings quality. Macquarie’s record 2H26 leaned heavily on commodities revenue and performance fees, neither of which repeats reliably. Its 1H26 profit of $1,655 million, up just 3% on the prior year, is a truer picture of the baseline beneath the record second half.
Key risks to each position
For Macquarie:
- A downturn in global capital markets activity that dries up advisory and issuance fees
- Normalisation of commodities volatility as the Middle East situation stabilises
- Currency headwinds on cross-border earnings
For CBA:
- Net interest margin compression from RBA rate cuts
- P/E de-rating risk from an already stretched multiple
- Limited scope for upside surprise, with a target implying downside of roughly $40-$45 below the current price (unverified)
CBA itself is not fragile. Its cash profit rose 7.1% to about $11.0 billion in FY26, a genuinely solid result. The point is that almost all of its franchise quality is already reflected in the price. Future returns depend on either further multiple expansion or earnings outpacing already-elevated expectations, and that is a narrower path than the stock’s reputation suggests.
The Big Four bank rally between 2023 and 2026 was sustained largely by institutional and passive super flows replacing price-sensitive retail sellers, a dynamic that expanded P/E multiples by roughly 5.4 percentage points and left the current margin of safety thinner than at the rally’s start, which is precisely the environment CBA’s analyst consensus is now pricing.
The case for holding both
For many investors, the resolution is not a choice but a construction. Hold CBA for core, tax-effective franked income, with the valuation risk explicitly accepted. Hold Macquarie for growth and global diversification, with the earnings volatility explicitly accepted. That is a deliberate way to meet two objectives at once, not a hedge born of indecision.
This article is for informational purposes only and should not be considered financial advice. Investors should conduct their own research and consult with financial professionals before making investment decisions. Past performance does not guarantee future results. Financial projections are subject to market conditions and various risk factors.