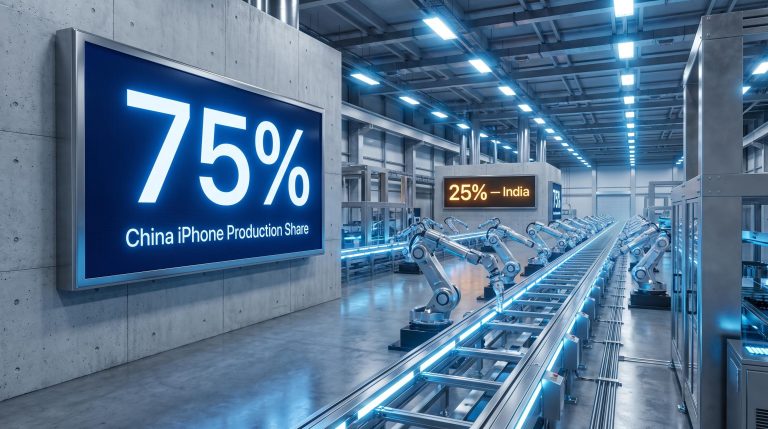
Apple’s services segment now throws off more gross profit relative to its revenue base than the entire hardware business, and most investors still file the company under “phone maker.” That framing is becoming an increasingly expensive analytical error.
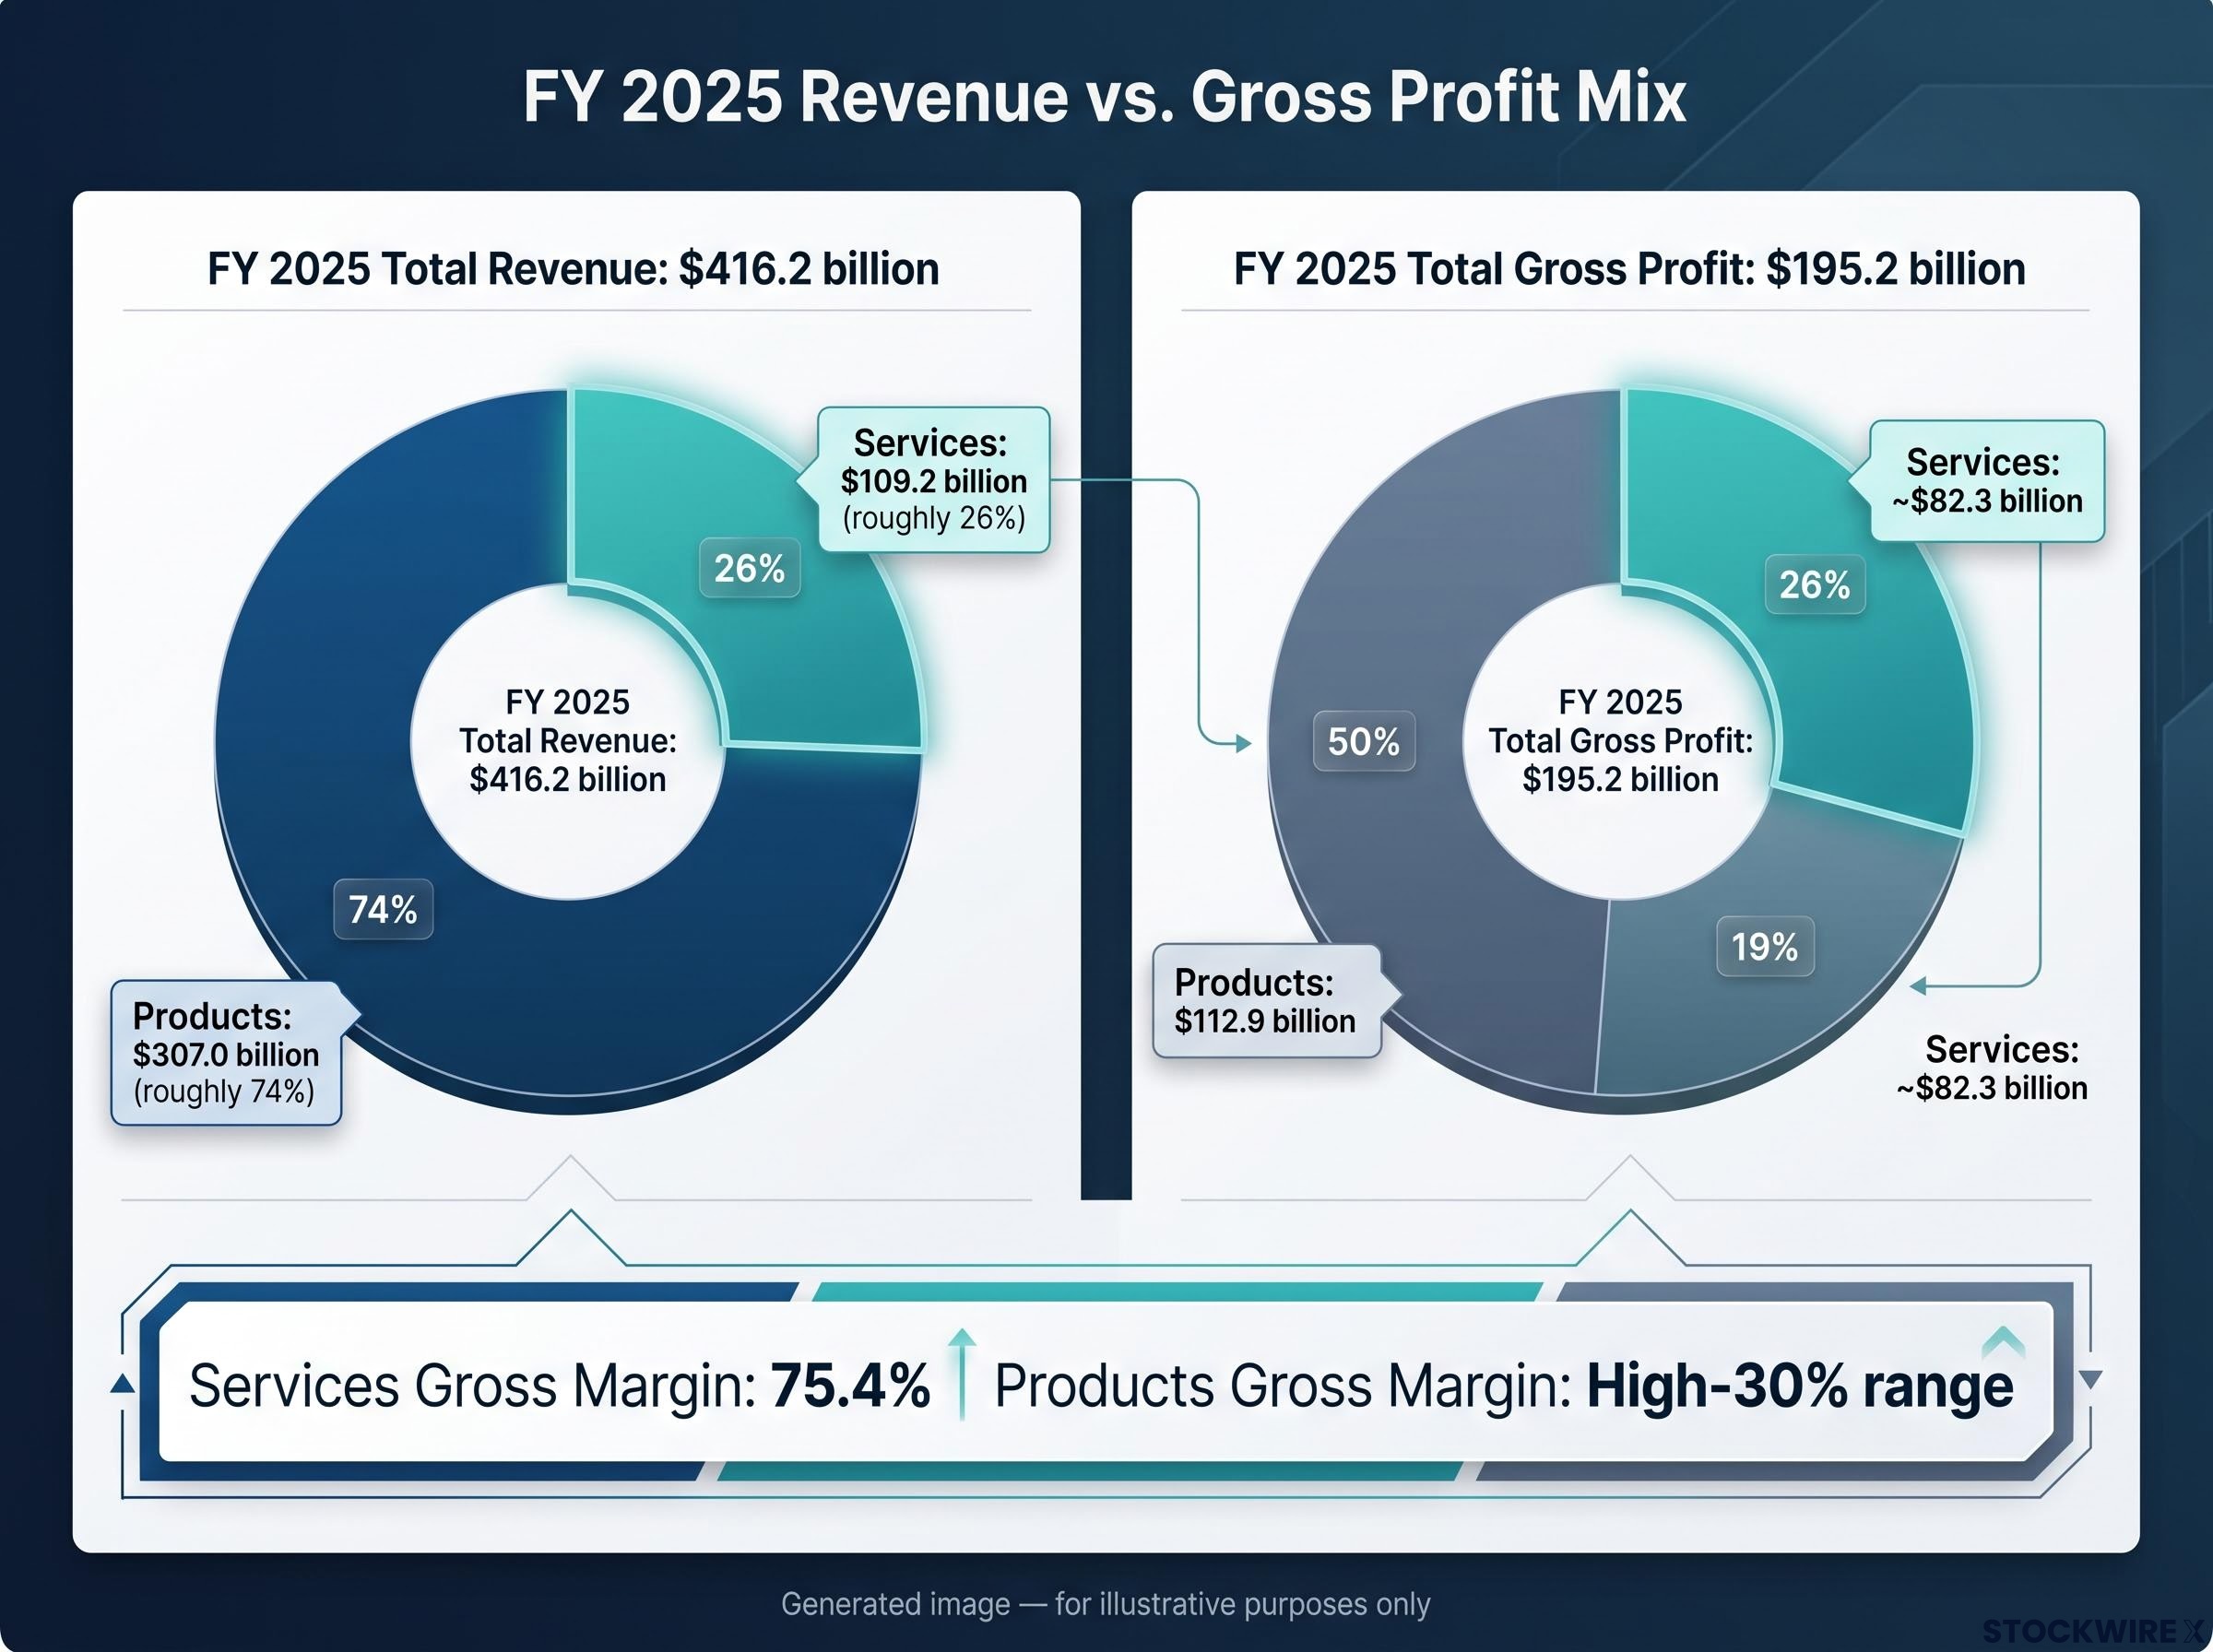
In fiscal year 2025, Apple’s services division produced $109.2 billion in revenue at a 75.4% gross margin, while the products segment operated in the high-30% margin range. Services accounted for roughly 26% of total revenue but a structurally disproportionate share of gross profit. The blended company-wide gross margin has climbed from 43.3% in FY 2022 to 46.9% in FY 2025, a 3.6-percentage-point expansion that hardware engineering alone cannot explain. The explanation is mix.
Here is a framework for understanding how segment mix shifts drive profitability at scale, why the services economics are structurally different from hardware, and what the regulatory and AI vectors mean for the trajectory from here. The investor framing an Apple position without internalising this shift is working with an incomplete model.
How a quarter of Apple’s revenue generates the majority of its profit gains
Start with the arithmetic, because the arithmetic is the whole story. Services carried a 75.4% gross margin in FY 2025. Products sat in the high-30% range. That gap runs to roughly 38 to 39 percentage points, and it is the single mechanical fact that governs Apple’s earnings quality.
The margin spread that moves everything Services gross margin (~75%) versus products gross margin (high-30% range) creates a spread of approximately 38 to 39 percentage points. Every point of revenue mix that shifts toward services lifts the blended rate without Apple selling a single additional device.
That spread means Apple’s profitability improves not through a better iPhone, but through a changing revenue composition. When a segment carrying nearly double the margin of the rest of the business grows faster than the rest of the business, the blended number rises on its own.
The dollar weight makes the point sharper. On $109.2 billion of FY 2025 services revenue at a 75.4% margin, the segment generated roughly $82.3 billion in gross profit. Against total company gross profit of $195.2 billion on $416.2 billion of net sales, a segment supplying about a quarter of revenue delivered well over 40% of the profit.
Apple’s FY 2025 10-K filing discloses the segment-level gross margin and revenue data underlying this analysis, confirming services gross profit at a materially higher rate than the products segment across each reported quarter of the fiscal year.
| Fiscal Year | Services Gross Margin | Company-Wide Gross Margin | Services Revenue (approx.) |
|---|---|---|---|
| FY 2022 | 71.7% | 43.3% | Below FY 2023 base |
| FY 2023 | 70.8% | 44.1% | ~$85.2B |
| FY 2024 | 73.9% | 46.2% | ~$96.2B |
| FY 2025 | 75.4% | 46.9% | $109.2B |
Read the two right-hand columns together and the mechanism is visible: the blended rate rises in lockstep with the growing weight of a 75%-margin business.
Four years of diverging trajectories
The divergence is what turns this from a good quarter into a structural story. Between 2021 and 2025, services revenue expanded by roughly 60%. Over that same window, iPhone revenue grew about 9%, and several other hardware lines declined.
Services gross profit dollars tell the same tale twice over. They rose from approximately $60.3 billion in FY 2023 to roughly $82.3 billion in FY 2025, a trajectory reflecting revenue growth and margin expansion happening at the same time.
For anyone modelling Apple’s earnings, the takeaway is precise: the margin gap means every point of mix that tilts toward services raises the blended margin mechanically, with no new device required. Miss that lever and you will misattribute the source of Apple’s profitability gains, treating a structural change as a cyclical one.
When big ASX news breaks, our subscribers know first
Why the App Store, iCloud, and subscriptions are structurally different businesses
The margin figure is impressive on its own. What matters more for a long-term position is whether it is defensible, and the economics suggest it is architected to be.
Services carry large fixed costs (data centres, infrastructure, software development) but very low incremental cost per additional user or transaction. That is why services cost of sales held at roughly 24-25% of services revenue from FY 2024 into FY 2025 even as revenue climbed sharply. In FY 2024, services cost of sales ran about $25.1 billion on $96.2 billion of revenue, a cost ratio near 26%, and the ratio tightened further the following year.
The durability rests on three structural drivers:
- Low incremental cost: Once the platform exists, each new subscriber or transaction adds revenue at minimal added cost, so margins hold even as volume scales.
- Ecosystem lock-in: Two-sided network effects in the App Store (more users attract more developers, more apps attract more users) combine with switching costs baked into iCloud backups and purchased content.
- Bundling mechanics: Apple One packages iCloud, Music, TV+, and Arcade into a single subscription, lifting average revenue per user while reducing churn and softening the visibility of individual price rises.
The monetisable pool behind all of this is the installed base, not current-period hardware sales. That distinction is the reason services keep growing even in quarters when iPhone units stall.
Hardware share gains in 2026 are acting as a leading indicator for the installed base expansion that directly widens the addressable pool for iCloud, Apple Music, AppleCare, and App Store spending in the 2027-2028 reporting windows.
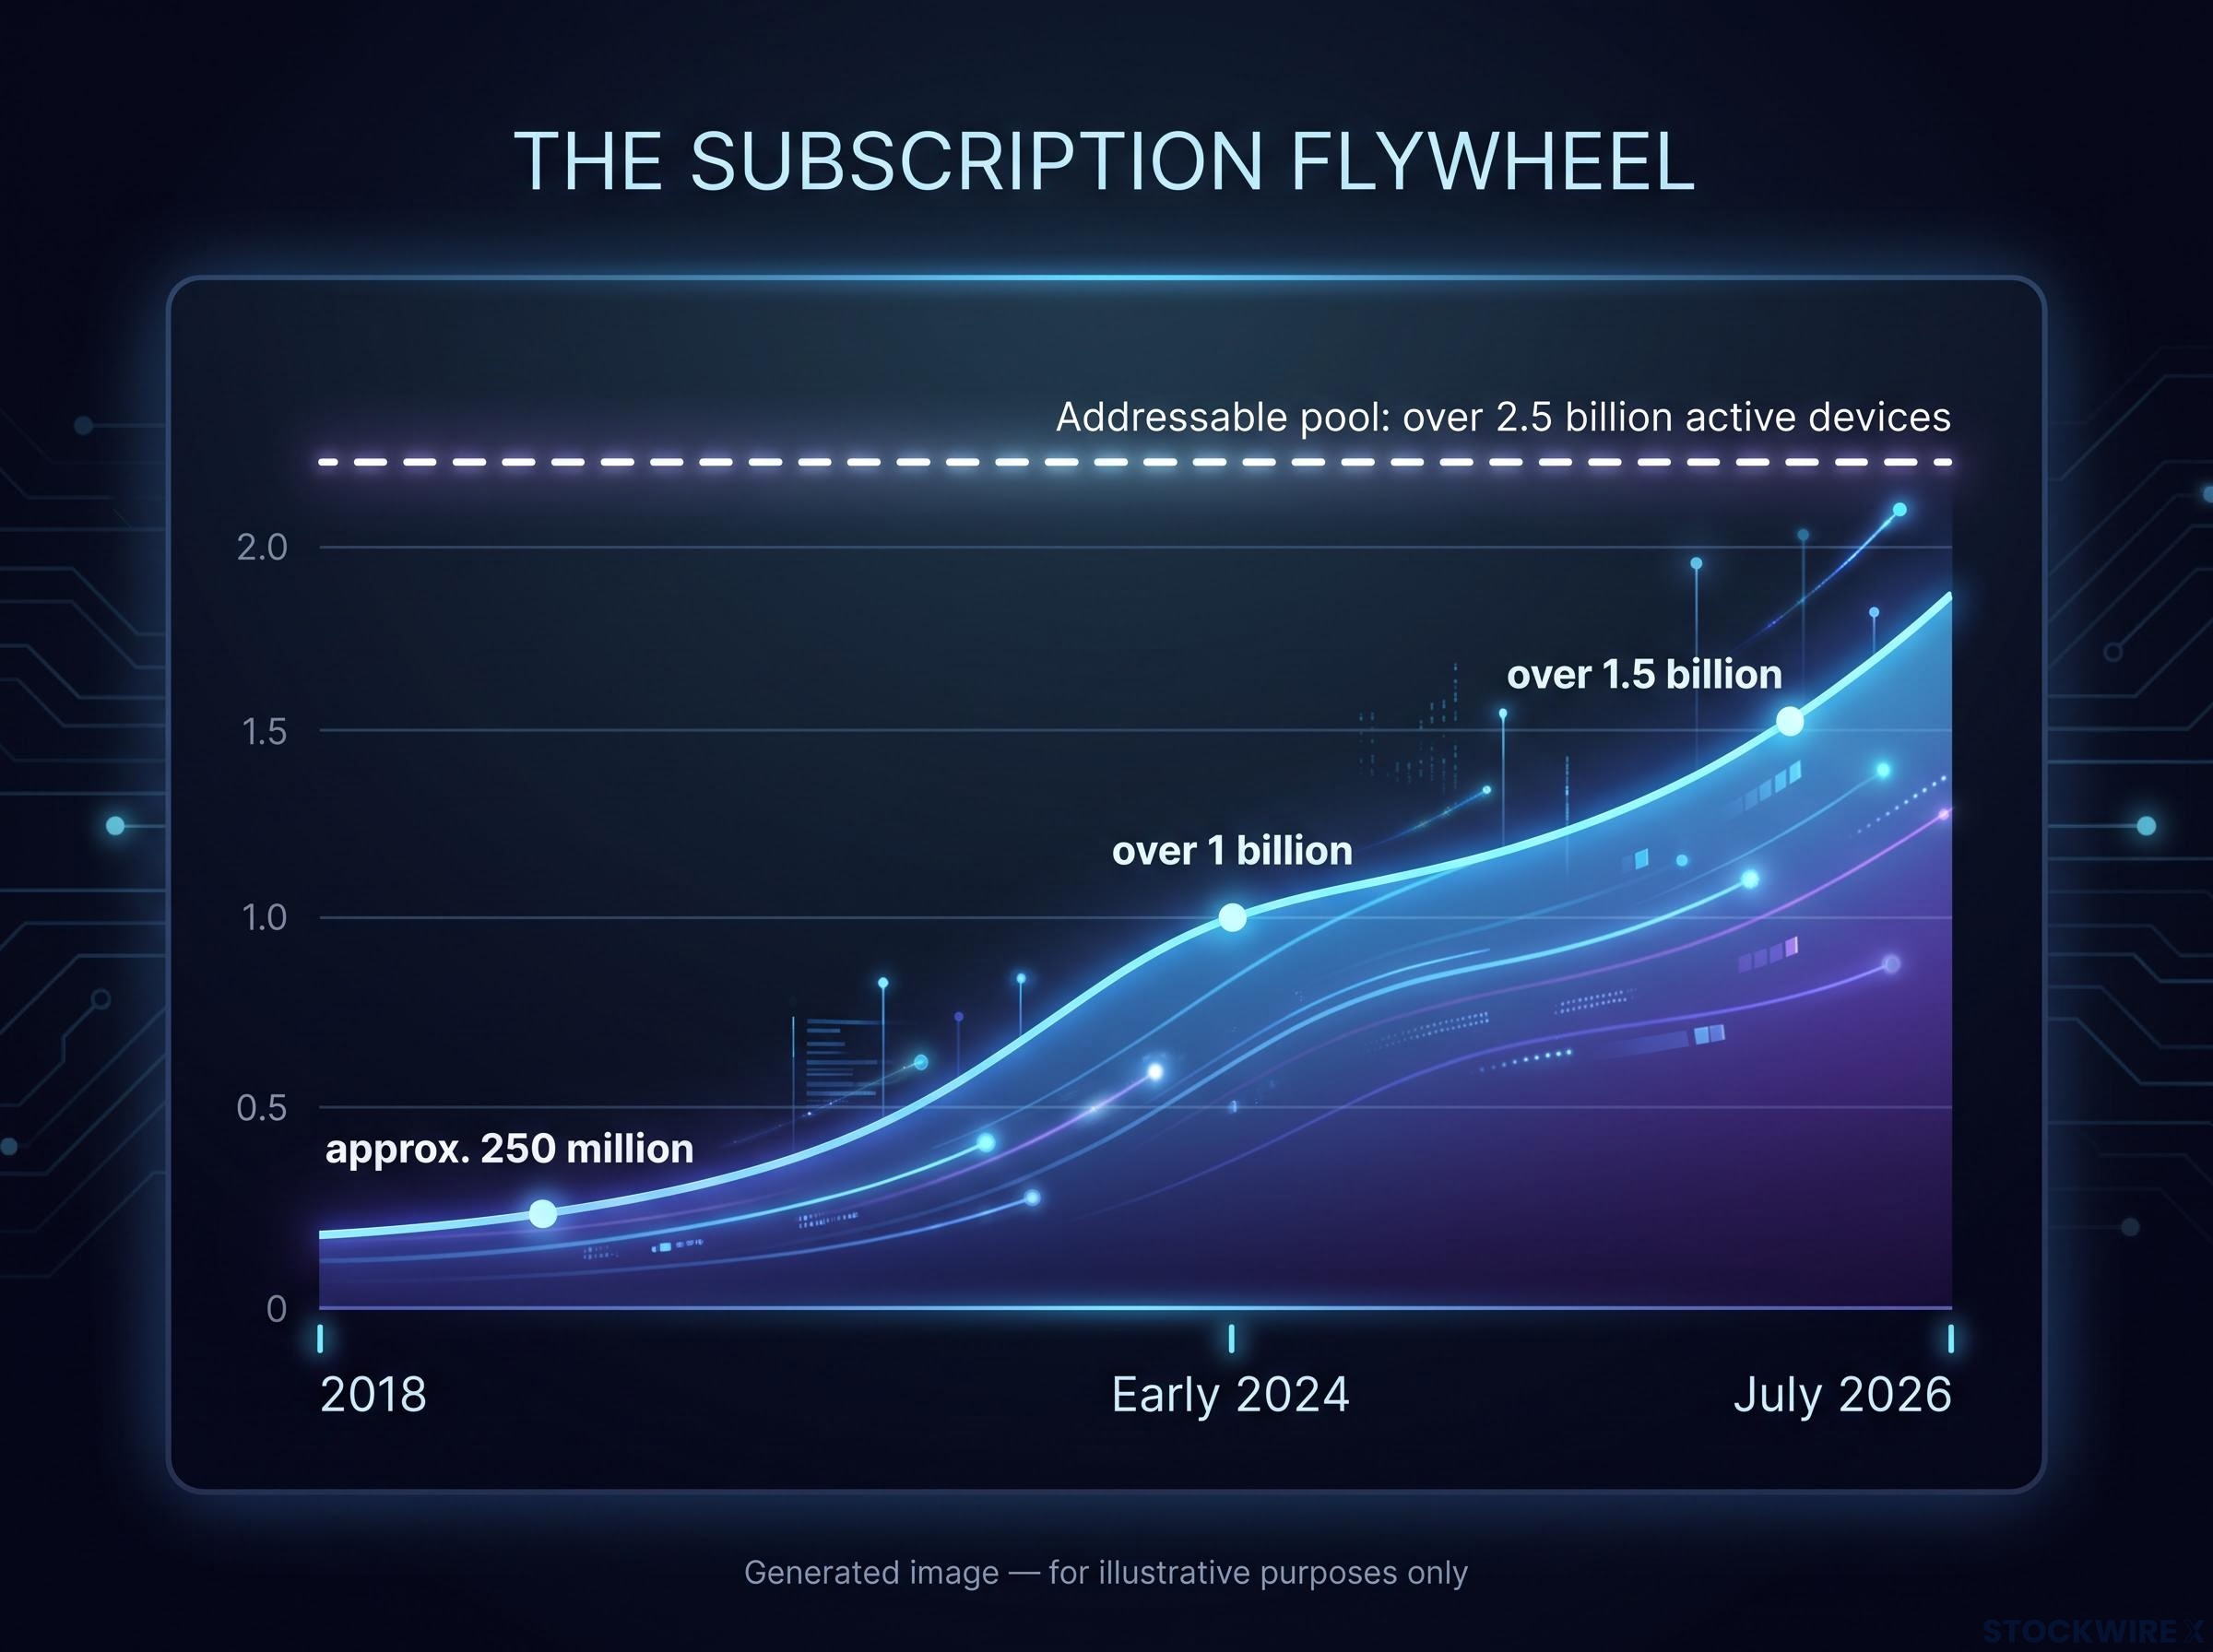
The subscription flywheel in numbers Paid subscriptions climbed from approximately 250 million in 2018 to over 1 billion in early 2024, and surpassed 1.5 billion as of July 2026. The addressable pool is Apple’s active installed base of more than 2.5 billion devices, not the phones sold this quarter.
| Characteristic | Services | Products |
|---|---|---|
| Cost structure | High fixed, low incremental | Per-unit component and assembly cost |
| Revenue predictability | Largely recurring, subscription-based | Cyclical, upgrade-driven |
| Switching cost level | High (backups, content, integration) | Moderate |
| Margin profile | ~75% | High-30% range |
What this tells you as an investor is that the current margin profile is not a favourable moment waiting to revert. The cost base does not scale proportionally with users once the platform is built, which is precisely why the segment stays high-margin as it grows. That is the difference between a margin you can pay a premium for and one you cannot.
The risks that complicate the services bull case
A margin premium this large invites a harder question: what could break it? The honest answer is not “nothing,” and the specific mechanisms deserve naming rather than a vague nod to “risks.”
The most structurally significant threat sits with regulators. Apple’s 30% App Store commission structure is under active scrutiny in both the EU and the US, where authorities have examined alternative app distribution, sideloading, and competing in-app payment systems. Alongside it, Google’s status as Apple’s default search partner, a licensing arrangement that channels a material stream of high-margin revenue, remains under ongoing regulatory review in multiple jurisdictions.
Ranked by structural weight, four risks complicate the thesis:
- Regulatory and antitrust exposure: Forced changes to App Store take rates or the Google search default could compress services margins directly.
- Concentration risk: Services revenue leans heavily on App Store commissions and licensing and advertising categories, so pressure on either produces outsized segment impact.
- Hardware dependence: Services growth draws from the installed base, so if hardware unit growth stalls structurally or ecosystem lock-in weakens, the subscription trajectory is not independent of the device business.
- Valuation already reflects the narrative: Some institutional commentators, including perspectives from JPMorgan and Visible Alpha, argue the stock already trades in line with software and platform peers, leaving less margin of safety if growth disappoints.
That tension surfaced clearly in Apple’s fiscal Q2 2026 result, where record revenue of $111.2 billion and a $100 billion buyback authorisation still produced a stock decline, with the valuation overhang from unresolved AI monetisation and the Cook-to-Ternus succession weighing more heavily than the headline numbers.
Where the concentration bites Services revenue is weighted toward App Store commissions and licensing and advertising. That concentration means a policy change in either area lands with disproportionate force on the whole segment, rather than being absorbed across a diversified base.
There is also the saturation argument. Some analysts warn Apple may be nearing average-revenue-per-user ceilings in mature markets, where users already hold multiple subscriptions and further upsells meet resistance.
For an investor building a position partly on the services growth thesis, the read is this: the durability of the margin premium is a regulatory and competitive question as much as an operational one. That should temper how much multiple expansion you assume. A bull case that admires the margin data in isolation, while ignoring the concentration and policy exposure sitting underneath it, is an incomplete thesis.
What the AI freemium model adds to the services calculus
Set aside the feature demos. The relevant question for the services trajectory is whether Apple’s AI push is a monetisation mechanic, and it is being built as one.
The architecture is freemium: basic AI features available at no charge on recent devices, with usage caps that trigger a paid subscription tier. It mirrors playbooks seen elsewhere, where AI becomes a feature-based upsell layered onto an existing subscription base rather than a standalone product. Apple’s emphasis on on-device, privacy-first processing gives it a distinct position relative to cloud-centric AI providers.
Apple Intelligence architecture routes queries to on-device models or Private Cloud Compute servers, a structural privacy moat that shapes the services revenue trajectory in ways that cloud-centric AI competitors cannot easily replicate at equivalent OS depth.
The recent numbers show the base the AI layer would build on. In fiscal Q3 2026 (quarter ended 27 June 2026), services revenue hit a record $30.7 billion, up 12% year over year, at a 75.6% gross margin. That is the profile any AI monetisation must either extend or defend.
Three upside vectors are worth tracking:
- ARPU uplift: AI-enhanced tiers within iCloud+, Apple One, or productivity features could justify higher price points without launching new product lines.
- Device upgrade stimulation: Chip-dependent AI features can pull forward hardware upgrades while reinforcing ecosystem retention.
- Privacy-premium positioning: On-device processing could support a privacy-first AI subscription that appeals to enterprise and high-value consumer segments.
Where the margin risk lives in an AI-expanded services model
Here is where serious analysis has to sit with the ambiguity rather than resolve it early. The current services model earns its 75%-plus margin because incremental cost is minimal. AI workloads do not obey that rule.
Compute-intensive AI, particularly the hybrid on-device and cloud execution Apple is pursuing, carries a genuinely different cost structure. Serving advanced AI features can raise cost of sales in a way that streaming a song or storing a photo does not, which puts pressure on the very margin profile investors have come to price in.
The critical execution variable is pricing discipline, not feature quality. Charging enough for advanced AI tiers to offset compute cost is what determines whether the margin holds. Get the price too low and margins erode; too high and adoption stalls.
Three risk vectors deserve equal weight to the upside:
- Compute cost margin pressure: Hybrid AI processing could lift cost of sales and compress the services margin.
- Execution and willingness to pay: Users must see clear value in paying beyond existing services, or they default to cross-platform AI tools.
- Regulatory scrutiny of AI feature tying: Binding advanced AI to specific devices or bundles could attract antitrust attention.
No explicit quantified AI freemium revenue projections have been identified from accessible sources as of September 2026. The practical read for an investor is to treat the AI layer as an option on future monetisation, not a near-term earnings catalyst to model with confidence, given the compute-cost uncertainty and the nascent state of AI subscription pricing across the industry.
Framing Apple as a platform business, and what that framing costs
Pull the threads together and a cleaner analytical position emerges, one that neither the hardware narrative nor the services narrative delivers alone.
History offers precedent for the re-rating that a mix shift can trigger. Microsoft moved from perpetual software licences to Office 365 and Azure subscriptions, and Adobe shifted from boxed Creative Suite to Creative Cloud. Both saw recurring revenue lift margins and, in time, valuation multiples. Both also carried execution risk and, at scale, regulatory scrutiny. The precedent is encouraging and cautionary in equal measure.
Apply that to Apple and the reframe is specific. Apple is not a hardware company with a services division bolted on, nor is it a pure services platform. It is a hybrid whose services economics are inseparable from its hardware installed base.
The profit weight, in dollars In FY 2025, services generated roughly $82.3 billion of gross profit against a company total of $195.2 billion. A segment supplying about 26% of revenue delivered a far larger slice of the profit.
The floor and the ceiling are both defined by that installed base. Services revenue keeps expanding even when iPhone sales stagnate, as long as users hold their existing devices, which sets the earnings floor. The pool of over 2.5 billion active devices sets the ceiling on how far services monetisation can run.
| Framing | What it gets right | What it misses |
|---|---|---|
| Hardware cycle stock | Device sales still drive the installed base | Undervalues the recurring earnings floor; implies too low a multiple |
| Pure services platform | Captures recurring, high-margin revenue quality | Ignores regulatory and hardware-dependency risk; implies too high a multiple |
| Hybrid installed-base monetisation | Prices both recurring quality and installed-base dependency | Requires holding two variables at once; no single clean multiple |
The most useful position treats the installed base as the asset and the services economics as the mechanism for monetising it, because that is structurally what Apple has built. The investor who prices it purely as a hardware cycle undervalues the earnings floor; the one who prices it as a pure software platform ignores the risks that cap the multiple.
Watching the right numbers as the mix shift continues
Analysis is only useful if it tells you what to watch next. Over the coming 12 to 24 months, three metrics carry the most signal for the services thesis, in order of analytical weight:
- Services gross margin trajectory: Whether the 75%-plus level holds as AI compute costs rise. This is the earliest place margin pressure would show.
- Paid subscription growth rate: Whether the pace from over 1 billion in early 2024 to more than 1.5 billion in July 2026 continues or decelerates.
- Regulatory outcome signals: Resolutions from EU and US proceedings on App Store commissions and the Google search default.
It helps to separate what is settled from what is genuinely open.
Known:
- The four-year company-wide gross margin expansion from 43.3% (FY 2022) to 46.9% (FY 2025).
- The installed base of over 2.5 billion active devices.
- The paid subscription count above 1.5 billion as of July 2026.
Uncertain:
- The revenue quantum an AI freemium model can realistically generate.
- The timeline and outcome of the regulatory proceedings.
- Saturation dynamics in mature markets.
Each earnings cycle, the two disclosure items worth examining first are the quarterly services revenue figure (last recorded at $30.7 billion in Q3 FY 2026) and the services gross margin (75.6% in the same quarter). Together they reveal growth trajectory and cost discipline at once. Know which numbers to read and you can tell whether the services thesis is strengthening, plateauing, or bending under regulatory pressure, rather than reacting to a headline revenue or EPS line.
For investors wanting to model the specific margin pressure on the hardware side, our dedicated guide to Apple’s memory cost headwind covers Tim Cook’s public warnings, the Mac Mini repricing already implemented, and the DRAM and NAND flash dynamics that determine how much gross margin relief the services mix can realistically provide.
This article is for informational purposes only and should not be considered financial advice. Investors should conduct their own research and consult with financial professionals before making investment decisions. Past performance does not guarantee future results, and financial projections are subject to market conditions and various risk factors. Forward-looking statements regarding AI monetisation and regulatory outcomes are speculative and subject to change based on market developments and company performance.