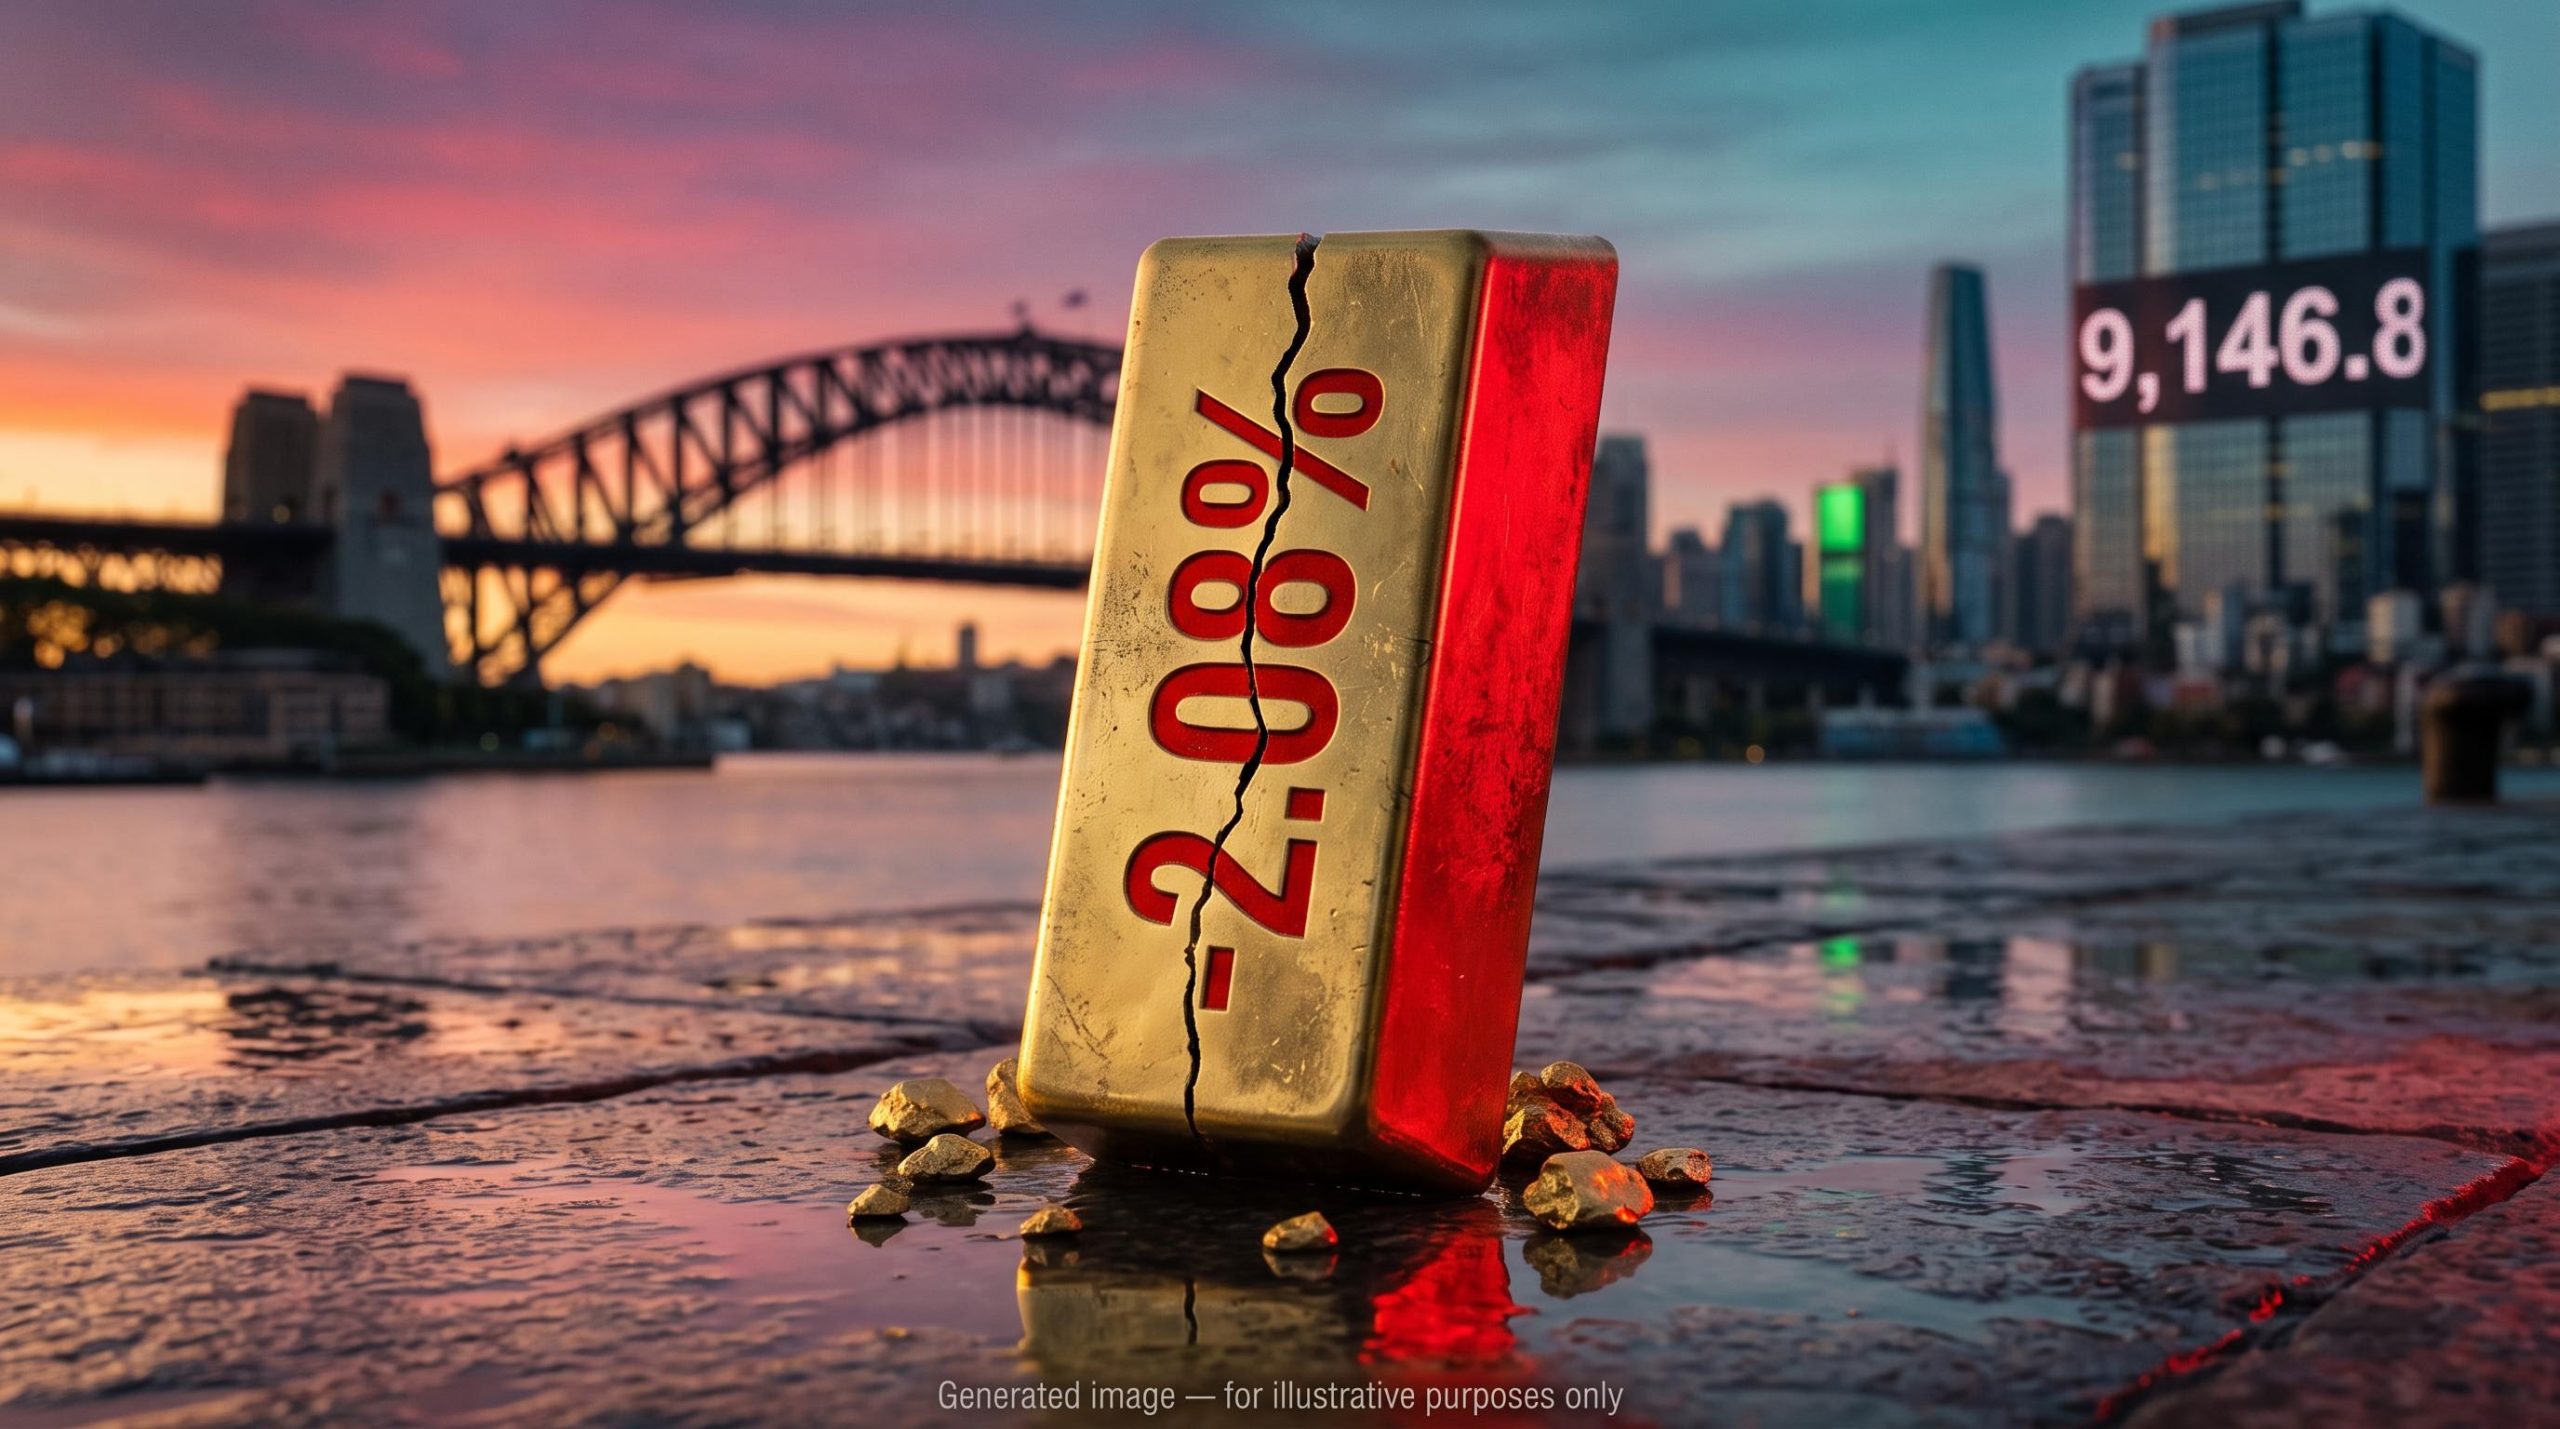
The S&P/ASX 200 finished Thursday 12 November 2026 at 9,146.8, down just 6.4 points or 0.07%. That flat close hid a gap of roughly 3 percentage points between the best and worst sectors. Financials rose 1.10% while Materials fell 2.08%.
The trigger came from Washington. A hotter-than-expected US inflation reading pushed the US 10-year Treasury yield back towards 5%. Higher yields moved money out of resources and into banks and defensive stocks.
For you, the session shows where your portfolio’s real exposure sits: resources on one side, banks and defensives on the other. It also points to what to watch before Monday.
Why did a hot US inflation print hit ASX gold miners hardest?
The yield and gold link
The chain started with US core consumer price index (CPI) data, which measures price changes excluding food and energy. Core CPI rose 0.3% in October against a 0.2% consensus. It was the third straight 0.3% monthly rise. Headline CPI rose 0.4%, easing from 0.6% in September.
Bond markets responded quickly. The US 10-year yield climbed about 12.55 basis points to 4.988%. A basis point is one hundredth of a percentage point. Traders also raised the odds of a 50-basis-point US Federal Reserve rate hike in December.
The repricing of December Fed hike odds has been building since a strong payrolls print, with a supply-driven energy shock complicating what tighter policy can actually fix.
That sequence ran straight into gold:
- Inflation surprise: Core CPI beat forecasts for a third month running.
- Yields and Fed odds: Treasury yields and rate-hike expectations both rose.
- Dollar and gold: A firmer US dollar and higher yields raised the cost of holding gold, which pays no interest.
- Miner leverage: Fixed mining costs turned a modest bullion fall into a steep equity fall.
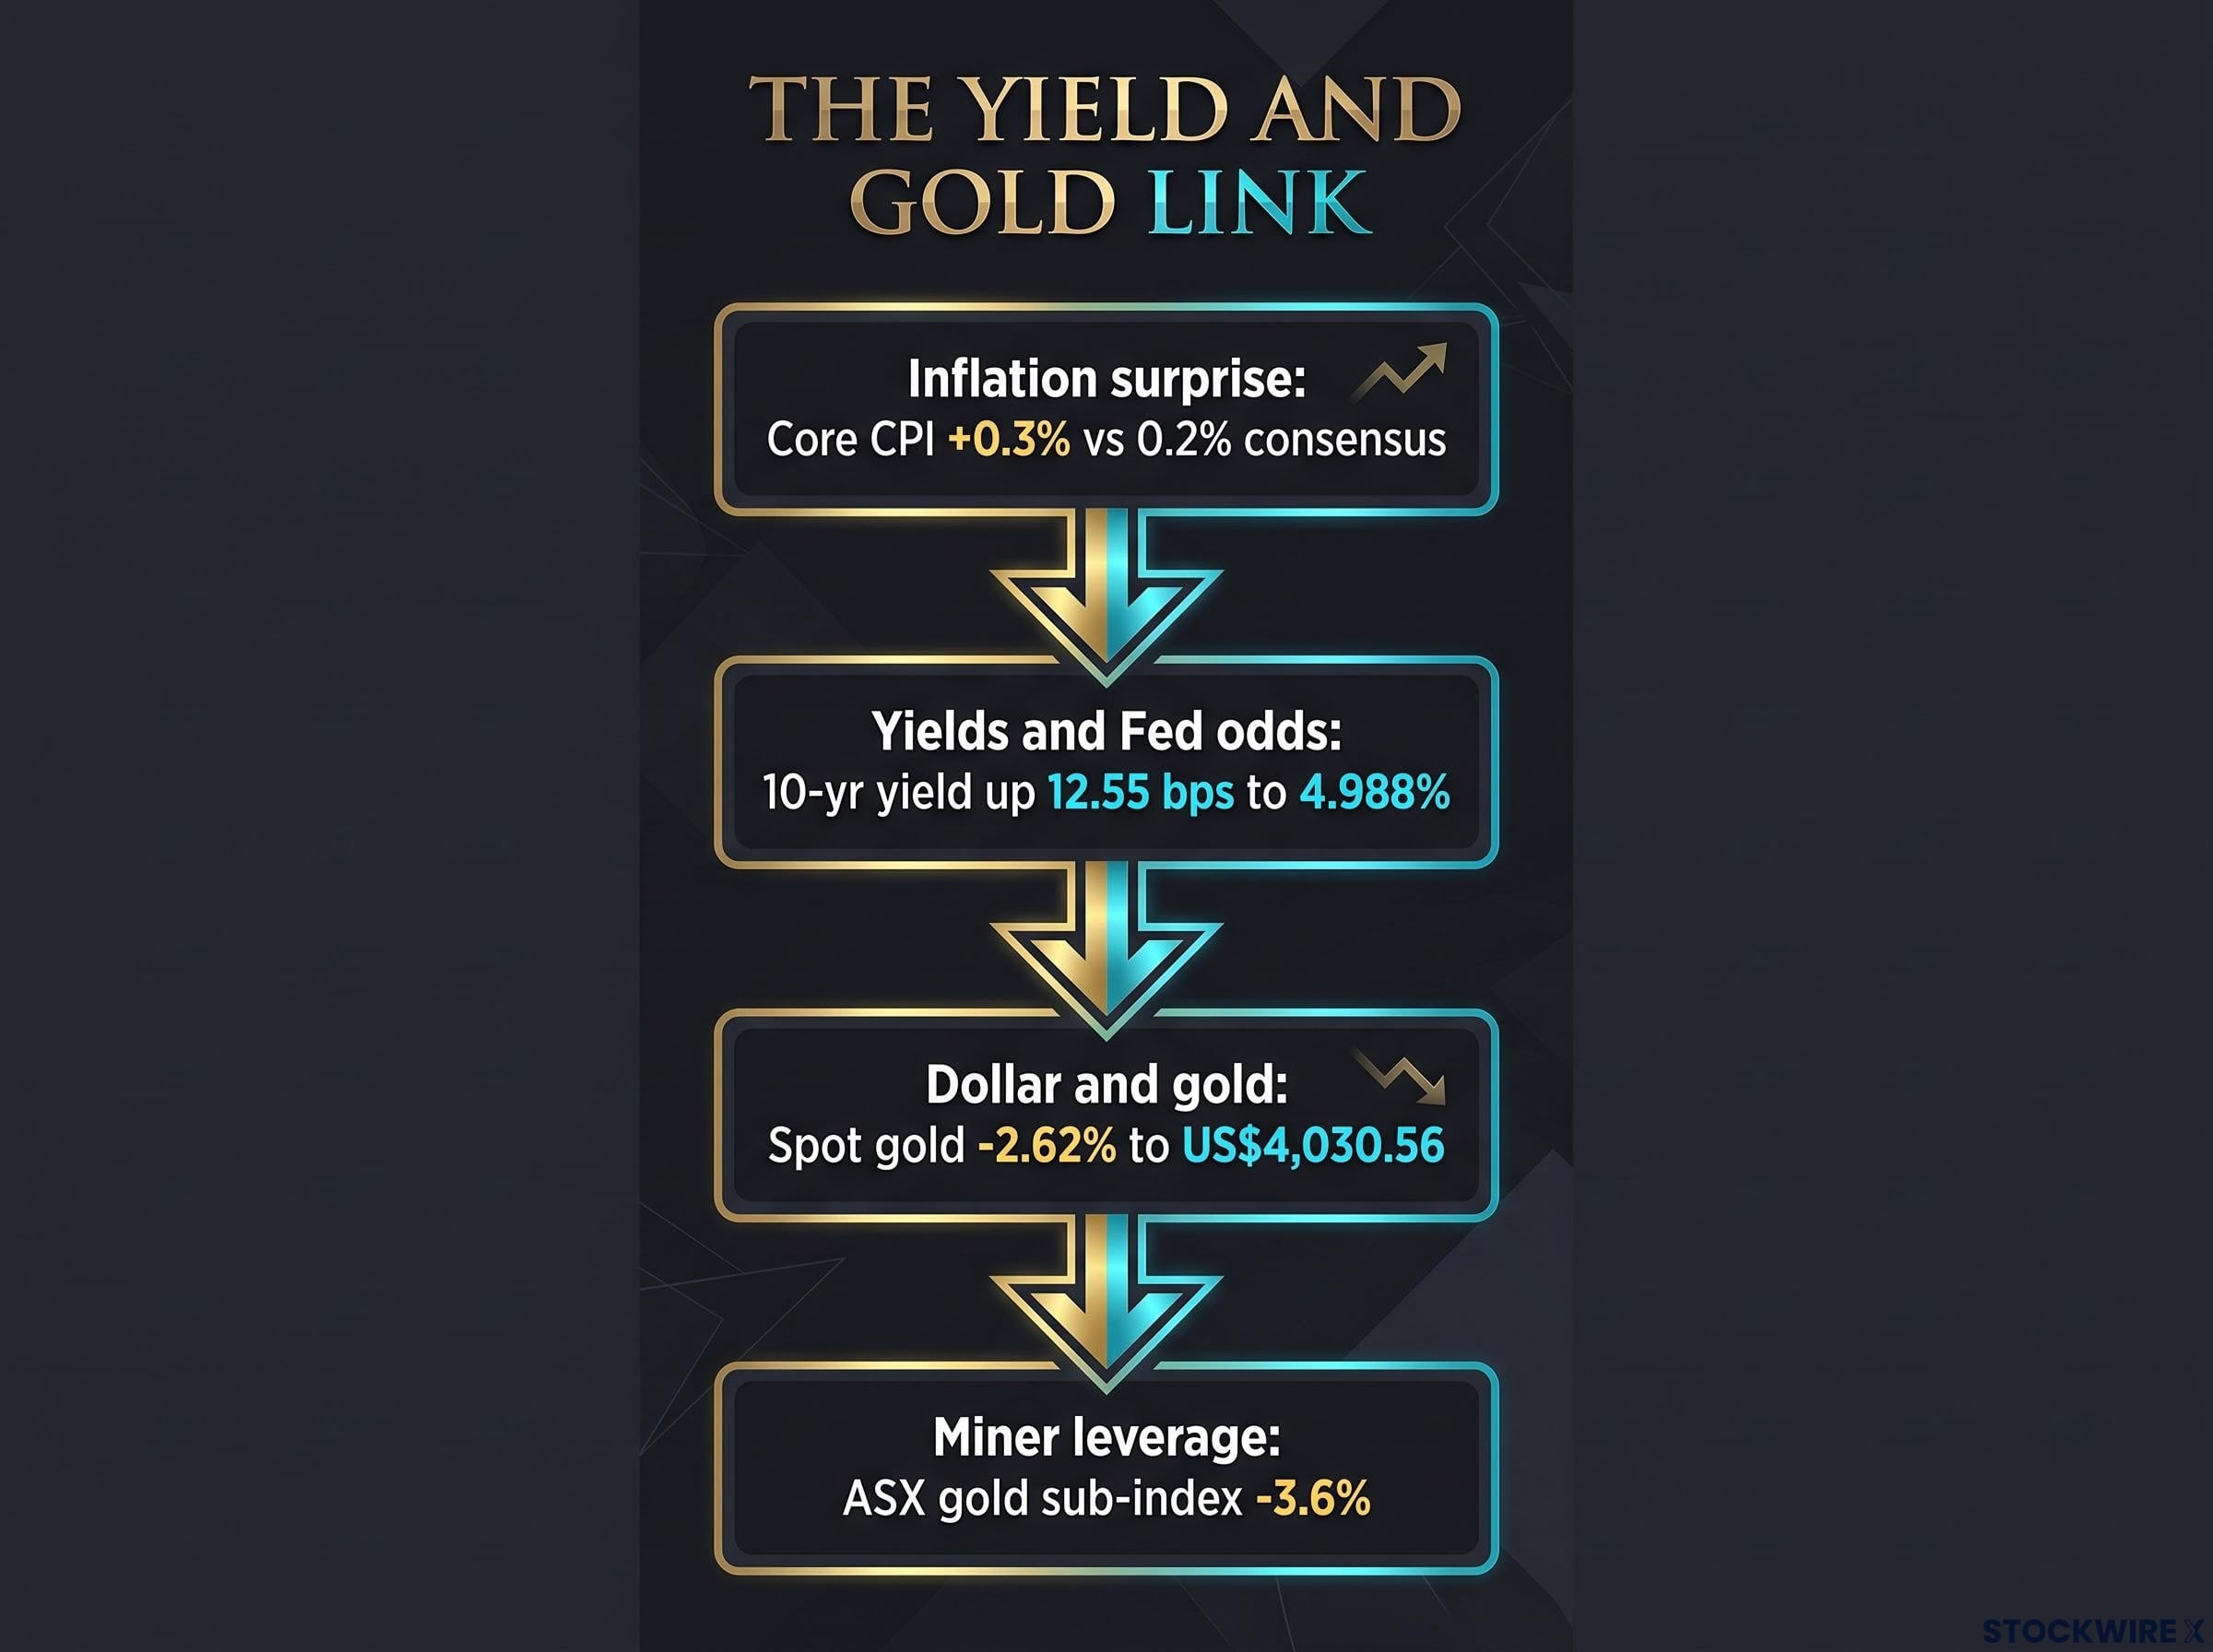
A chain reaction started with Core CPI at +0.3%, pushing the 10-yr yield up 12.55 bps to 4.988% and ultimately causing the ASX gold sub-index to drop -3.6%.
Spot gold fell 2.62% to US$4,030.56 after the release. Market Index reported that COMEX gold slipped a further 0.4% in Asian trade to US$3,984.30/oz.
The link between yields and gold does not always work this way. State Street Global Advisors wrote on 5 November that yields rising on fiscal or inflation risk premia, meaning the extra return investors demand for government debt or inflation risk, can eventually support gold.
Why miners fall further than bullion
Labour, diesel and contractor costs stay the same when gold falls. That means each dollar lost on the gold price comes almost entirely out of profit margins.
The ASX gold sub-index was down 2.7% at midday and closed down 3.6%. Genesis Minerals fell 5.4%, Ora Banda 5.3%, Black Cat 4.5% and Evolution 4.2%. The Australian dollar eased 0.20% to US$0.6834, which gave miners little relief.
If you hold gold stocks through an ETF or your super fund, keep this in mind: with US yields near 5%, a small move in bullion can turn into a much larger move in your holdings.
How did the market split between resources and defensives?
The sector scorecard shows the full spread.
| Sector | Move |
|---|---|
| Financials | +1.10% |
| Health Care | +0.61% |
| Real Estate | +0.60% |
| Communication Services | +0.43% |
| Industrials | +0.40% |
| Information Technology | +0.25% |
| Energy | +0.10% |
| Consumer Discretionary | -0.26% |
| Consumer Staples | -0.27% |
| Utilities | -1.03% |
| Materials | -2.08% |
Resources sold on sentiment, not price
The odd part of the day is how little commodity prices actually moved:
- Lithium: Carbonate fell just 0.2%, yet Elevra dropped 8.4%, PLS 8.1%, Liontown and Vulcan 7.0% each, and IGO 5.1%.
- Uranium: The price fell 0.6%, while Boss lost 9.4%, Deep Yellow 7.4%, Lotus 7.3% and Silex 6.3%.
- Rare earths: NdPr oxide eased 0.5%, but Lynas fell 4.2% and Iluka 2.7%.
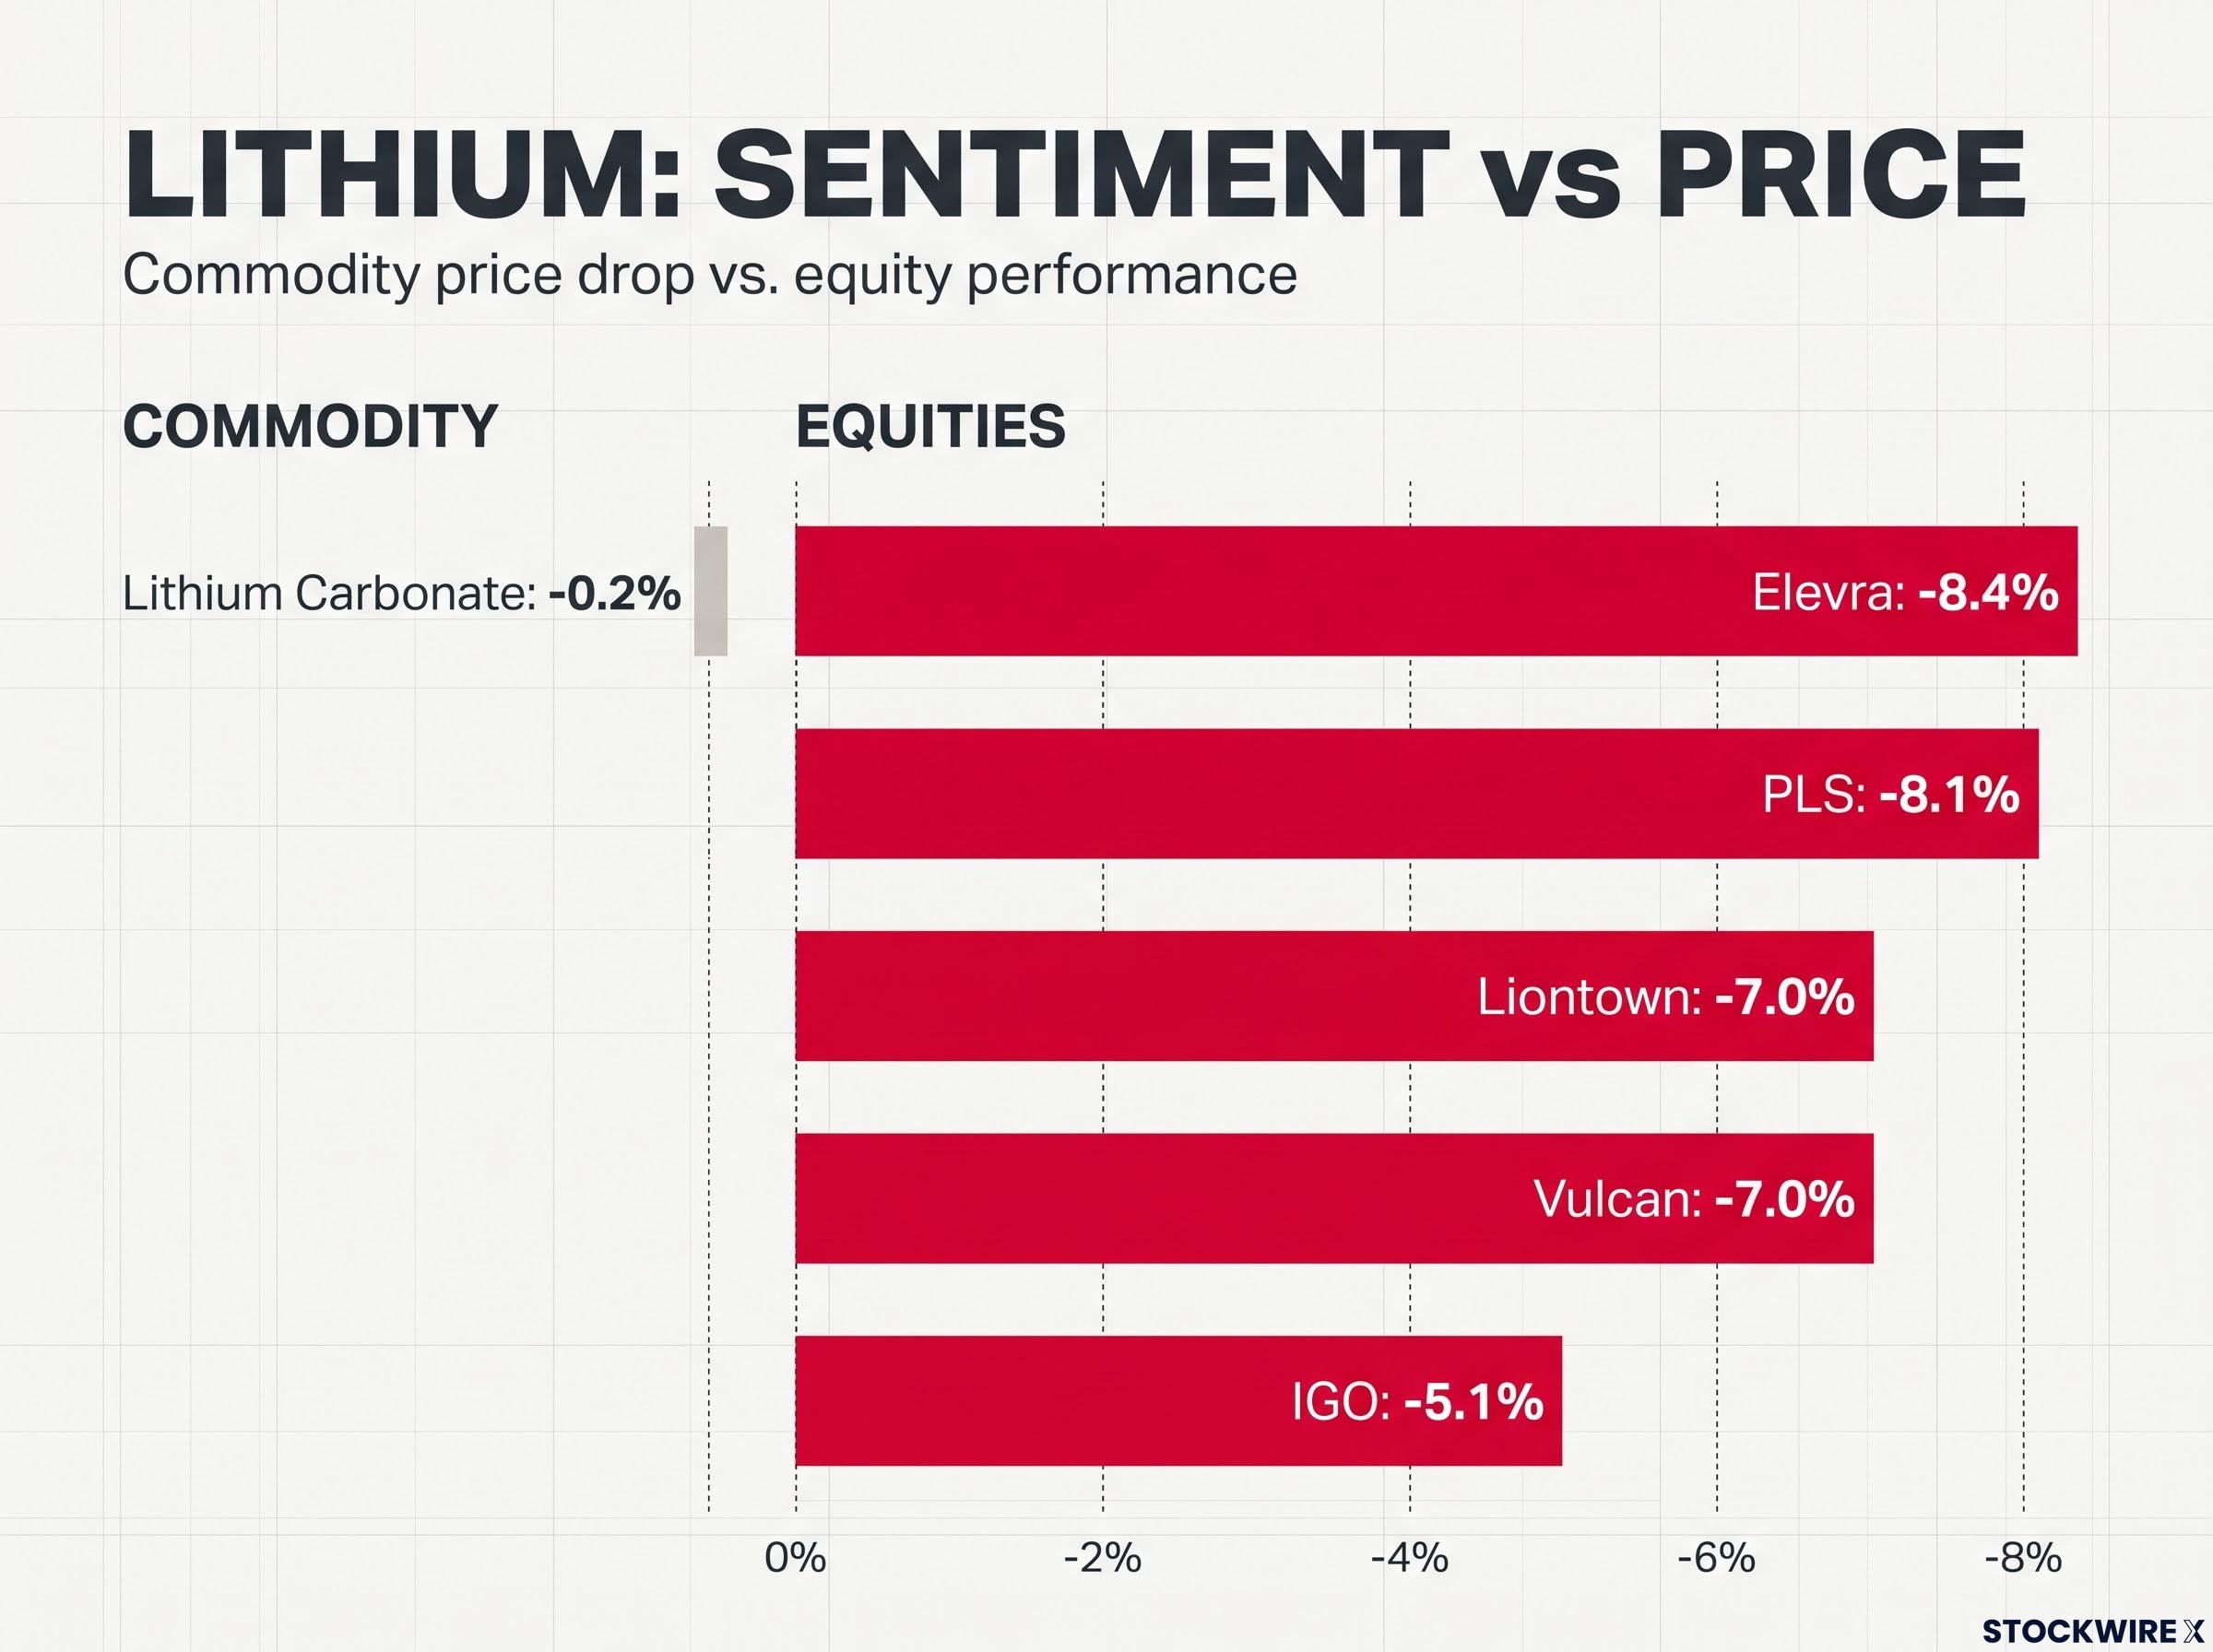
Despite Lithium Carbonate at -0.2%, associated equities saw severe drops like Elevra -8.4% and PLS -8.1%.
Iron ore was the exception, with a real price move behind the selling. SGX iron ore fell 1.6% to US$90.60/t, and Fortescue (-2.4%) and Rio Tinto (-2.1%) followed it lower.
Banks and defensives held the index up
Commonwealth Bank climbed 2.9% and Westpac 1.9%. GPT added 2.8%, CSL 1.4%, Cochlear 1.5%, TPG Telecom 1.8% and Telstra 0.8%. The index closed at its session high.
CBA’s gain came despite ASIC’s Federal Court proceedings against the bank. It also came with broker targets sitting below the share price: Macquarie at $112, Morgan Stanley at $125, Morgans at $119.27 and Ord Minnett at $120. Positioning and index flows may explain more of the rally than any change in how brokers value the bank.
Rising rates compress valuations through higher discount rates, and with the 10-year yield already near 5%, that pressure sits behind the move out of resources and into banks.
Market breadth tells the real story. In the ASX 300, 118 stocks rose and 164 fell. The All Ords dropped 0.18% and the Small Ords 0.99%.
If you hold a passive ASX 200 fund, the heavy weighting to banks cushioned your return, but many of the stocks inside it did not have a calm day. Check how much of your exposure sits in banks compared with miners.
Which stocks moved most, and what are investors watching next?
Biggest movers and company news
| Stock | Move | Close or detail | Catalyst |
|---|---|---|---|
| G8 Education | +90% | $0.19 | Scheme approach at $0.26 per share |
| Clarity Pharmaceuticals | +23.5% | $2.05 | FDA Breakthrough Therapy designation |
| Acrow | +16.3% | FY27 guidance raised | AGM update |
| Domino’s | +12.9% | $25.06 | Delayed reaction to the prior-day update |
| Xero | +6.1% | $75.17 | $1 billion buy-back and higher guidance |
| GQG Partners | -9.0% | $0.71 | October outflows; Barrenjoey cut to neutral |
Xero’s H1 FY27 revenue rose 46% to $1.7 billion. Paladin Energy stayed in a trading halt all day while it ran a fully underwritten $525 million raising. The raising is made up of about $474 million from an ASX institutional placement, a C$50 million Canadian placement, and a share purchase plan of up to $50 million.
Broker calls
- Citi cut its targets on PLS to $4.10 from $5.70, IGO to $5.75 and Liontown to $0.75. It kept its buy rating on PLS.
- Morgan Stanley lowered its Eagers Automotive target to $19.60 from $26.00.
- Morgan Stanley and Morgans downgraded Flight Centre.
- Barrenjoey moved GQG to neutral.
When a broker cuts its target but keeps a buy rating, it usually still sees long-term value but expects a weaker near-term price path. If you hold lithium stocks, weigh that alongside Friday’s US data.
Levels and data to watch
No major Australian data was released on Thursday. With US markets closed for Veterans Day, Nasdaq futures fell 1.15% and S&P 500 futures 0.47%.
The US October producer price index (PPI), which tracks wholesale prices, is due at 8:30 a.m. ET on Friday 13 November. That is Saturday morning in Australia (AEDT). Forecasts point to a 0.4% monthly rise in headline PPI and 0.3% in core PPI.
ChartWatch levels for the ASX 200 (Carl Capolingua) Nearest supply zone, where selling has tended to appear: 9,221-9,297. Short-term trend support: 8,886-8,921.
This article is for informational purposes only and should not be considered financial advice. Investors should conduct their own research and consult with financial professionals before making investment decisions.
What Friday’s US data could change for the rotation
Thursday was a rotation inside a strong market, not a broad breakdown. Yields near 5% set it off.
Fed rate hike market impact is not always negative: when a hike is well telegraphed, the removal of uncertainty has previously supported equities, which may help explain why banks and the index held firm.
Three things will decide whether the rotation runs further or reverses:
- PPI: whether Friday’s reading comes in above or below forecasts.
- Dollar and yields: whether the US dollar and Treasury yields keep climbing.
- Index levels: whether the ASX 200 holds above 8,886-8,921 or runs into selling at 9,221-9,297.
Keep State Street’s caveat in mind: if yields are rising because of fiscal stress rather than tighter Fed policy, that could eventually help gold.
At Monday’s open, watch the gold miners and lithium stocks for the first read on how the market has absorbed the PPI result.