The Federal Reserve raised interest rates this week, and instead of running for cover, Wall Street strategists cheered.
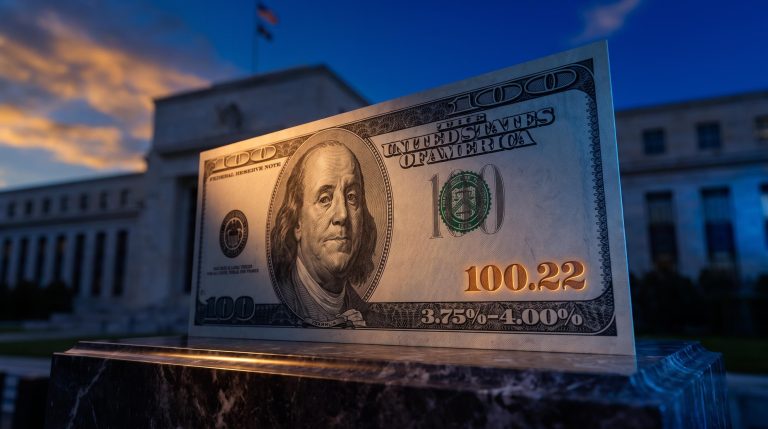
At its meeting on 15-16 September 2026, the Federal Open Market Committee (FOMC) lifted the target range for the federal funds rate by 25 basis points to 3.75-4.00%. That decision ended months of speculation about whether the central bank would tighten policy again, and it triggered an immediate rebound in equity markets.
For anyone trying to make sense of how a rate rise sparks relief rather than panic, the reaction offers a genuine lesson in reading central bank moves.
Understanding the Fed rate hike market impact means grasping a counterintuitive idea: sometimes a well-signalled tightening is the most reassuring thing a central bank can deliver. It removes doubt.
Here is the framework for interpreting decisions like this one, why anticipated hikes can lift stocks rather than sink them, and how to spot the energy-driven inflation risks still lurking beneath the rally.
Why a rate hike is sometimes exactly what your portfolio needs
Start with the premise that sounds wrong: a rate increase can be good news. The September decision is a case in point.
Barclays strategist Emmanuel Cau, in commentary published on 18 September 2026, described the Fed’s quarter-point rise as arguably the least damaging possible outcome for financial markets. He framed the meeting as a “resolution event.”
“The September decision reinforced the central bank’s credibility on inflation and should ultimately be viewed as constructive for markets,” Barclays strategist Emmanuel Cau noted, characterising the hike as arguably the least damaging possible result.
A resolution event is exactly what it sounds like. Once a widely anticipated policy move is finally delivered, a major source of uncertainty disappears, and investors can reprice assets with clearer information about where interest rates are heading.
That clarity matters more than the extra cost of borrowing. When the outcome is known, markets can get on with the work of valuing earnings, margins, and risk.
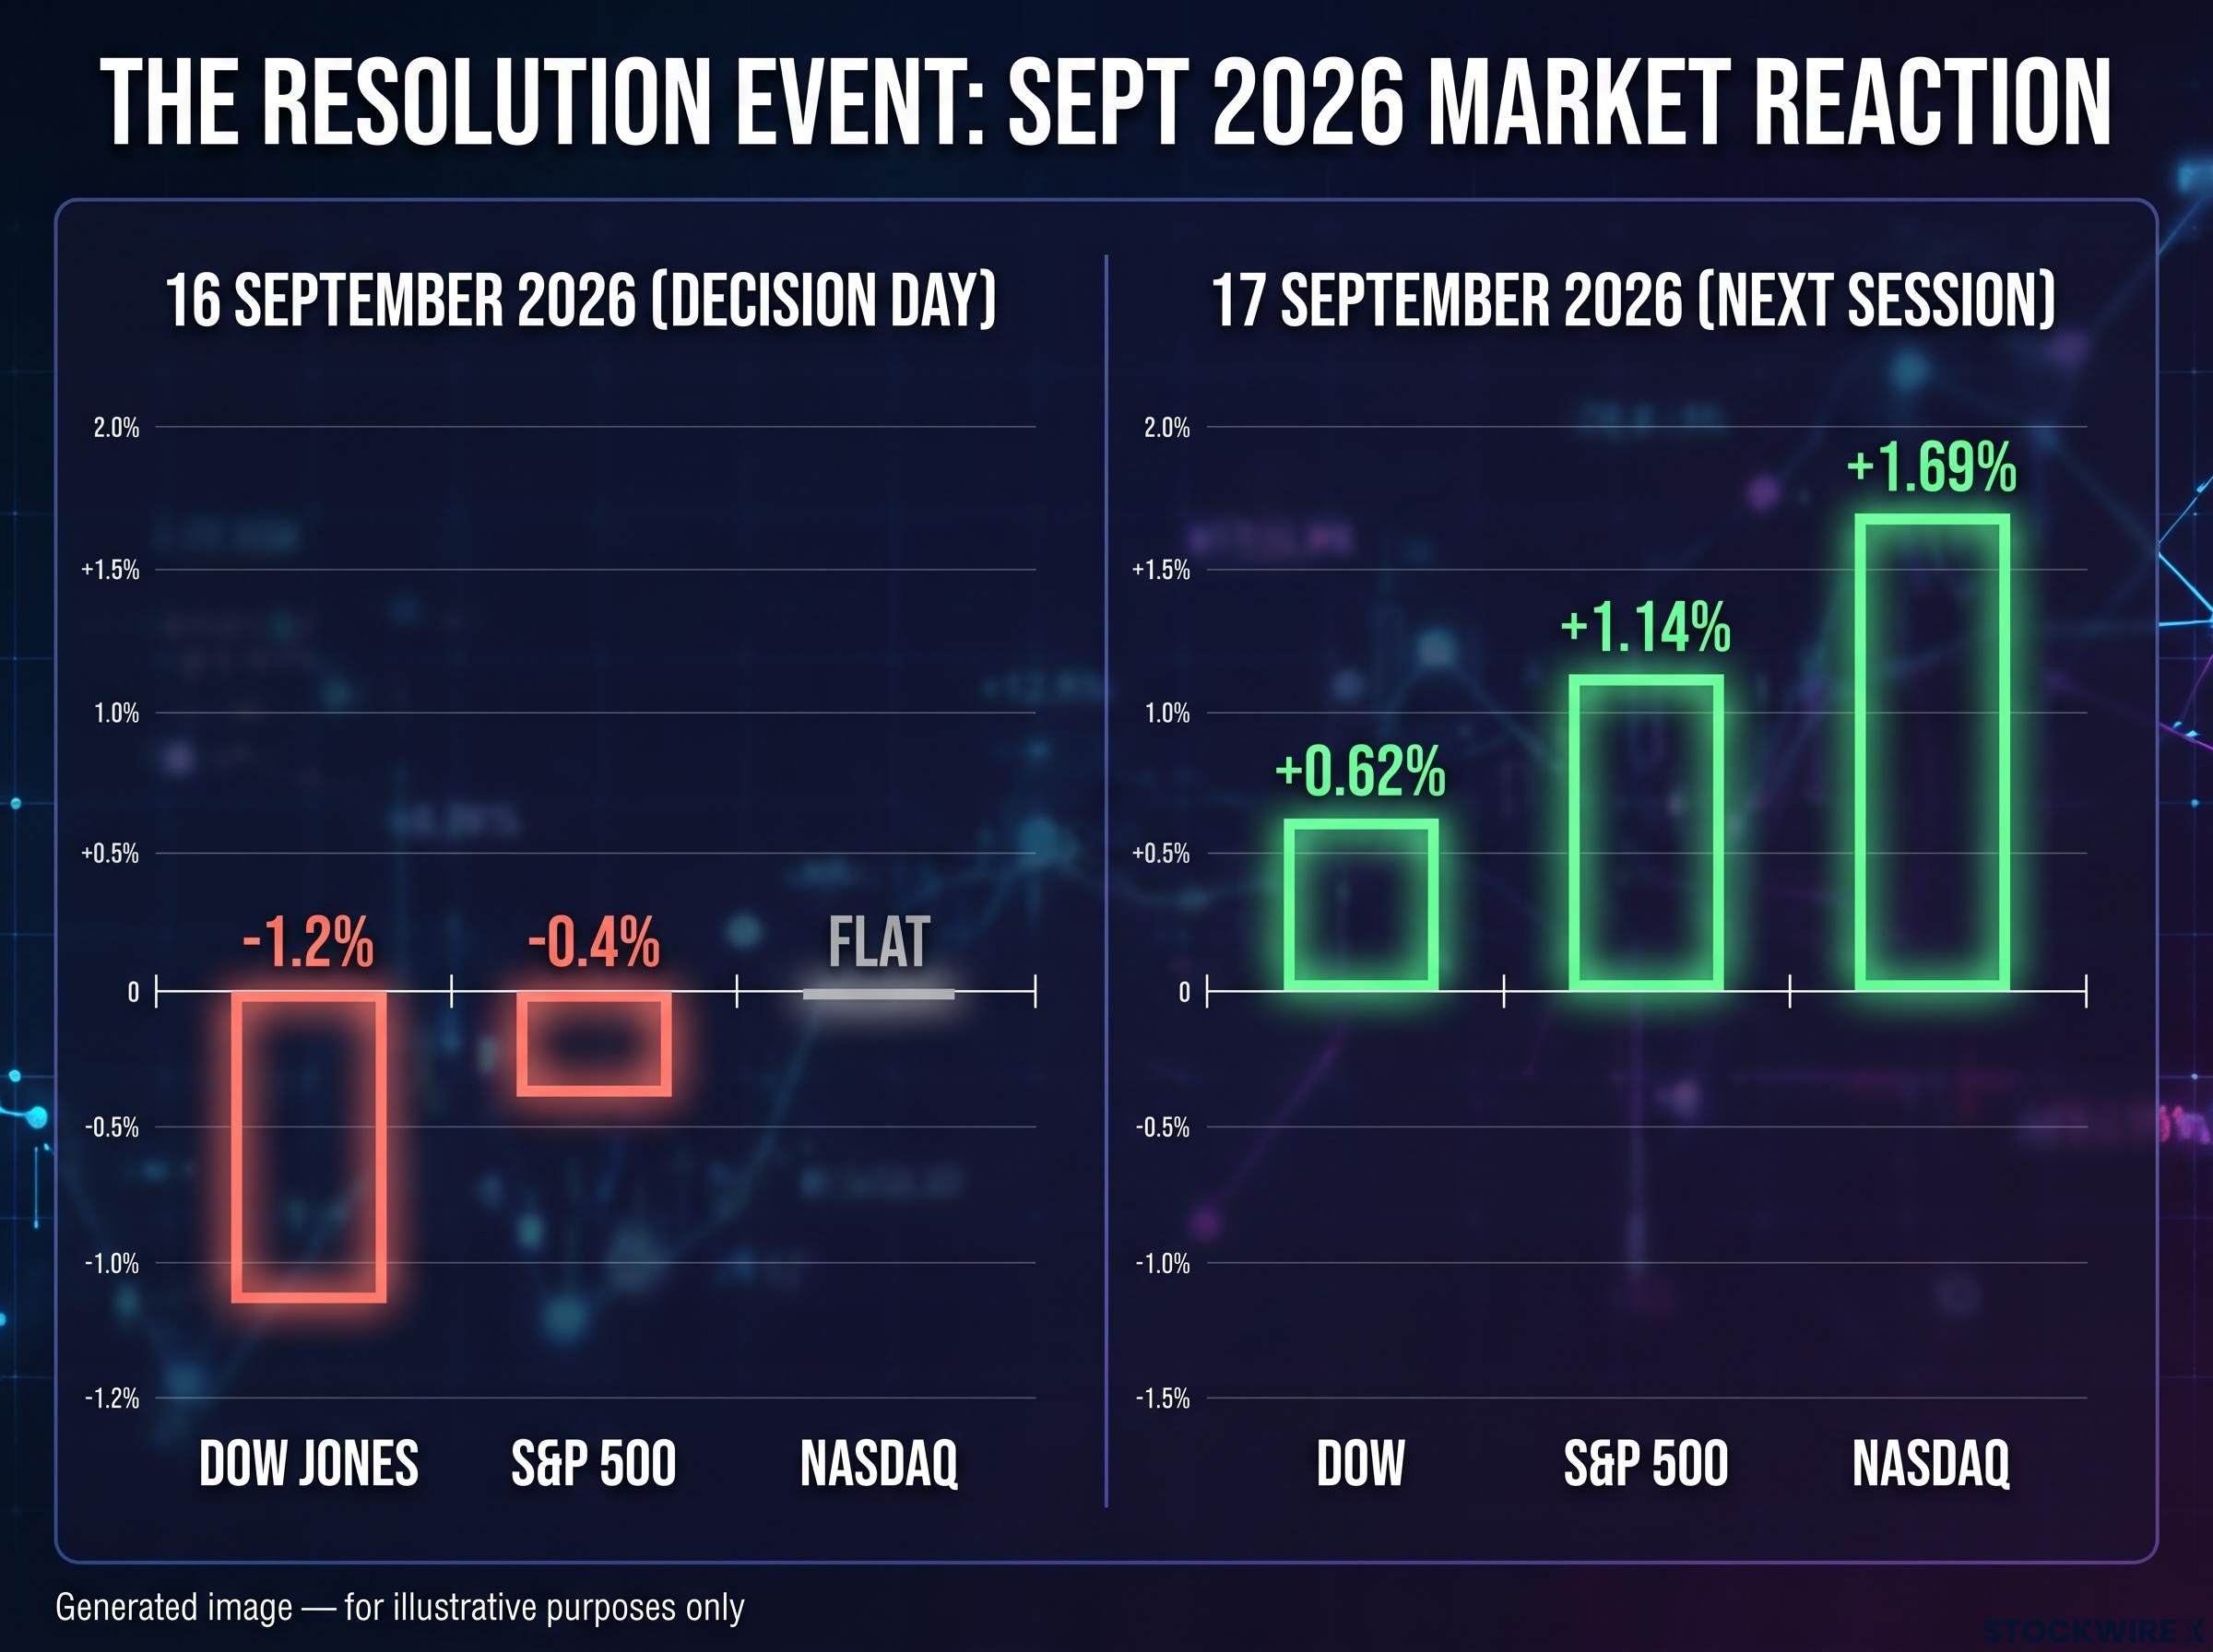
The two-day market reaction tells the story neatly. On decision day, the response was mixed, then turned negative as Chair Kevin Warsh struck a hawkish tone. The following session, sentiment flipped.
Here is how the market moved:
- 16 September 2026 (decision day): An initial pop faded during the press conference. The Dow Jones Industrial Average closed down roughly 1.2%, the S&P 500 slipped around 0.4%, and the Nasdaq finished essentially flat as Treasury yields climbed on fears of more hikes.
- 17 September 2026 (next session): A broad-based rebound took hold as oil prices eased and Treasury yields fell. The Dow rose 0.62%, the S&P 500 gained 1.14%, and the Nasdaq jumped 1.69%.
Reuters reported that easing oil prices and falling yields helped markets move beyond the Fed’s first hike in more than three years.
History supports the pattern. Analysis from the Kobeissi Letter, examining seven hiking cycles since 1988, found the S&P 500 typically falls around 4% in the weeks after a first hike, then recovers to post gains of roughly 4% over the following six months once the policy path becomes clearer.
The pace of Fed hikes matters enormously here: the mildest modern tightening cycle (1997) delivered S&P 500 gains of roughly 18% over four months, while the most aggressive (2022) produced losses of around 6%, a 24-percentage-point spread from the same directional policy move.
The read you should take is straightforward. Wall Street fears uncertainty far more than it fears higher borrowing costs.
When the Fed telegraphs a move and then delivers it, treat that as a clarifying moment, not an automatic sell signal. Knowing this framework stops you from panic-selling when tightening arrives, and helps you separate a healthy repricing of risk from a genuinely destructive monetary shock.
When big ASX news breaks, our subscribers know first
The geopolitical energy shock forcing the central bank’s hand
The relief of a resolution event is real, but it does not explain why the Fed felt compelled to tighten in the first place. That answer lies in energy prices.
Inflation has come roaring back through the fuel pump, and the driver is not overheated domestic demand. It is a supply shock rooted in conflict thousands of miles away.
The Federal Reserve’s July 2026 Monetary Policy Report attributed a 24% year-over-year surge in Personal Consumption Expenditures (PCE) energy prices to a military conflict in the Middle East. That conflict constrained shipping through the Strait of Hormuz and damaged regional energy infrastructure.
The Hormuz blockade reduced vessel throughput to roughly 5-10% of normal capacity at its peak in May 2026, driving WTI above $103 and Brent above $110 and providing the supply-side foundation for the energy CPI surge that ultimately forced the September rate decision.
This is the kind of shock domestic monetary policy struggles to fix. Raising rates cools demand at home, but it cannot reopen a chokepoint or repair a damaged refinery.
The consumer price data made the pressure impossible to ignore. According to the Bureau of Labor Statistics (BLS), released on 11 September 2026, the August energy index jumped 2.1% month-over-month and 16.3% year-over-year.
Gasoline did much of the damage, rising 3.9% on the month and accounting for more than a third of the entire monthly CPI increase. Fuel oil climbed an even steeper 10.1%.
Here is the August 2026 energy breakdown:
| Energy component | Month-over-month change | Year-over-year change |
|---|---|---|
| Overall energy index | +2.1% | +16.3% |
| Gasoline | +3.9% | – |
| Fuel oil | +10.1% | – |
| Energy commodities | – | ~+28% |
This was not a one-month blip. Research from PNC and Purdue’s Center for Commercial Agriculture shows monthly energy CPI gains peaked around 10.9% in March 2026 and stayed elevated through mid-year before August reaccelerated.
The staggering 16.3% annual jump tells you something important about the current inflation picture. This is a supply-side story, not a demand-side one.
That means you have to watch global geopolitics as closely as you watch the Fed. Energy prices have become a leading indicator for whether the central bank will be forced to keep policy restrictive longer than markets currently expect.
Mapping the institutional divide over future equity valuations
If energy is the central variable, the obvious question is where it leaves your portfolio. Wall Street’s biggest institutions do not agree, and that disagreement is worth understanding before you position for what comes next.
The debate splits cleanly into two camps.
The case for a prolonged valuation squeeze
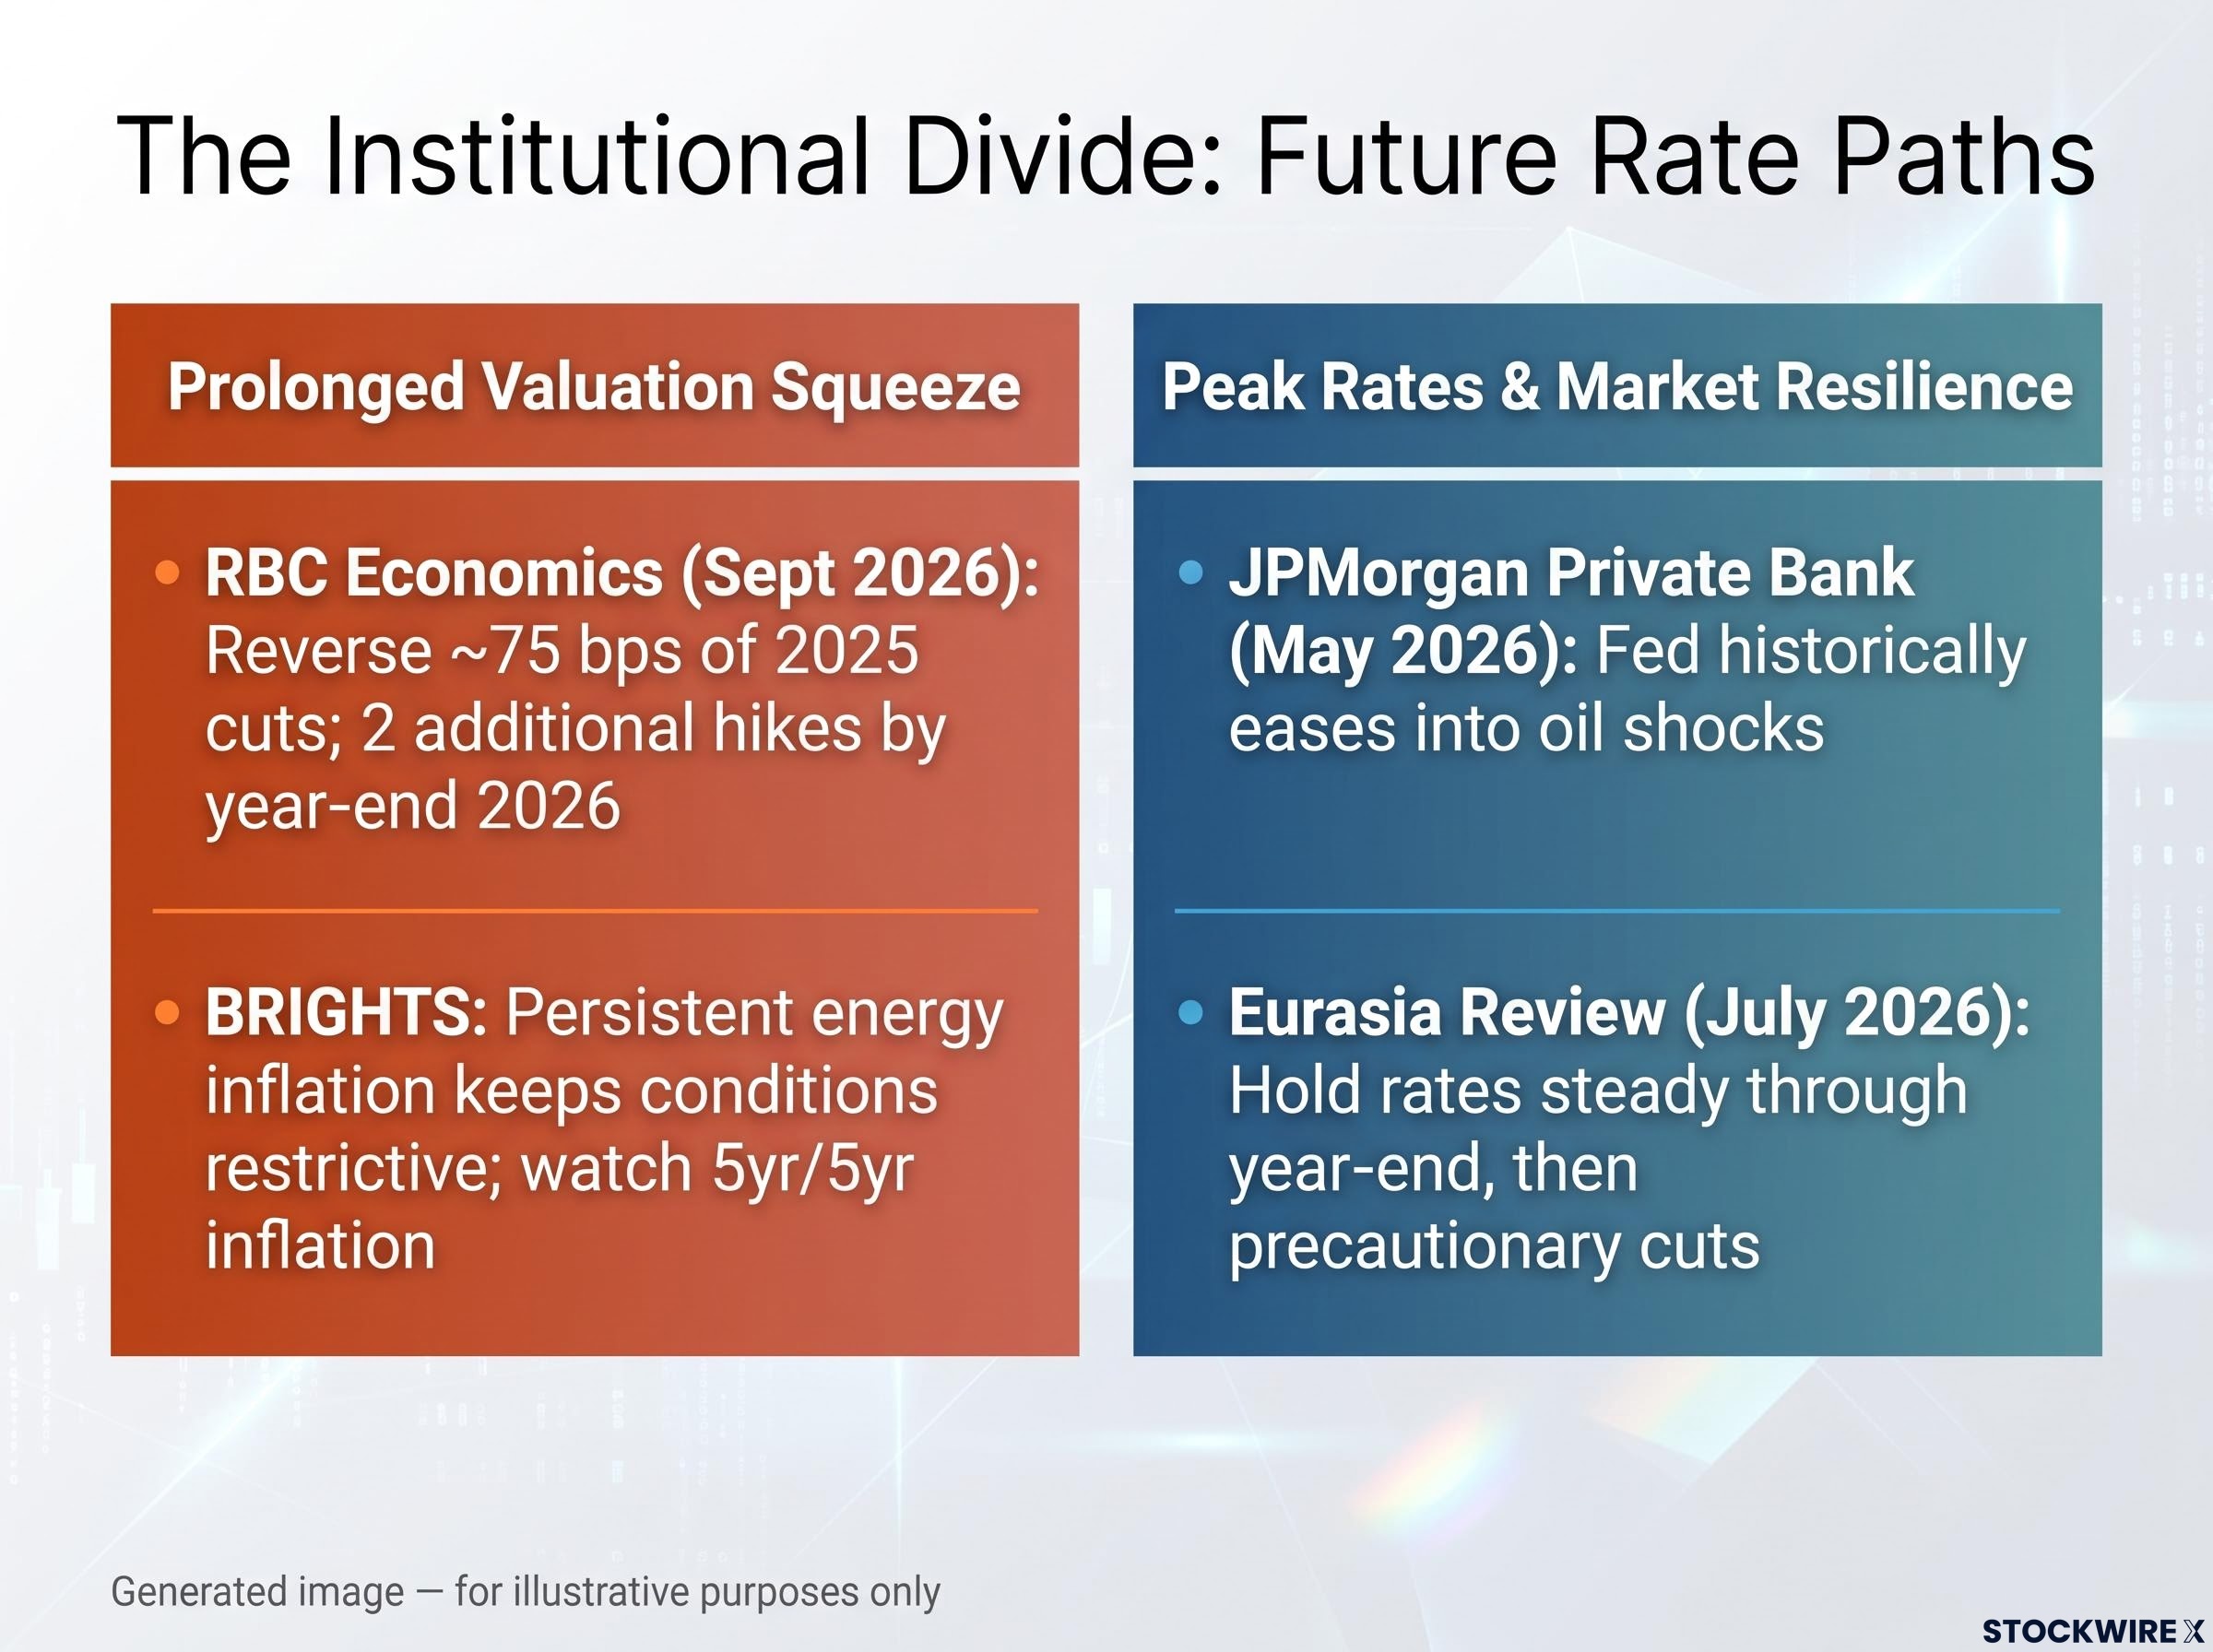
The cautious camp argues that resurgent oil prices will force the Fed to keep rates higher for longer, squeezing equity valuations along the way.
The core arguments here:
- RBC Economics wrote on 17 September 2026 that resurging oil prices were adding to inflation worries and expects the Fed to reverse roughly 75 basis points of earlier “insurance” cuts made in 2025. RBC forecasts two additional hikes by year-end 2026.
- BRIGHTS macro strategists warn that Fed hike risk is becoming more real, and that persistent energy inflation could keep global monetary conditions restrictive. They urge investors to watch 5-year/5-year inflation expectations, oil prices, and money growth for signs the tightening cycle needs to extend.
The worry is that energy inflation feeds into long-term expectations, which would complicate the Fed’s path and pressure rate-sensitive sectors most.
The argument for peak rates and market resilience
The constructive camp sees a plateau rather than an extended climb.
Their reasoning:
- JPMorgan Private Bank, in a May 2026 note, argued that market inflation fears were running ahead of reality. Outside rare periods like the 1970s or 2022, the Fed has historically eased into oil shocks rather than launching aggressive new hiking campaigns, for fear of crushing demand.
- Eurasia Review, writing in July 2026, suggested the most probable outcome is holding rates steady through year-end, then moving toward precautionary cuts if energy shocks ease and the labour market weakens.
In this view, the cycle plateaus, avoids an extended squeeze, and remains compatible with continued equity gains.
Barclays bridges both positions. It views the September hike itself as a constructive resolution event while warning that the broader tightening cycle creates headwinds for valuations until energy inflation shows signs of easing.
The gap between RBC forecasting two more hikes and JPMorgan expecting a plateau tells you the smart money is genuinely split. That argues for hedging against both scenarios rather than betting heavily on one. Use both camps to stress-test your holdings against the specific risks each has flagged.
For readers wanting to understand how fractured the policy consensus became before September, our full explainer on the Fed’s internal rate debate covers the 9-9 committee split, the outsized role of CPI prints in resolving it, and why Chair Kevin Warsh’s interpretive tone has become more market-moving than the data itself.
What past tightening cycles tell you about the next 12 months
Conflicting forecasts can feel paralysing, so it helps to zoom out. History offers a realistic timeline for how equities behave once tightening runs its course.
Two past cycles bracket the range of outcomes. One is the benchmark for success; the other is a warning about risks that surface long after the final hike.
The historical relationship between rate hikes and stock returns is more nuanced than the conventional sell signal suggests: RBC Capital Markets data shows the S&P 500 averaged approximately 13.7% during 12-month windows with modest hikes of 1% or less, a result that sits well above the doomsday scenarios that tend to dominate financial media.
The 1994-95 cycle is the gold standard for a soft landing. The Fed raised the funds rate by 300 basis points in roughly a year, from 3.0% to 6.0%, and the economy kept expanding without tipping into recession. Equities thrived.
The 2004-06 cycle is the cautionary tale. Rates climbed from 1% to 5.25% while GDP growth held strong, yet the extended tightening ultimately preceded the 2007-2009 downturn. Strong initial results masked lagged risks that only emerged years later.
Here is how the cycles compare:
| Cycle | Start date | Total rate move | Initial outcome |
|---|---|---|---|
| 1994-95 | February 1994 | +300 bps (3.0% to 6.0%) | Soft landing, no recession |
| 2004-06 | June 2004 | +425 bps (1.0% to 5.25%) | Strong GDP, later downturn |
| 2022-present | March 2022 | Unusually rapid and sizable | Ongoing |
The broader statistics set expectations. A 2026 review by PaperTradingJournal of 14 past final hikes found the S&P 500 returned an average of -0.4% over the first six months, then +1.8% over the following 12 months.
That pattern tells you patience is mandatory right now. Expect a stretch of choppy consolidation before any clear new trend emerges, and do not read early flatness as failure.
History gives you a realistic timeline and the confidence to avoid abandoning your strategy during the inevitable bouts of volatility.
Navigating your portfolio through a higher-for-longer environment
The September hike delivered genuine relief. As Barclays framed it, a telegraphed move removed a long-standing overhang and let markets reprice with clearer information.
The catch is that the energy inflation forcing the Fed’s hand has not gone away. The two additional hikes projected by RBC and flagged by Barclays for late 2026 remain the primary risk to the post-decision rebound.
That leaves you with a clear focus. Watch the monthly energy CPI prints and geopolitical supply developments closely, because those figures will ultimately decide whether the Fed tightens again or plateaus.
The immediate shock has passed, but vigilance is the right posture from here. Let the data, not the headlines, dictate your next move.
This article is for informational purposes only and should not be considered financial advice. Investors should conduct their own research and consult with financial professionals before making investment decisions.
Past performance does not guarantee future results. Financial projections are subject to market conditions and various risk factors, and forward-looking statements from the institutions cited are speculative and subject to change based on market developments.