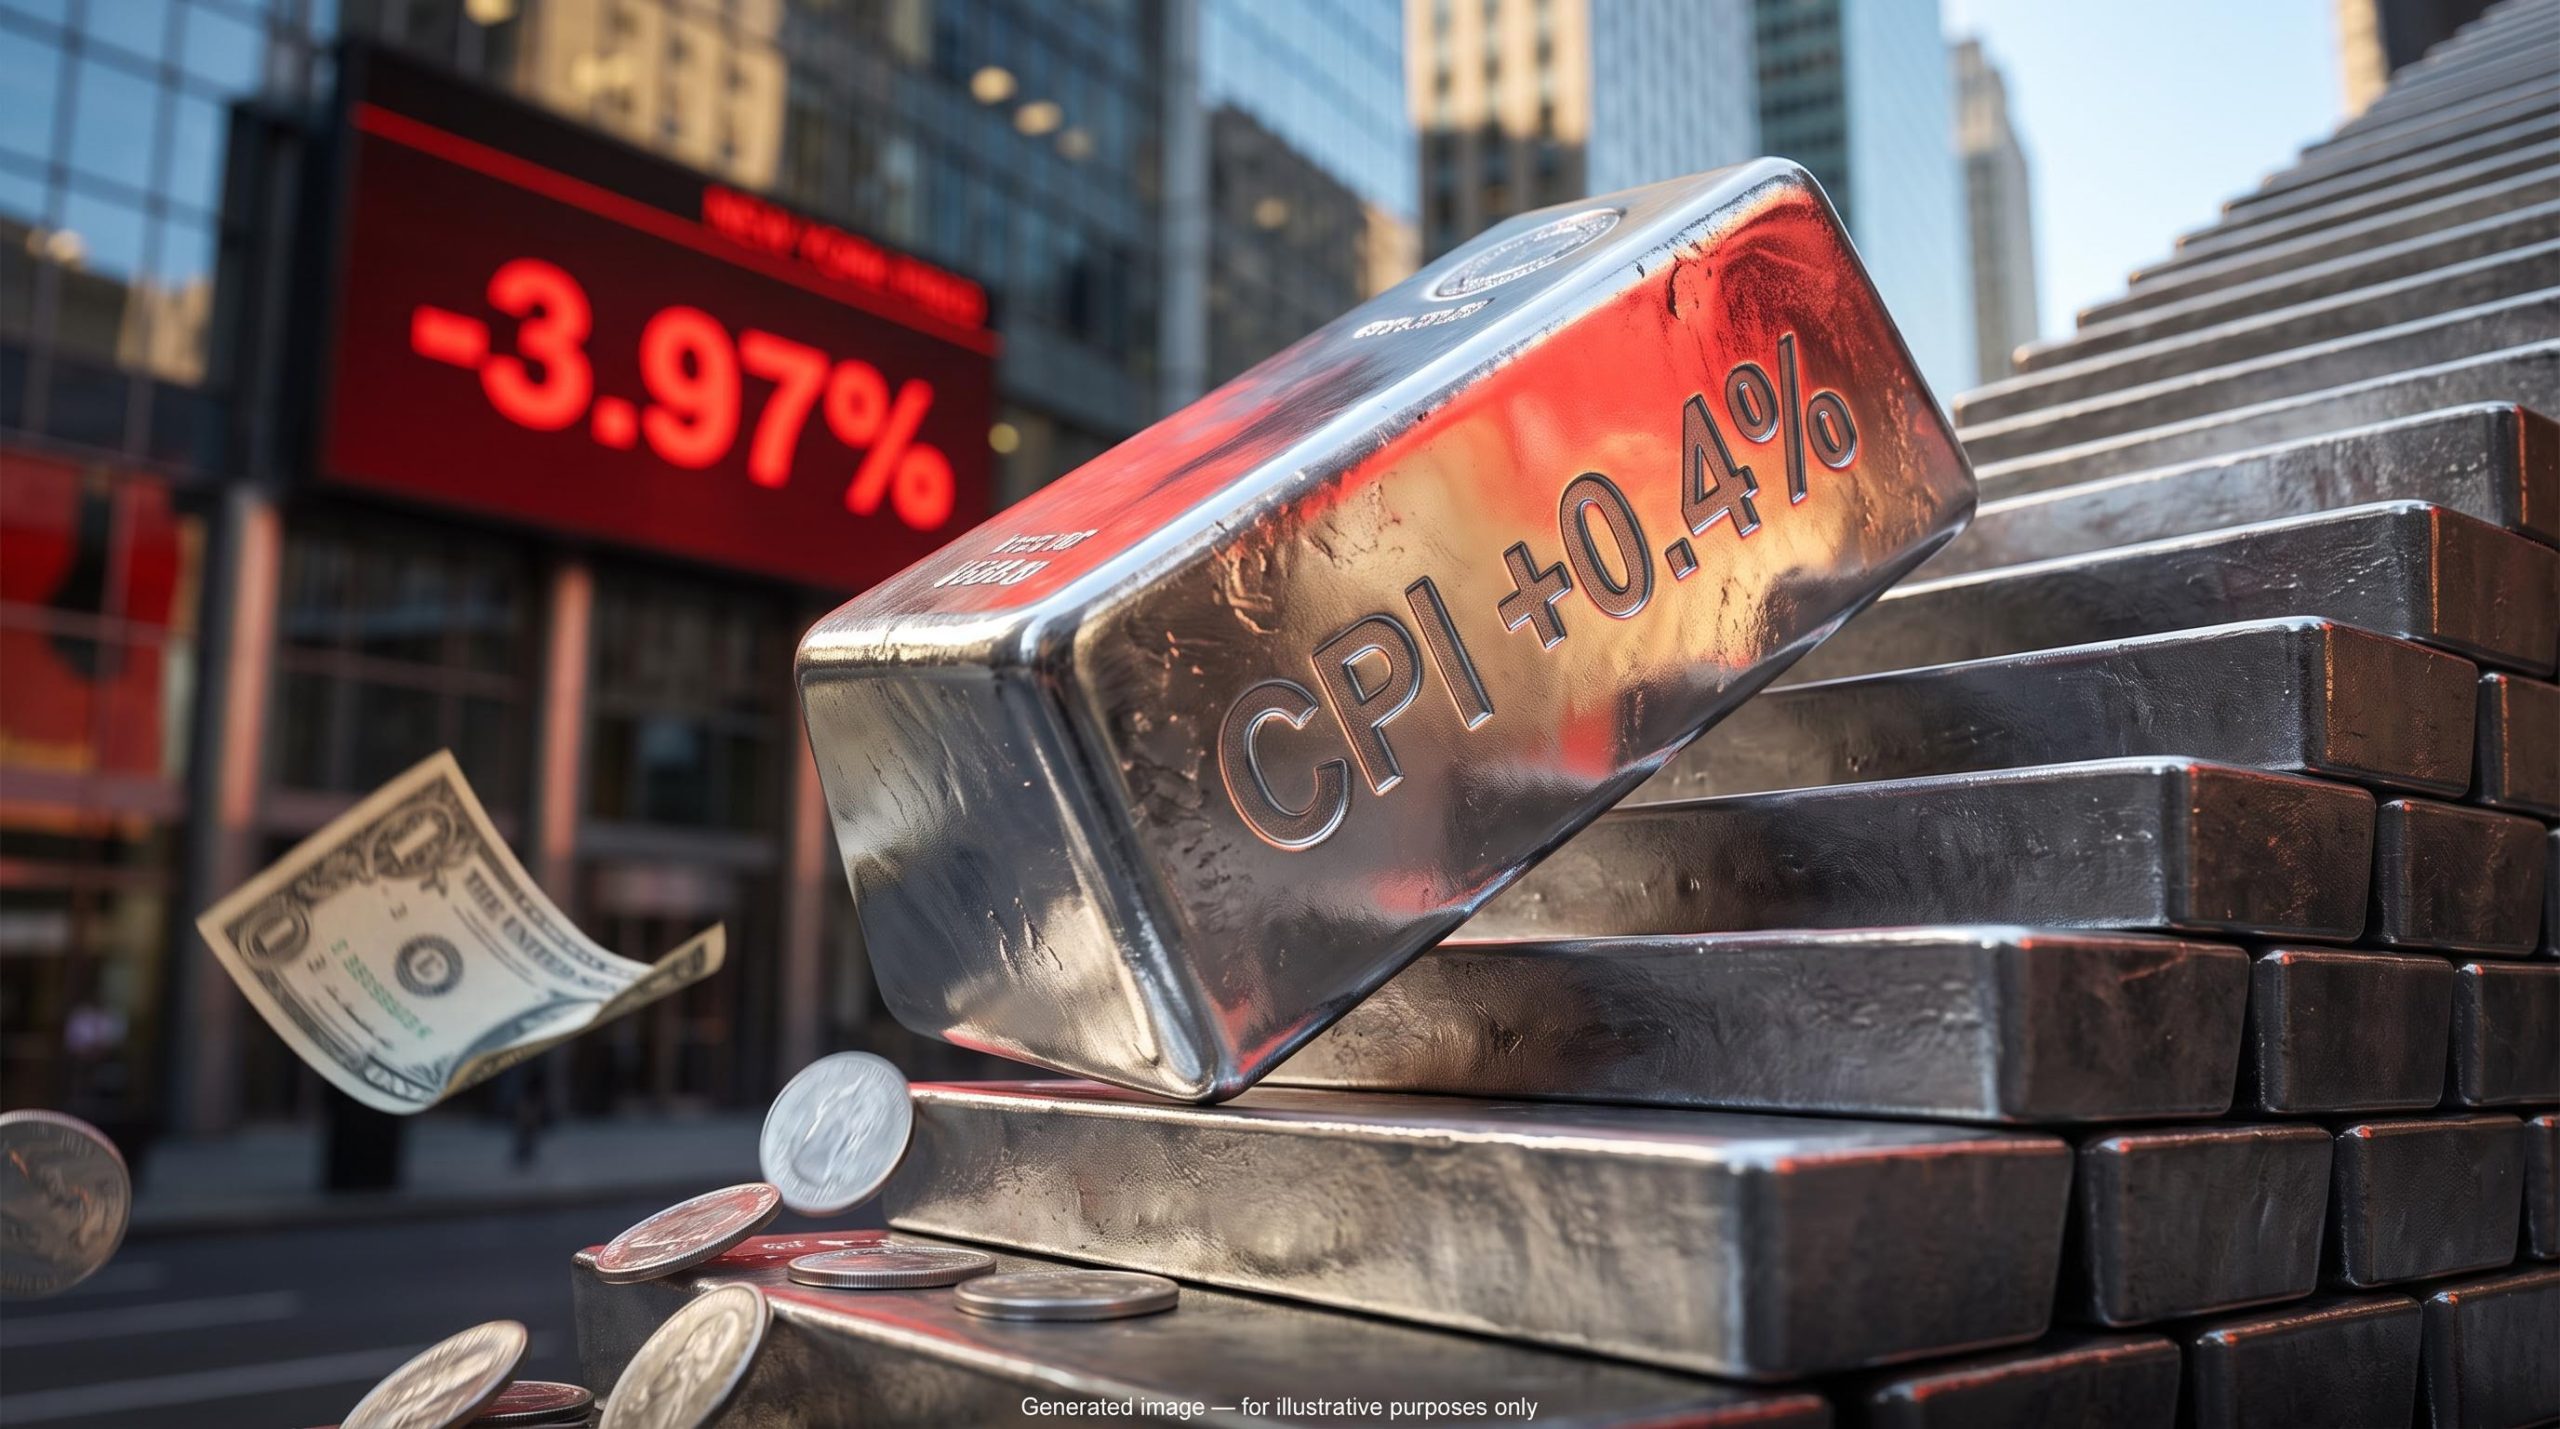
A US inflation report came in just one-tenth of a percentage point above forecast, and silver fell nearly 4% in a single session. Headline consumer prices rose 0.4% in October against an expected 0.3%, and that small miss was enough to send the silver price lower. If you assumed silver mainly trades on mine supply and factory demand, the CPI reaction tells a different story.
On 10 November 2026, the October Consumer Price Index (CPI) report changed what markets expect from the US Federal Reserve. It also moved the US dollar and Treasury yields, and silver was caught in all three shifts at once.
This is educational analysis anchored to that session, not a live market report. Prices moved quickly throughout the day, and the figures here reflect what was reported at the time.
Once you can trace the chain from an inflation release to a metals move, you can apply it to every CPI day that follows. You will also know which XAG/USD price levels traders are watching and how to read them without mistaking them for forecasts.
Why did a 0.1-point inflation surprise matter so much?
Start with the numbers. Headline CPI measures the change in prices across a broad basket of consumer goods and services. Core CPI removes food and energy, which tend to swing sharply, so it gives you a steadier read on underlying inflation.
| Measure | October 2026 actual | Consensus | September 2026 |
|---|---|---|---|
| Headline CPI, month on month | +0.4% | +0.3% | +0.6% |
| Core CPI, month on month | +0.3% | +0.2% | +0.3% |
Both readings beat expectations. According to Axios, recreation, medical care, auto insurance and airline fares contributed to the increase.
Your picture of silver improves once you see that mine supply and factory demand are only two of five forces, alongside the US dollar, real interest rates and the gold correlation, all of which can dominate on any given day.
One complication: the Bureau of Labor Statistics did not publish October year-on-year rates, because the 2025 government shutdown prevented collection of the October 2025 comparison data. The figures of roughly 3.9% headline and 2.7% core that you may see quoted are economist estimates, not official numbers.
The inflation level was not what moved markets. What moved them was the shift in expected Fed policy.
After the release, the CME FedWatch Tool showed an 89.2% probability of a 25 basis point rate hike in December and a 10.8% chance of a 50 basis point move. A basis point is one-hundredth of a percentage point, so 25 basis points equals 0.25%. FedWatch converts interest rate futures prices into the probabilities markets assign to each possible Fed decision.
What the Fed speakers signalled
Two Fed officials had already shaped how the print would be read. Lorie Logan, President of the Dallas Fed, said the policy rate sat at least 50 basis points below a modestly restrictive level.
Lorie Logan, Dallas Fed President The Fed needs “at least two more 25-basis-point rate increases,” and it “may be possible to move more rapidly this winter.”
Fed Governor Christopher Waller said before the release that a half-point December hike may be warranted if core CPI came in “around 0.3% or higher.” Core landed at exactly 0.3%.
That is why a tenth of a point mattered. Markets trade the change in expected policy, so when you read a CPI release, compare it to consensus first, then check what it does to rate expectations.
When big ASX news breaks, our subscribers know first
How does a hot CPI print travel from the Fed to the silver price?
Once rate expectations shift, the effect moves through a sequence. Each step follows from the one before it:
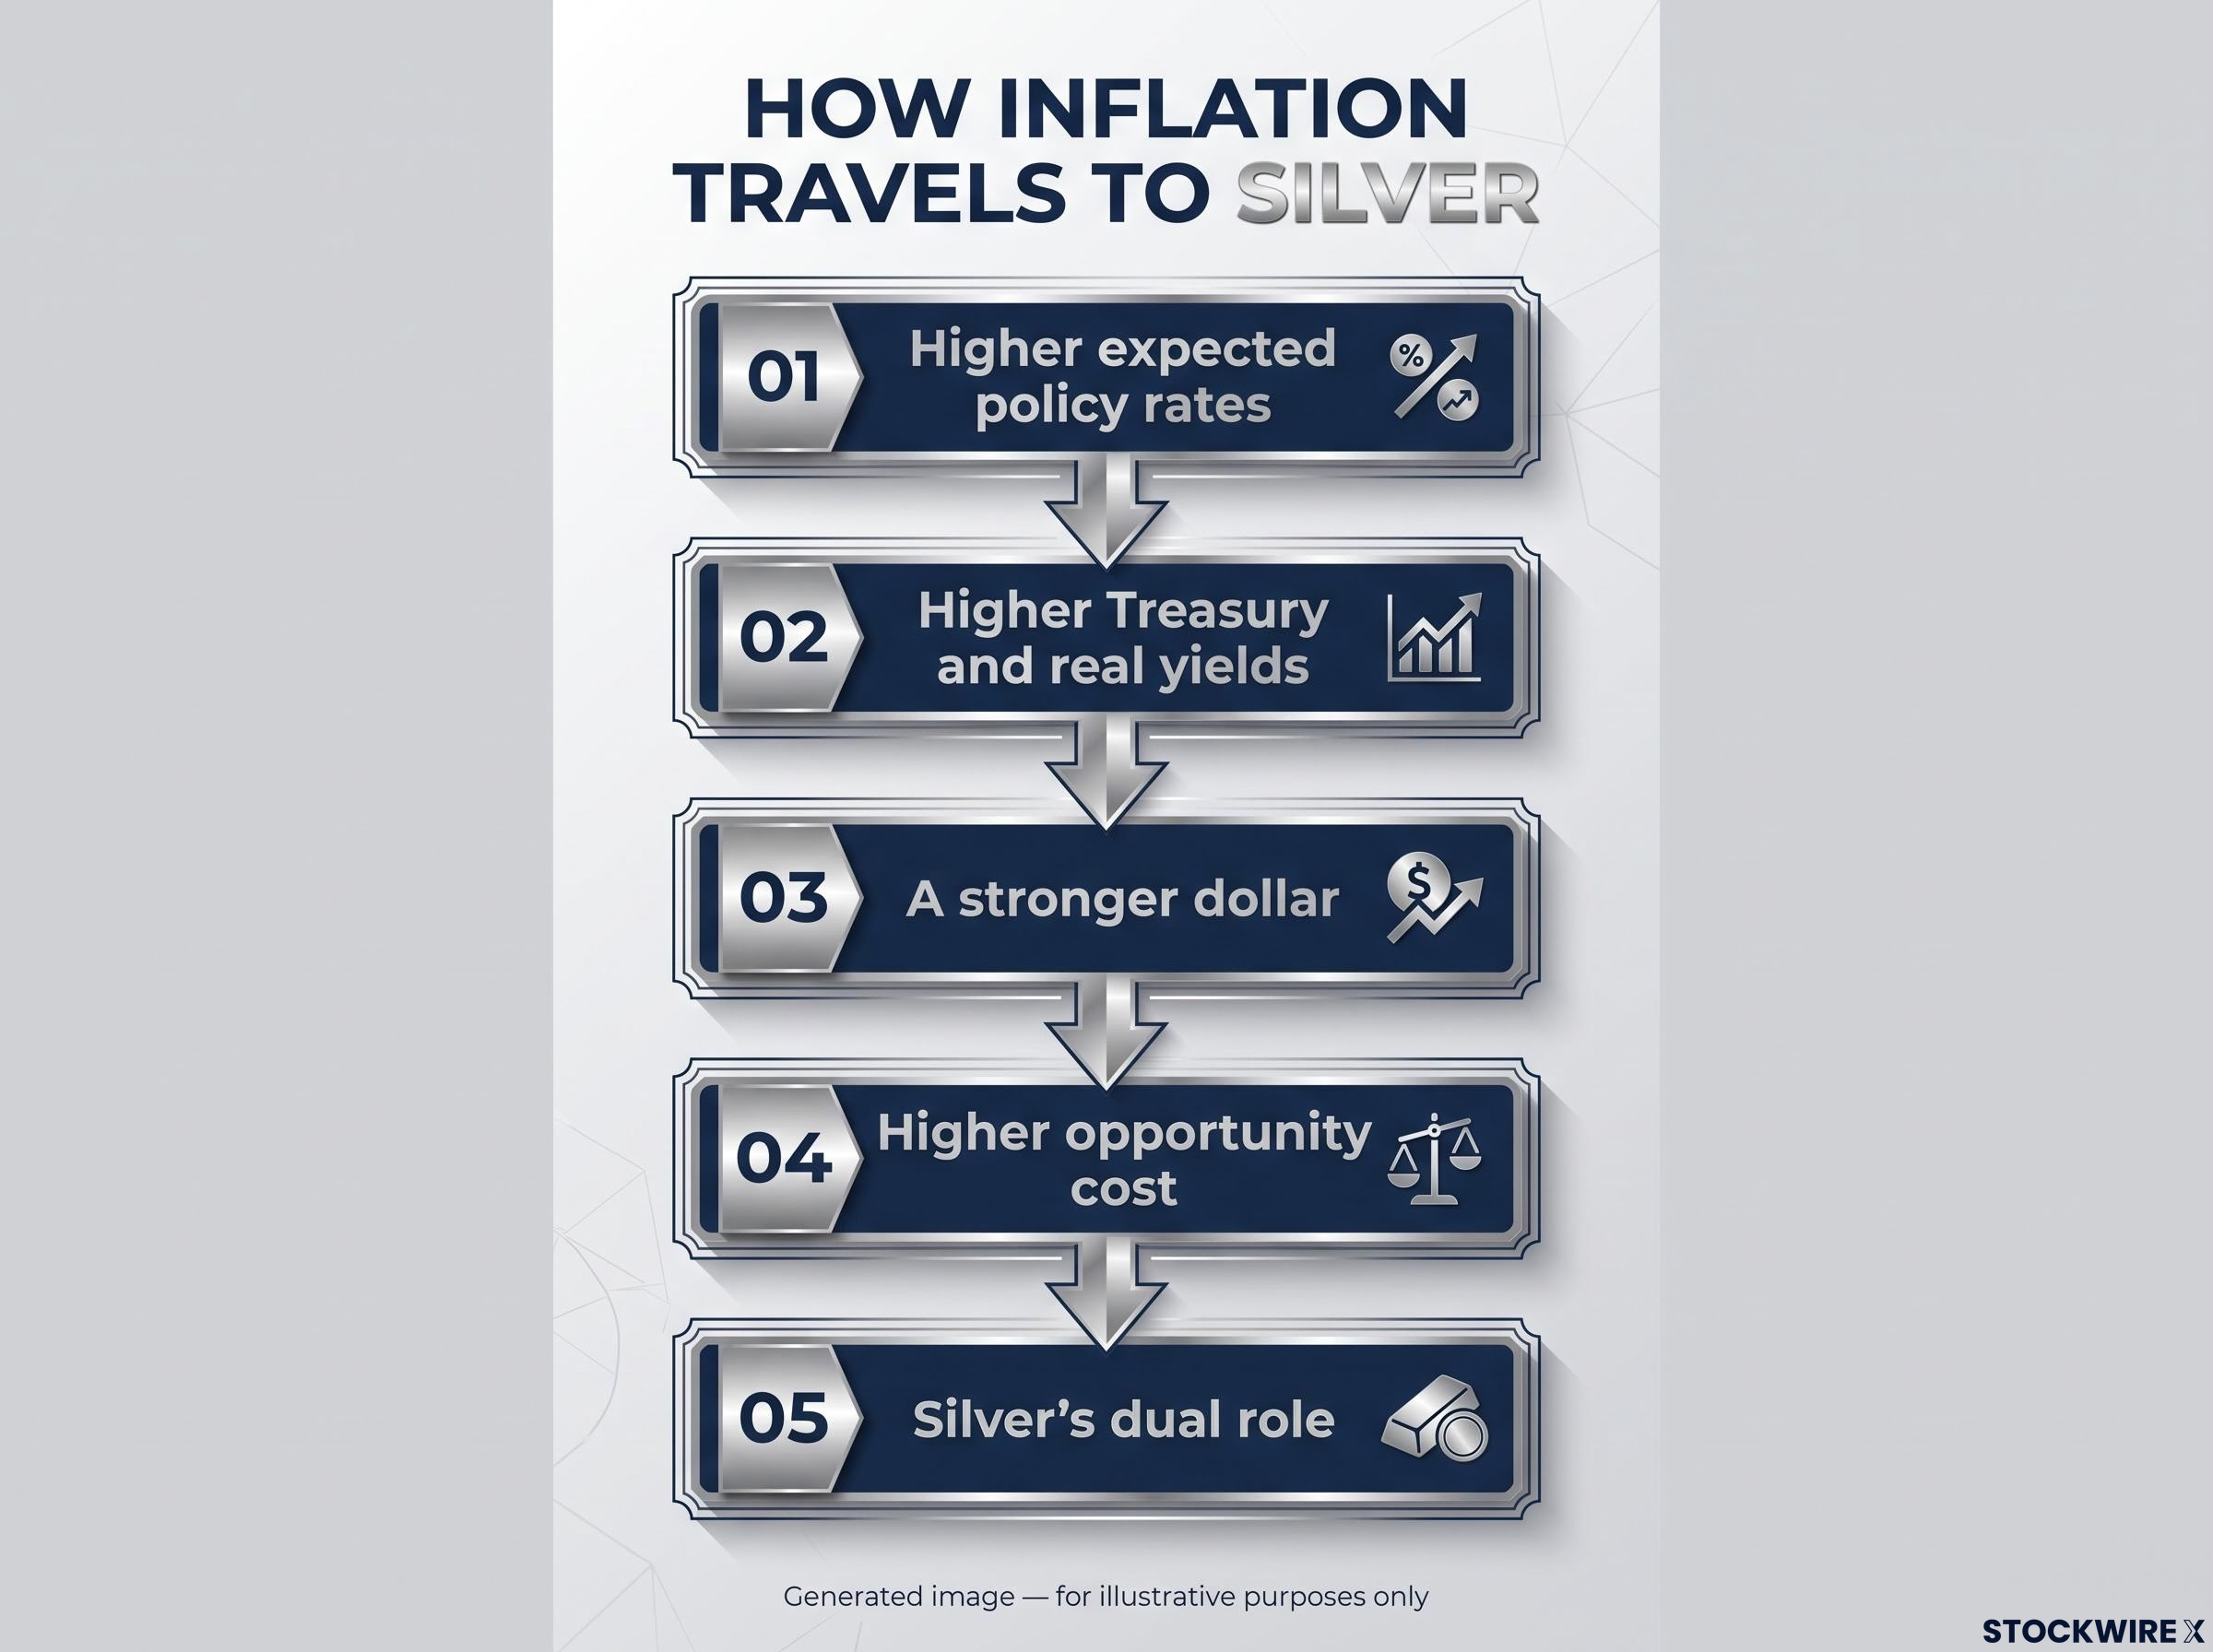
The transmission chain involves 5 steps, beginning with 1 higher expected policy rates and ending with 5 silver’s dual role.
- Higher expected policy rates. The hotter prints raised confidence in a December hike, and Waller’s comments lifted the odds of a larger move.
- Higher Treasury and real yields. Real yields are bond returns after subtracting inflation, and rising real yields make bonds more attractive next to metals.
- A stronger dollar. Silver is priced in US dollars, so a stronger dollar makes it more expensive for buyers using other currencies.
- Higher opportunity cost. Opportunity cost is the return you give up by choosing one asset over another, and it rises for silver when bond yields climb.
- Silver’s dual role. Silver is both a monetary metal and an industrial input, so a hot print can hurt it through more than one channel.
The opportunity cost step is easiest to see with a simple comparison. A Treasury bond pays you a regular coupon, while an ounce of silver pays nothing while you hold it. When that coupon rises, holding the metal costs you more in forgone income. TMGM described higher Fed rates as unfavourable for non-yielding assets for this reason.
On the day, the 10-year Treasury yield sat around 4.94%-4.95%. CNBC reported it briefly moved above 5.00%, a rise of more than 14 basis points. StoneX put the US Dollar Index near 102.3.
| Currency | USD gain against it |
|---|---|
| Australian dollar (AUD) | +1.16% |
| British pound (GBP) | +0.87% |
| Swiss franc (CHF) | +0.86% |
| New Zealand dollar (NZD) | +0.79% |
| Euro (EUR) | +0.64% |
| Japanese yen (JPY) | +0.57% |
| Canadian dollar (CAD) | +0.54% |
Source: FXStreet heat map, 10 November 2026.
FXStreet reported silver near $51.23, down 3.97%. Kitco showed about $51.70 (down roughly 3.0%) in early US trading, and other coverage showed about $52.20. The gap reflects when each price was captured in a volatile session.
The key point is that nothing changed in the physical silver market that day. This was a rates-and-dollar reaction. When yields and the dollar rise together, check those two gauges before you read a metals move as a supply story.
Why silver reacts differently from gold
Silver’s monetary side responds to real yields, the dollar and safe-haven flows, much like gold. Its industrial side responds to expectations for economic growth.
Analysts increasingly frame silver by asking which industrial or monetary pricing identity is dominant at a given moment, and what evidence would signal a shift between the two.
That gives a hot print two ways to hurt. Tighter policy raises the cost of holding the metal, and it also raises fears that restrictive rates will slow the industrial demand silver relies on.
Where are the XAG/USD levels that traders are watching?
With the cause of the fall established, the next question is where the move could stall or extend. FXStreet’s technical analysis, written with an AI tool, reads the daily chart as bearish with only tentative signs of stabilisation. Three indicators shape that view:
- Simple moving averages (SMA): An SMA is the average closing price over a set number of days. Silver trades below its 21-, 100- and 200-day SMAs, which points to a downtrend across short, medium and long timeframes.
- Relative Strength Index (RSI): RSI measures the speed of recent price changes on a scale of 0 to 100. A reading near 38 signals weak momentum.
- MACD: The Moving Average Convergence Divergence indicator compares two moving averages to track shifts in momentum. Its reading has edged above zero, a sign that sellers may be easing off a little, though it falls short of a confirmed turnaround.
Support and resistance are price zones where buying or selling has tended to cluster. Here is the ladder from nearest to furthest.
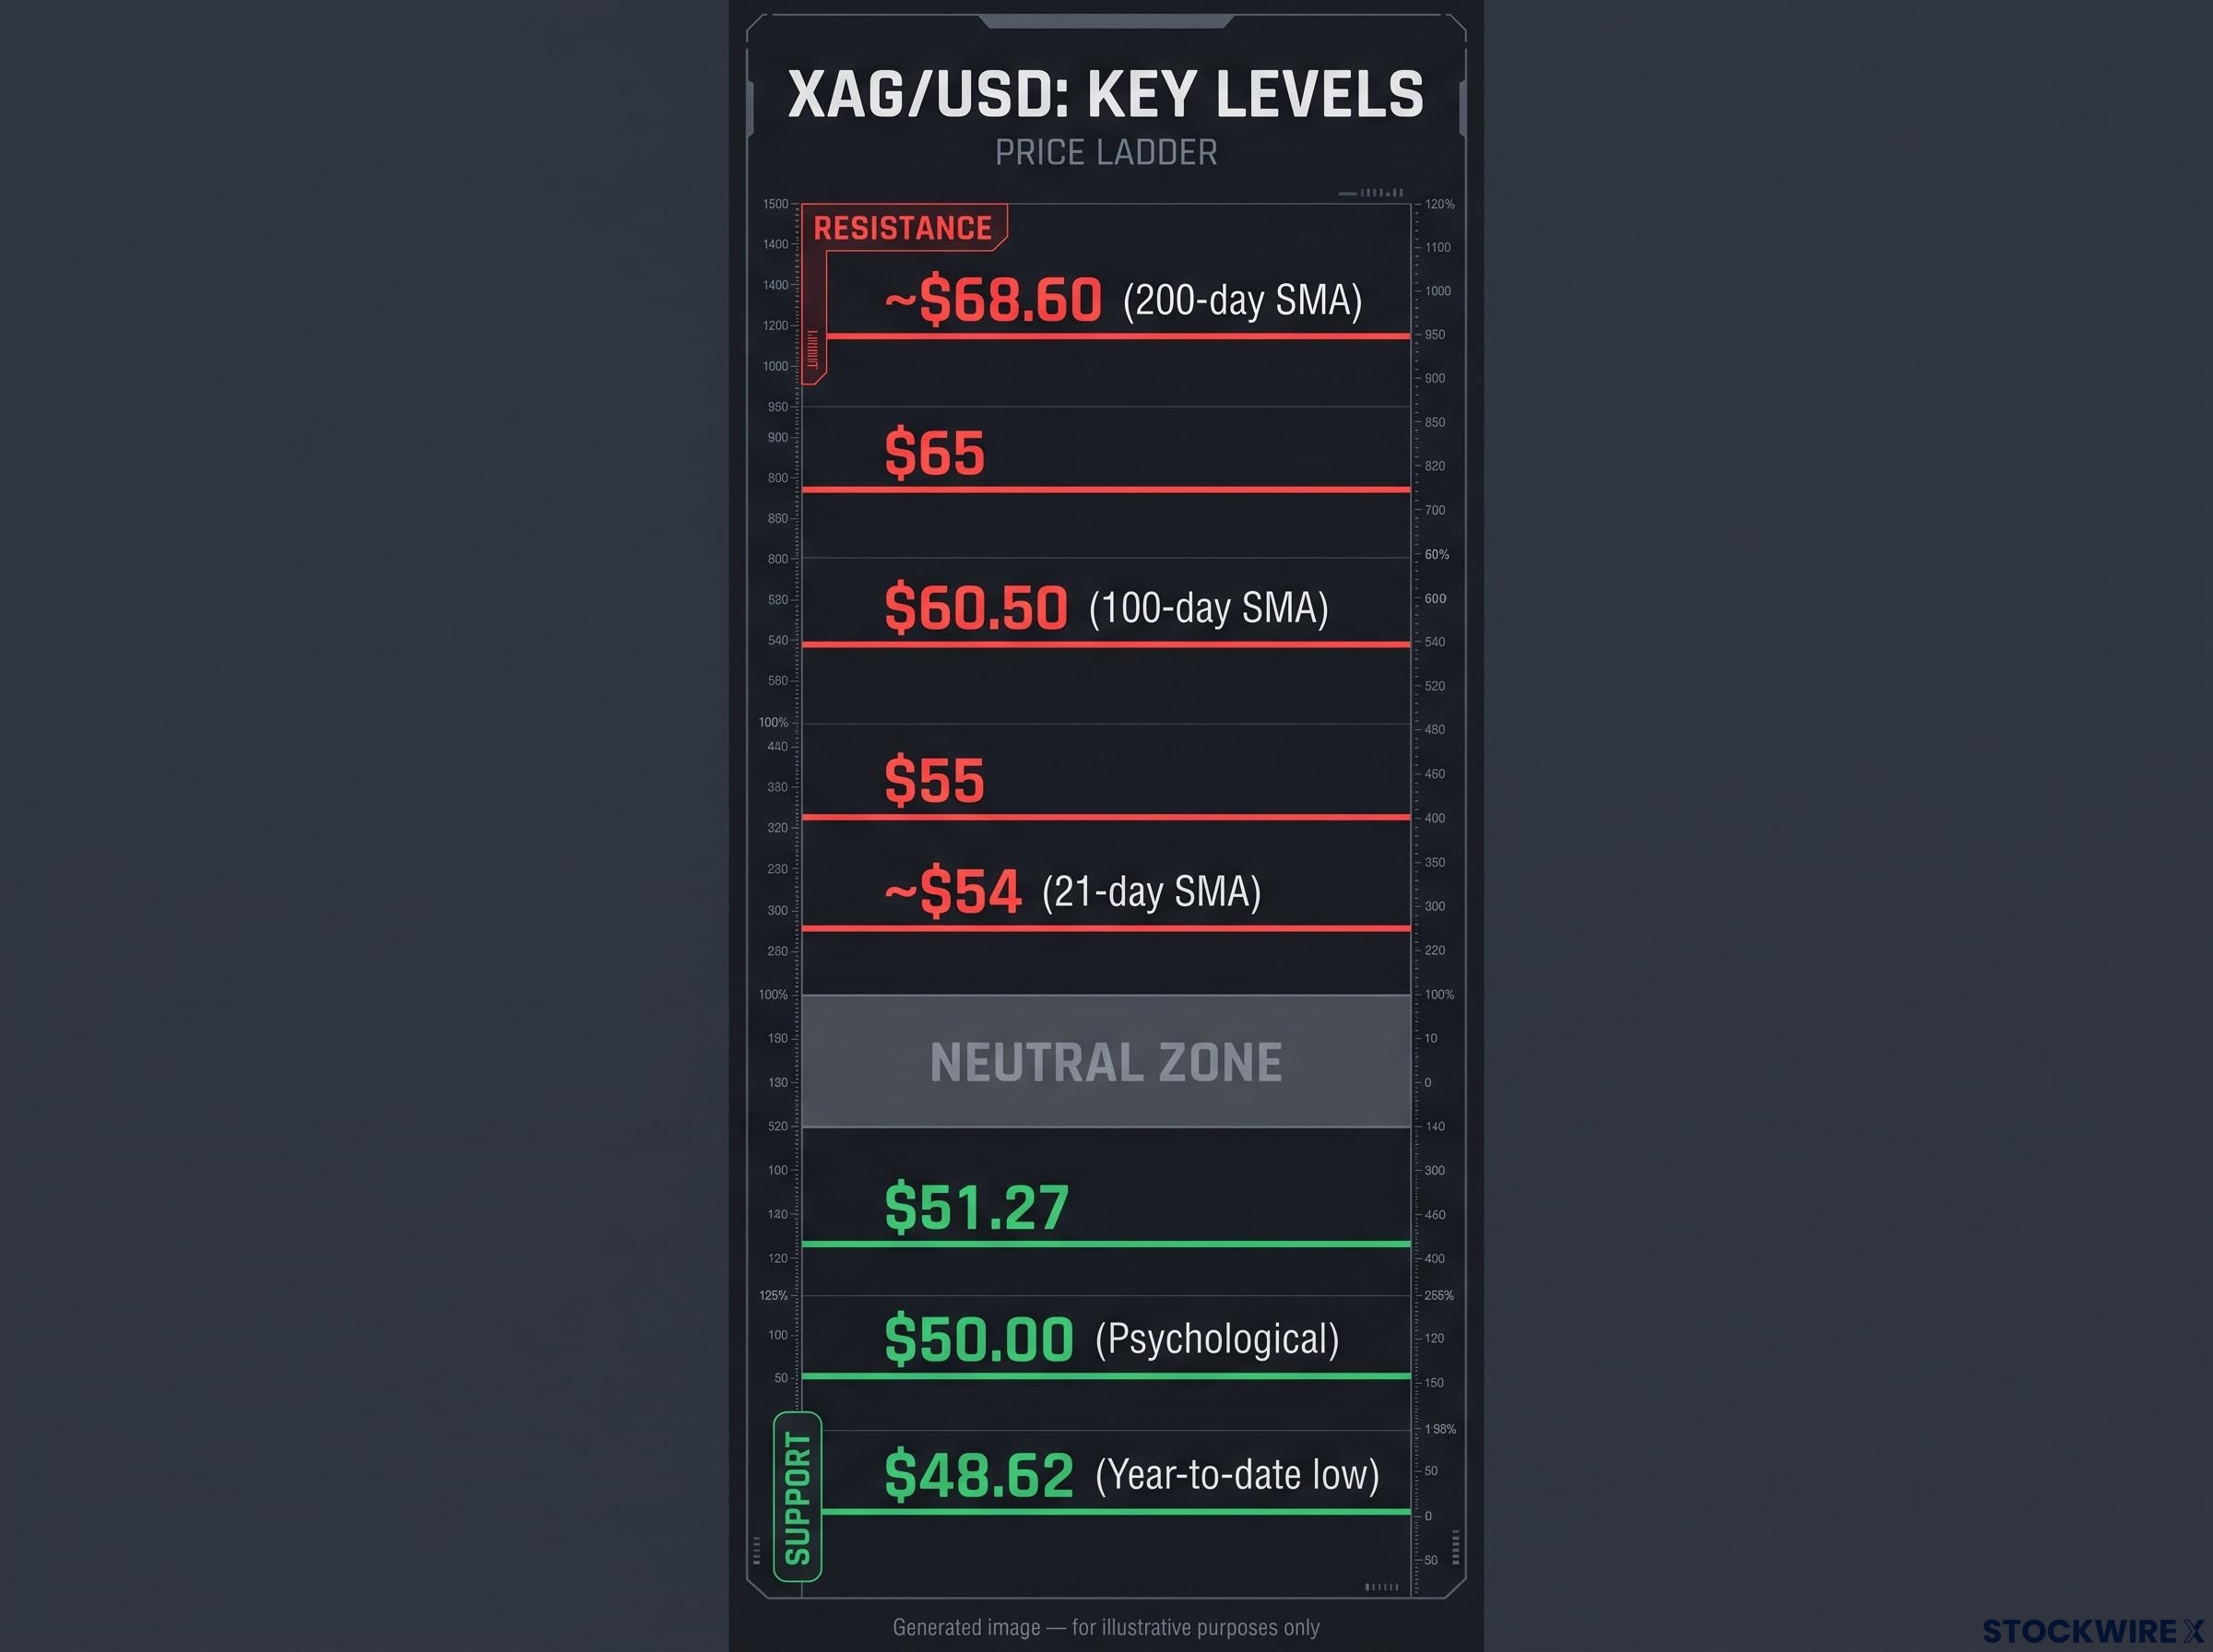
Key XAG/USD resistance levels stretch up to ~$68.60, while downside support zones include $51.27, $50.00, and $48.62.
| Level type | Price | Reference | Source |
|---|---|---|---|
| Support | $51.27 | Immediate area | Kitco |
| Support | $50.00-$50.01 | Psychological level | FXStreet, Kitco |
| Support | $48.62 | Year-to-date low | FXStreet |
| Resistance | ~$54 | 21-day SMA (Kitco zone $53.42-$54.64) | FXStreet, Kitco |
| Resistance | $55 | Horizontal level | FXStreet |
| Resistance | $60.50 | 100-day SMA | FXStreet |
| Resistance | $65 | Horizontal level | FXStreet |
| Resistance | ~$68.60 | 200-day SMA | FXStreet |
Silver remains well below its 2026 peak, and the overhead resistance stretches across many dollars. Any recovery has several hurdles to clear before bearish pressure eases.
Treat these as reference points for risk, not predictions. Levels shape trader behaviour but do not cause price moves, and they guarantee nothing. A decisive break can trigger stop-loss selling, while a rebound can happen without any improvement in fundamentals.
Is this a short-term repricing or a structural shift for silver?
The physical story did not change overnight. Kitco attributed the decline to stronger CPI, renewed hike expectations, higher yields and a firmer dollar, not to supply shifts.
The long-term picture is less tidy than a shortage headline suggests, though.
| View | Source | Evidence |
|---|---|---|
| Short-term macro repricing | Kitco | Fall tied to CPI, hike odds, yields and the dollar |
| Structural deficit | Silver Institute, Metals Focus | Sixth consecutive annual deficit of 67 million oz projected for 2026 |
| Softer industrial demand | Silver Institute, Metals Focus | Fabrication forecast down about 2% to roughly 650 million oz |
| Investor flows decisive | Kitco, 5 November 2026 | Separate estimate of a 46.3 million oz deficit |
The two deficit figures likely reflect different publication dates or estimate vintages rather than a contradiction. Both point to a market in shortfall, though of different sizes.
The fabrication decline comes mainly from solar makers thrifting (using less silver per panel) and switching to substitute materials. Data centres, AI, autos and power grid investment remain demand sources. Kitco argued that silver’s price case increasingly depends on investment demand.
The fall would turn structurally bearish only if restrictive policy cut investment and industrial demand for a prolonged period while substitution and recycling lifted supply. Keep these caveats in view:
- One month of core inflation does not prove a persistent acceleration, and the missing year-on-year data limits trend reading.
- Deficits act with a lag, and investor selling or recycling can temporarily outweigh a physical shortfall.
- Thrifting in solar continues to weigh on industrial demand.
What could soften the pressure
Weaker jobs or inflation data could lower expected tightening, easing yields and the dollar. Safe-haven demand driven by geopolitical stress or debt concerns could also support silver even as yields rise. The research found no well-documented historical post-CPI episodes to use as precedent, so what happens next depends on the data that follows.
The same logic applied in September, when a 10-year yield above 5% weighed on a zero-yield metal even as Middle East tensions offered safe-haven support, showing the opportunity cost channel can outweigh geopolitical fear.
One hot session tells you about rates and the dollar. The longer silver story depends on investor flows and industrial demand that take months to show.
Reading the next CPI release with the transmission chain in mind
The chain runs in a clear order: an inflation surprise shifts Fed odds, that lifts yields and the dollar, the opportunity cost of holding metal rises, and silver reprices. You can apply that sequence to any future release before deciding what a metals move means for your portfolio.
Over the coming weeks, watch:
- The Fed’s December decision and whether it opts for 25 or 50 basis points
- The US Dollar Index around 102.3
- The 10-year Treasury yield near the 5.00% mark
- Silver’s $50.00 psychological support and the $48.62 year-to-date low
If yields and the dollar ease while those supports hold, the macro pressure may be fading. If they keep climbing, the chain is still running.
Investors exploring how far rate forecasts can be trusted will find our deep-dive into the Fed rate outlook, which shows how major banks disagree by 50 basis points on the terminal rate.
This article is for informational purposes only and should not be considered financial advice. Investors should conduct their own research and consult with financial professionals before making investment decisions.