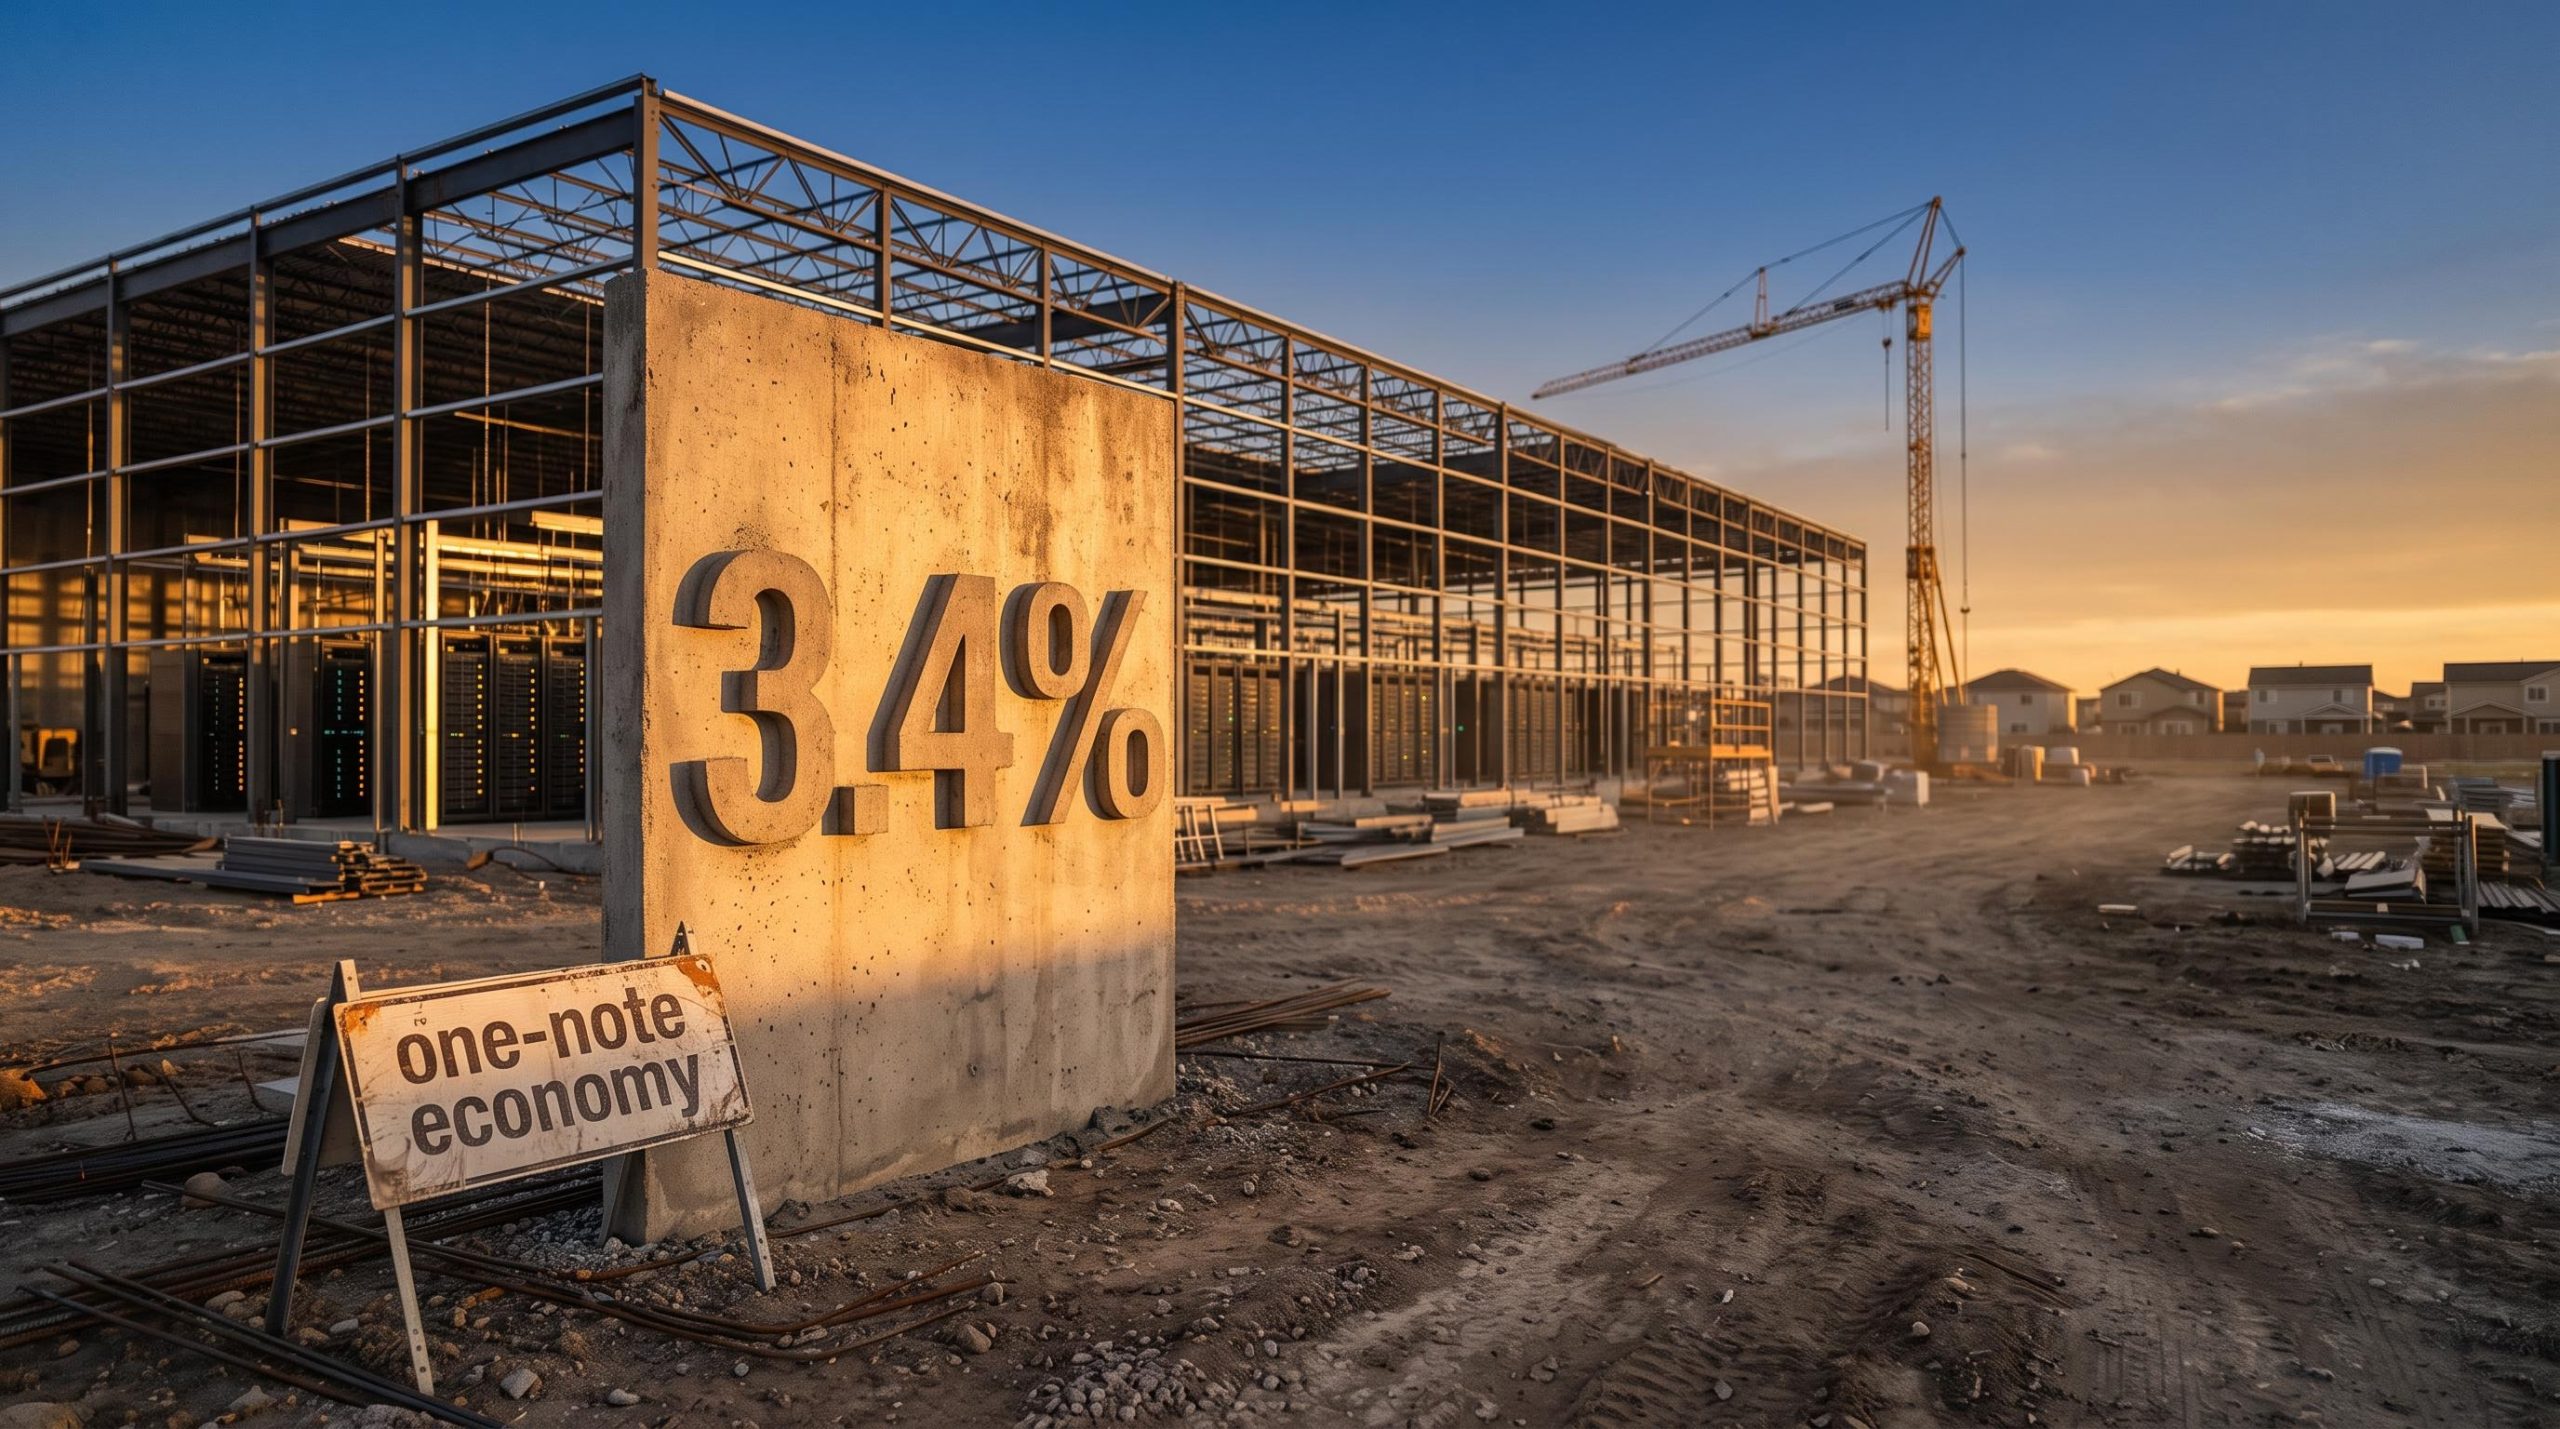
The US economy grew at a 3.4% annualised pace in the third quarter. Nobody can say exactly how much of that came from AI investment, and the official figures do not try.
If you read strong GDP as proof of a broad, healthy economy, that gap matters. A headline number can look solid while resting on only a few sources of growth.
The timing makes the question urgent. Tuesday’s consumer price index (CPI) for 10 November and Friday’s producer price index (PPI) for 13 November arrive days after an Nvidia-led selloff. They also follow a jobs report that kept a December rate hike firmly in play.
Here is a practical framework for judging whether AI-led growth can last. It covers what the GDP figure contains, what the competing AI estimates actually measure, and which data readings this week would strengthen or weaken the case.
What did Q3’s 3.4% growth actually consist of?
Start with the arithmetic. The US Bureau of Economic Analysis (BEA) advance release on 29 October 2026 put real GDP growth at 3.4% annualised. That figure is the sum of several strong parts and one very large subtraction.
| Q3 component | Reported figure | Effect on growth |
|---|---|---|
| Consumer spending | +3.8% annualised | Positive, estimated at about 2.5 pp |
| Inventories | Rebuilt | Added 1.61 pp |
| Equipment investment | Increased | Positive (no separate AI line) |
| Imports | +19.7% annualised | Subtracted 2.64 pp |
| Final sales to private domestic purchasers | +4.9% annualised | Underlying private demand |
GDP deducts imports because they represent production that happened abroad. The source that prompted this debate argued that pressure from war, tariffs and energy costs pushed up import costs enough to effectively erase consumption’s contribution. On that reading, data-centre equipment and inventories did the rest, which makes the US a “one-note” economy.
Treat that as an argument rather than an established fact. Reuters-based figures still show consumption adding about 2.5 percentage points, and the BEA does not publish a standalone AI or data-centre line. Any AI share is an estimate.
Scale check Consumer spending is about 68% of GDP. Investment accounts for roughly 15-20%.
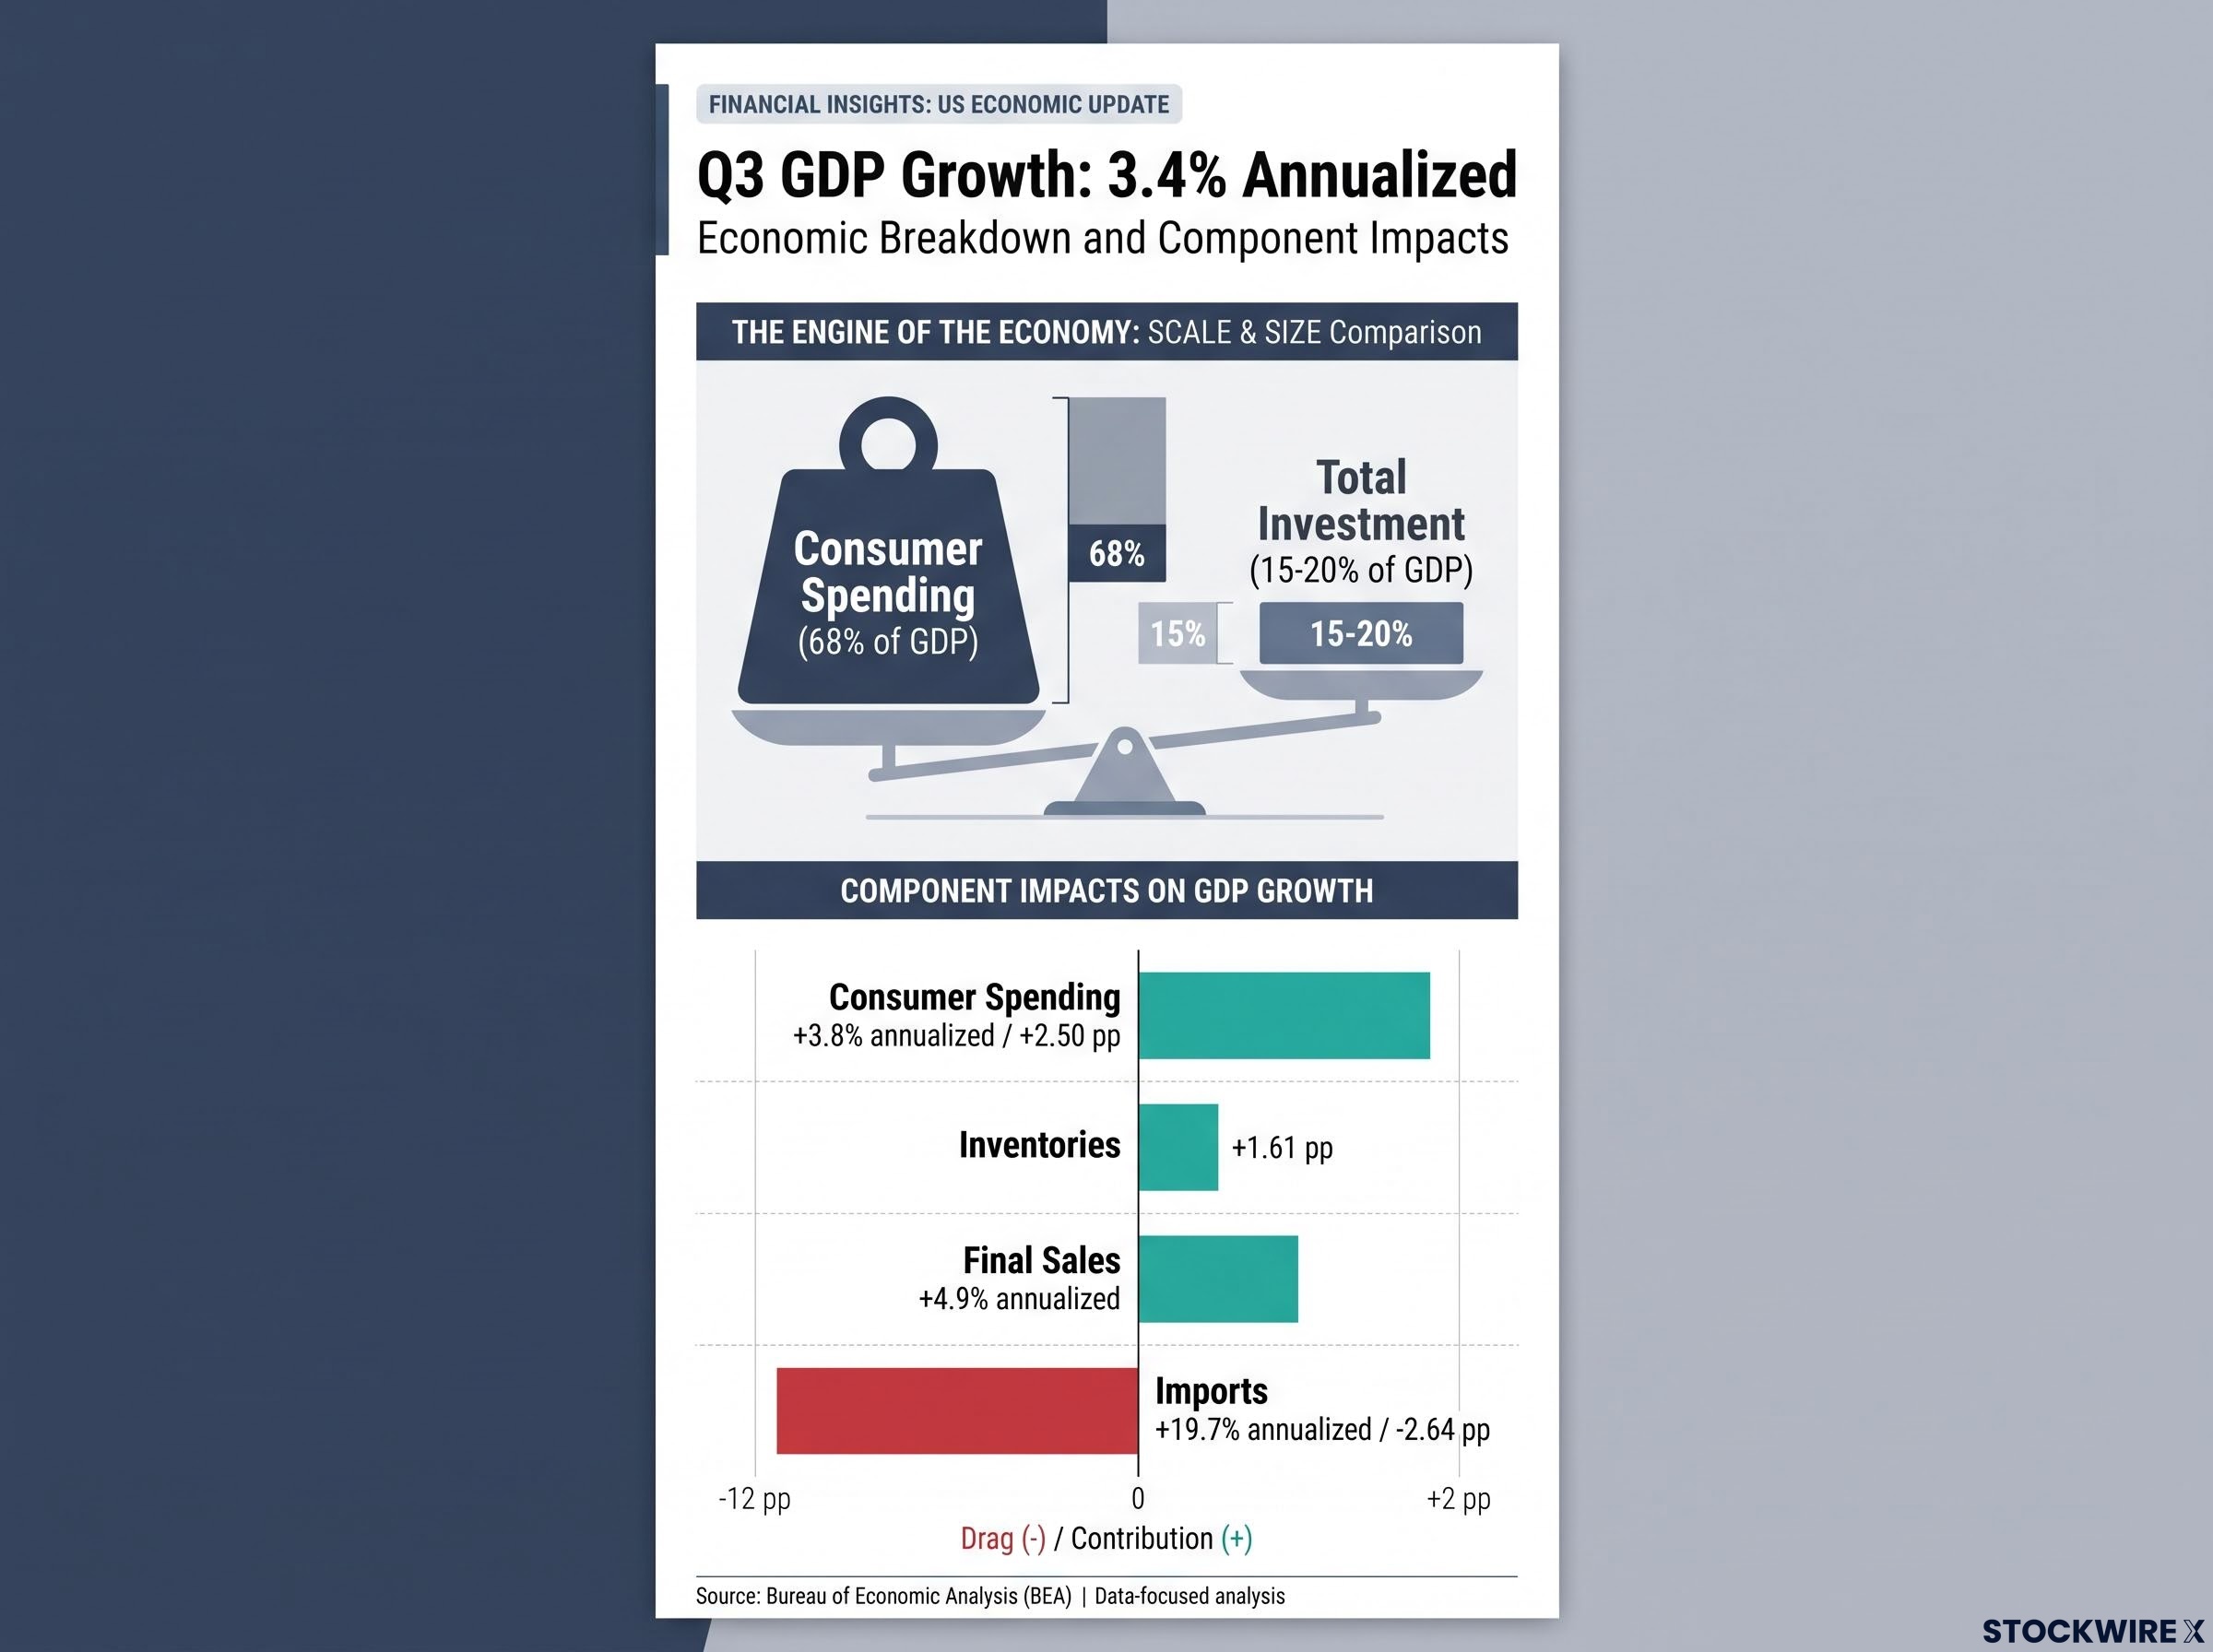
Consumer Spending, which makes up 68% of GDP, added +2.5 pp to the Q3 GDP Growth of 3.4% Annualized.
That ratio is the real story. If households pull back, AI spending alone is unlikely to fill the hole, however fast data centres are built.
The Q1 GDP data showed the same pattern earlier in the year, with business investment surging while consumer spending slowed and residential investment contracted, so growth had not yet broadened across the economy.
When big ASX news breaks, our subscribers know first
How much of US growth is really AI? The estimates disagree
Once you accept that the BEA does not measure AI directly, the next question is who is estimating it, and how.
| Source | Date | Estimate | What it includes |
|---|---|---|---|
| J.P. Morgan Asset Management | 2 September 2026 | 0.47 pp of 2.1% growth (about one-fifth) | AI investment proxy, net of imported hardware |
| Morningstar | 26 October 2026 | About 1 pp | AI-fuelled tech investment, first half of 2026 |
| Oxford Economics (Adam Slater, via Reuters) | 2 November 2026 | About one-third | 2025-26, including wealth and market effects |
The spread comes from method. J.P. Morgan nets out imported chips and equipment, and it found consumption contributed more than three times as much as AI. Slater’s wider figure counts the wealth that rising AI stocks gave shareholders to spend.
Imports explain much of the gap. When a data centre is filled with chips made overseas, much of the spending leaves the US economy, so the near-term boost to domestic output is smaller than the headline capex suggests.
The size of the build-out is not in doubt. Goldman Sachs reported on 10 July 2026 that tech investment as a share of GDP had passed its 1990s peak, with the largest cloud spenders’ 2026 plans almost 50% above estimates from six months earlier. J.P. Morgan projects US AI capex rising from more than $800 billion in 2026 towards $1.2 trillion by 2030. These are projections and depend on market conditions.
The record IT spending share of GDP earlier this year also shows where the rewards concentrate: semiconductors, data centre REITs and power companies, rather than AI application stocks where monetisation remains contested.
Measured investment today is also separate from the productivity payoff, which depends on whether ordinary firms later put the infrastructure to work.
For you, the disagreement has two edges. Any claim that AI “is” the economy is overstated. Still, a share of one-fifth to one-third is large enough that an AI reversal would show up in headline growth.
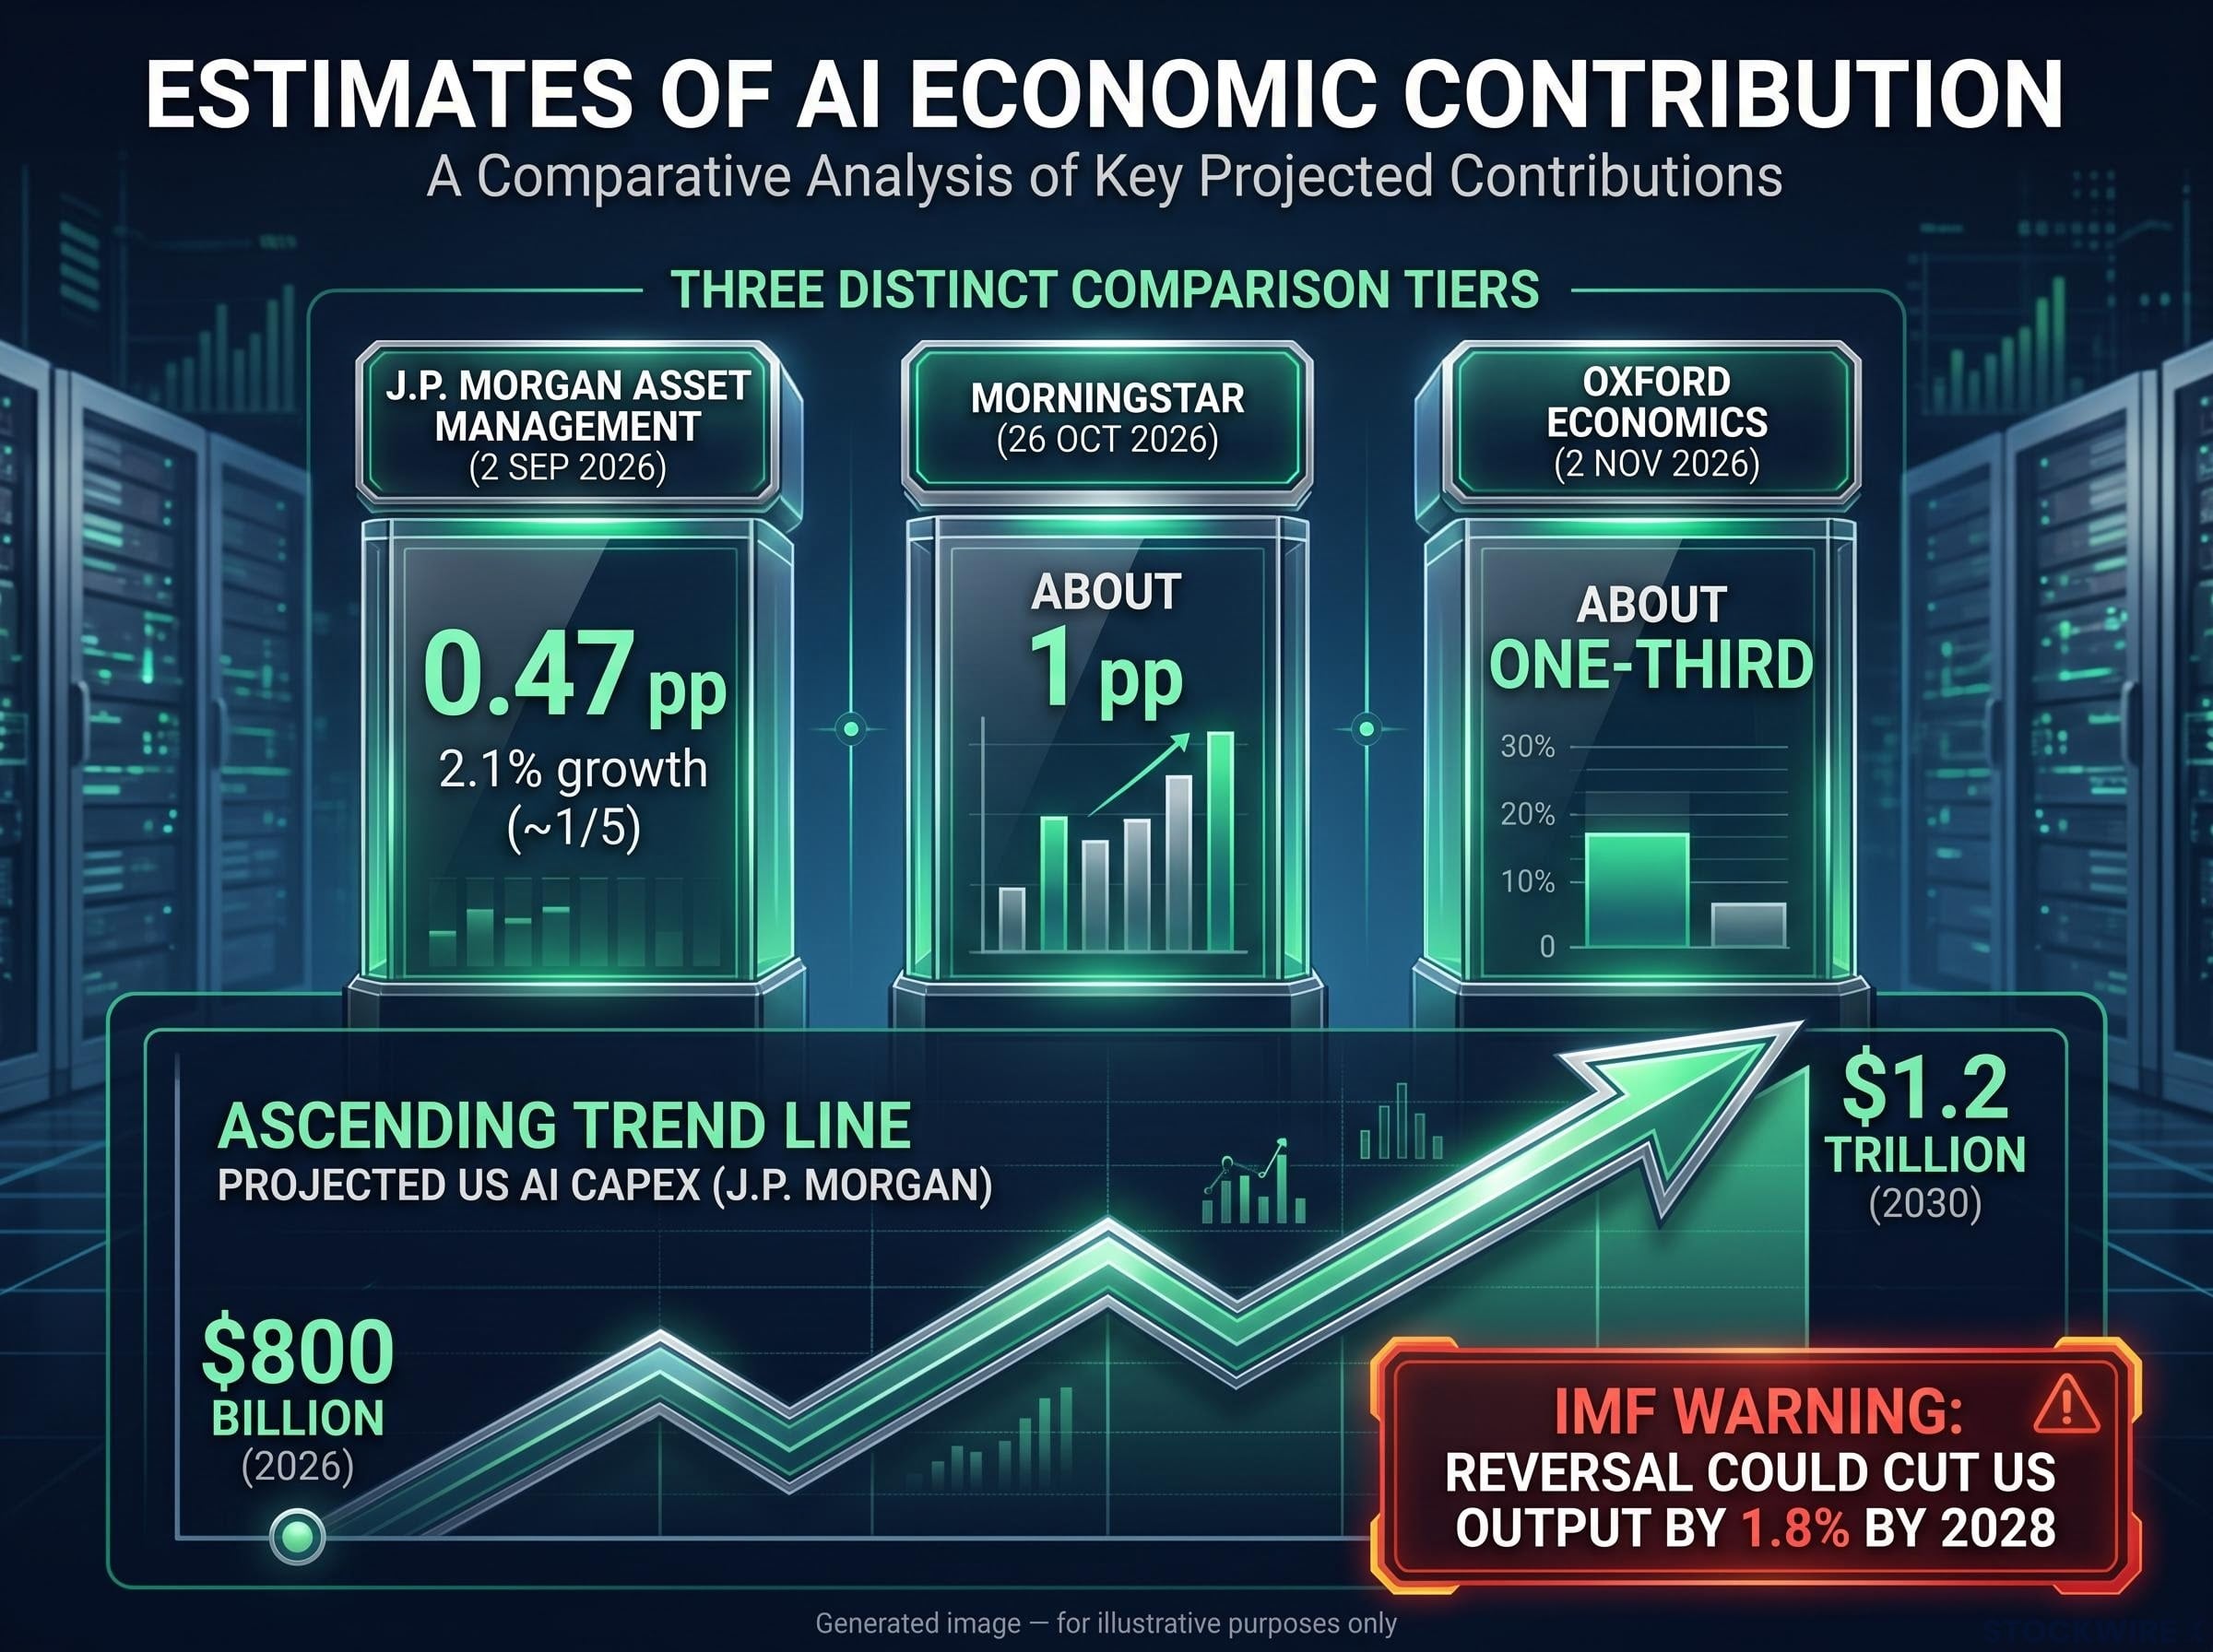
Estimates of AI’s current economic boost range from 0.47 pp of 2.1% growth to About one-third, while Projected US AI Capex reaches $1.2 trillion.
What China’s split CPI and PPI reveal about AI demand
China offers an early look at how AI demand passes through prices. October figures released on 9 November by the National Bureau of Statistics, reported by Reuters, sent two opposite signals.
Consumer inflation slowed to 0.7% from 0.9%, below the 0.8% forecast. Producer prices jumped 5.7%, up from 5.0% and above the 5.3% forecast. That was the fastest factory-gate inflation in more than four years.
Four forces pulled the measures apart:
- Energy and industrial inputs. Energy-related industries supplied about 0.61 percentage points of the monthly PPI rise.
- Weak domestic demand. Zhang Zhiwei, chief economist at Pinpoint Asset Management, linked the low CPI to soft household demand.
- AI-linked exports. The statistics bureau tied improved industrial pricing to stronger demand for AI-related raw materials and equipment.
- Supply-side adjustment. Efforts to curb overcapacity tightened conditions in selected industries.
The lesson is that AI demand can lift factory prices without lifting household spending. A strong producer-price signal on its own does not prove broad economic health.
What the pattern would look like in US data
The original source proposed that the US might show the reverse: firm consumer prices alongside softening producer prices. Treat this as a hypothesis. If it appears, it would suggest earlier pipeline cost pressure is not being refilled by industrial demand, and on that source’s reading, that AI-related demand is fading.
Reading this week’s CPI and PPI as a test of AI demand
That hypothesis gets its first test this week. A StoneX preview (9 November) and Business Standard (8 November) point to headline CPI of +0.3% month on month and 3.9% year on year, up from 3.7%. Core CPI, which excludes food and energy, is expected at +0.2% monthly and 2.8% annually, up from 2.6%. The Cleveland Fed nowcast sits near +0.24% headline and +0.21% core.
For Friday’s PPI, the original source cites expectations of +0.4% headline after +1.3%, and +0.3% core after +0.7%. Other previews did not confirm these figures, so treat them as provisional.
The key distinction is cause. Inflation driven by demand tends to respond to higher rates. An energy or import-cost shock can slow output while keeping inflation elevated, which leaves the Federal Reserve in a harder position.
| CPI/PPI outcome | Likely reading | What it implies for AI demand | Fed implication |
|---|---|---|---|
| Hot CPI, cooling PPI | Cost push reaching consumers | Pipeline demand may be fading | Sticky inflation with slower growth |
| Hot CPI, hot PPI | Broad demand plus input costs | Industrial and AI demand still firm | December hike case strengthens |
| Soft CPI, firm PPI | China-style split | Upstream demand intact, consumers softer | Mixed; consumption becomes the watchpoint |
| Both near consensus | Moderation as previewed | No clear new signal | Existing pricing largely holds |
The first row is the one to watch. A hot CPI alongside a cooling PPI would point to cost-push inflation rather than strong AI-led demand, which is the less comfortable mix for your view of rate risk.
Fed hike pricing, the Nvidia selloff and a sustainability test
Whatever the inflation data shows, it feeds into rates, and rates feed into AI spending. Futures priced roughly 77% to 83% odds of a 25 basis point hike on 9 December, according to PrimeRates (7-9 November) and Hossa. The original source put the odds near 84.5%. The expected target range after a hike is 4.00%-4.25%, with one more hike priced for 2027.
October’s jobs report kept that pricing in place. Payrolls rose 165,000, unemployment held at 4.1%, and the ISM surveys read 55.5 for manufacturing and 54.5 for services. ISM readings above 50 indicate expansion.
Then chip stocks broke. On 5 November, Nvidia fell more than 9%, the Philadelphia Semiconductor Index dropped more than 12%, and about $2.5 trillion was wiped from the Nasdaq. Nvidia recovered 3.8% the next day, then slid 4%-5% in premarket trading on 9 November. Several pressures were at work at once: regulatory worries after the midterms, a concentrated AI trade, rising rates and oil, and scrutiny involving CEO Jensen Huang.
Truist’s work on the semiconductor cycle peak argues that the recent slide looks more like a valuation correction than a fundamental top, since industry revenue forecasts kept rising while the index fell.
Why the same capex can help now and hurt later
The link from markets to the economy runs through financing. Higher rates raise borrowing costs for data centres. Falling tech shares shrink household wealth and investor appetite, and both can lead companies to cut capex before any productivity gains arrive.
IMF warning A sharp reversal in AI investment could cut US output by 1.8% by 2028.
History offers a precedent. Late-1990s fibre and the railway booms both left behind useful networks, yet each was overbuilt relative to near-term revenue. You should read last week’s selloff as a channel through which rates and valuations can slow capex, not as evidence that demand has already broken.
To judge whether the expansion can last, check four things:
- Financing: whether borrowing costs and equity values still support new projects.
- Revenue validation: whether AI spending starts producing matching sales.
- Consumer resilience: whether the 68% of GDP keeps growing.
- Diffusion: whether productivity gains spread beyond the companies doing the building.
Judging a one-note expansion: signals to watch after this week
AI capex is real investment, and it is also a concentration risk. The coming weeks will show which side carries more weight.
Four signals will settle much of the question:
- Consumer spending: whether household demand holds up as prices rise.
- PPI versus CPI: whether a US version of China’s split appears in reverse.
- 9 December decision: whether the Fed hikes into energy-driven inflation.
- Hyperscaler guidance: whether the biggest cloud companies maintain their spending plans.
If consumers hold up and producer prices stay firm, the case for AI-led growth gets stronger. If both weaken while CPI runs hot, growth is resting on fewer sources of support.
This article is for informational purposes only and should not be considered financial advice. Investors should conduct their own research and consult with financial professionals before making investment decisions. Past performance does not guarantee future results. Financial projections are subject to market conditions and various risk factors.