The start of a Fed tightening cycle feels like the moment to worry. The Federal Reserve held its target range at 3.75%-4.00% on 28 October, yet futures now put the odds of a Fed rate hike in December 2026 at roughly 77-81%. The more useful question is how large this cycle becomes. Whether it has started was settled in September.
Markets are fixed on the 8-9 December Federal Open Market Committee (FOMC) meeting. The FOMC is the Fed committee that sets US interest rates.
Jeff Schulze of the Franklin Templeton Institute argues that the cumulative size of tightening does far more damage than any single meeting. His analysis from October 2026 shapes much of the evidence below, and every figure here is a point-in-time reading as of early November.
You will come away with a working framework for separating meeting-day noise from the allocation decisions that matter over years. It covers how to read the pricing, what history says about cycle size, where earnings stand and how the AI productivity debate fits in.
What is the market pricing for the Fed’s December move?
On the surface, the story looks dramatic: a rate hike is now the expected outcome. The dates tell a calmer story.
The Fed raised rates by 25 basis points in September 2026, its first increase since July 2023. A basis point is one hundredth of a percentage point, so 25bp equals 0.25%. In October the Fed held, but the vote was 10-2, with Lisa Cook and Beth Hammack dissenting in favour of another 25bp rise.
Then the jobs data landed. October payrolls jumped well past forecasts, and the odds of a December move climbed with them. The CME FedWatch readings below differ because they were taken on different days, before and after the data:
- About 72% on 1 November
- 76.8% on 6 November
- 81.2% on 8 November, the most recent reading
- October payrolls of +165,000, against consensus of +59,000 (Dow Jones) or +65,000 (FactSet)
- Unemployment at 4.1%, and September CPI at 3.7% year over year (October CPI was not available)
Institutional views cluster around one more 25bp step. They split on what follows.
| Source | Date | View on December and beyond |
|---|---|---|
| CME FedWatch | 1-8 November | 72% to 81.2% odds of a December hike |
| J.P. Morgan Global Research | 3 November | 25bp in December, with no prolonged further cycle |
| J.P. Morgan Asset Management | 28 October | About 50bp more into 2027, conditional on inflation, growth and financial conditions |
| Franklin Templeton (Schulze) | October | December is the probable timing, and possibly the final move |
A hike priced at roughly four in five is a confirmation event. The decision itself is unlikely to change your outlook. The signal worth watching is the guidance on how many hikes follow.
How central banks set rates matters here because the gap between what futures expected and what the committee delivers, rather than the rate level itself, tends to drive the sharpest repricing across bonds, currencies and equities.
When big ASX news breaks, our subscribers know first
Why does the size of the cycle matter more than its start?
The guidance matters because it decides the total, and Schulze’s case rests on the total.
Size over start Schulze argues that the total magnitude of tightening, rather than the first hike, determines how much economic and market damage a cycle causes.
The comparison with the last two cycles shows why. Futures in mid-October implied a cumulative rise of about 115bp, which could be the smallest hiking cycle on record.
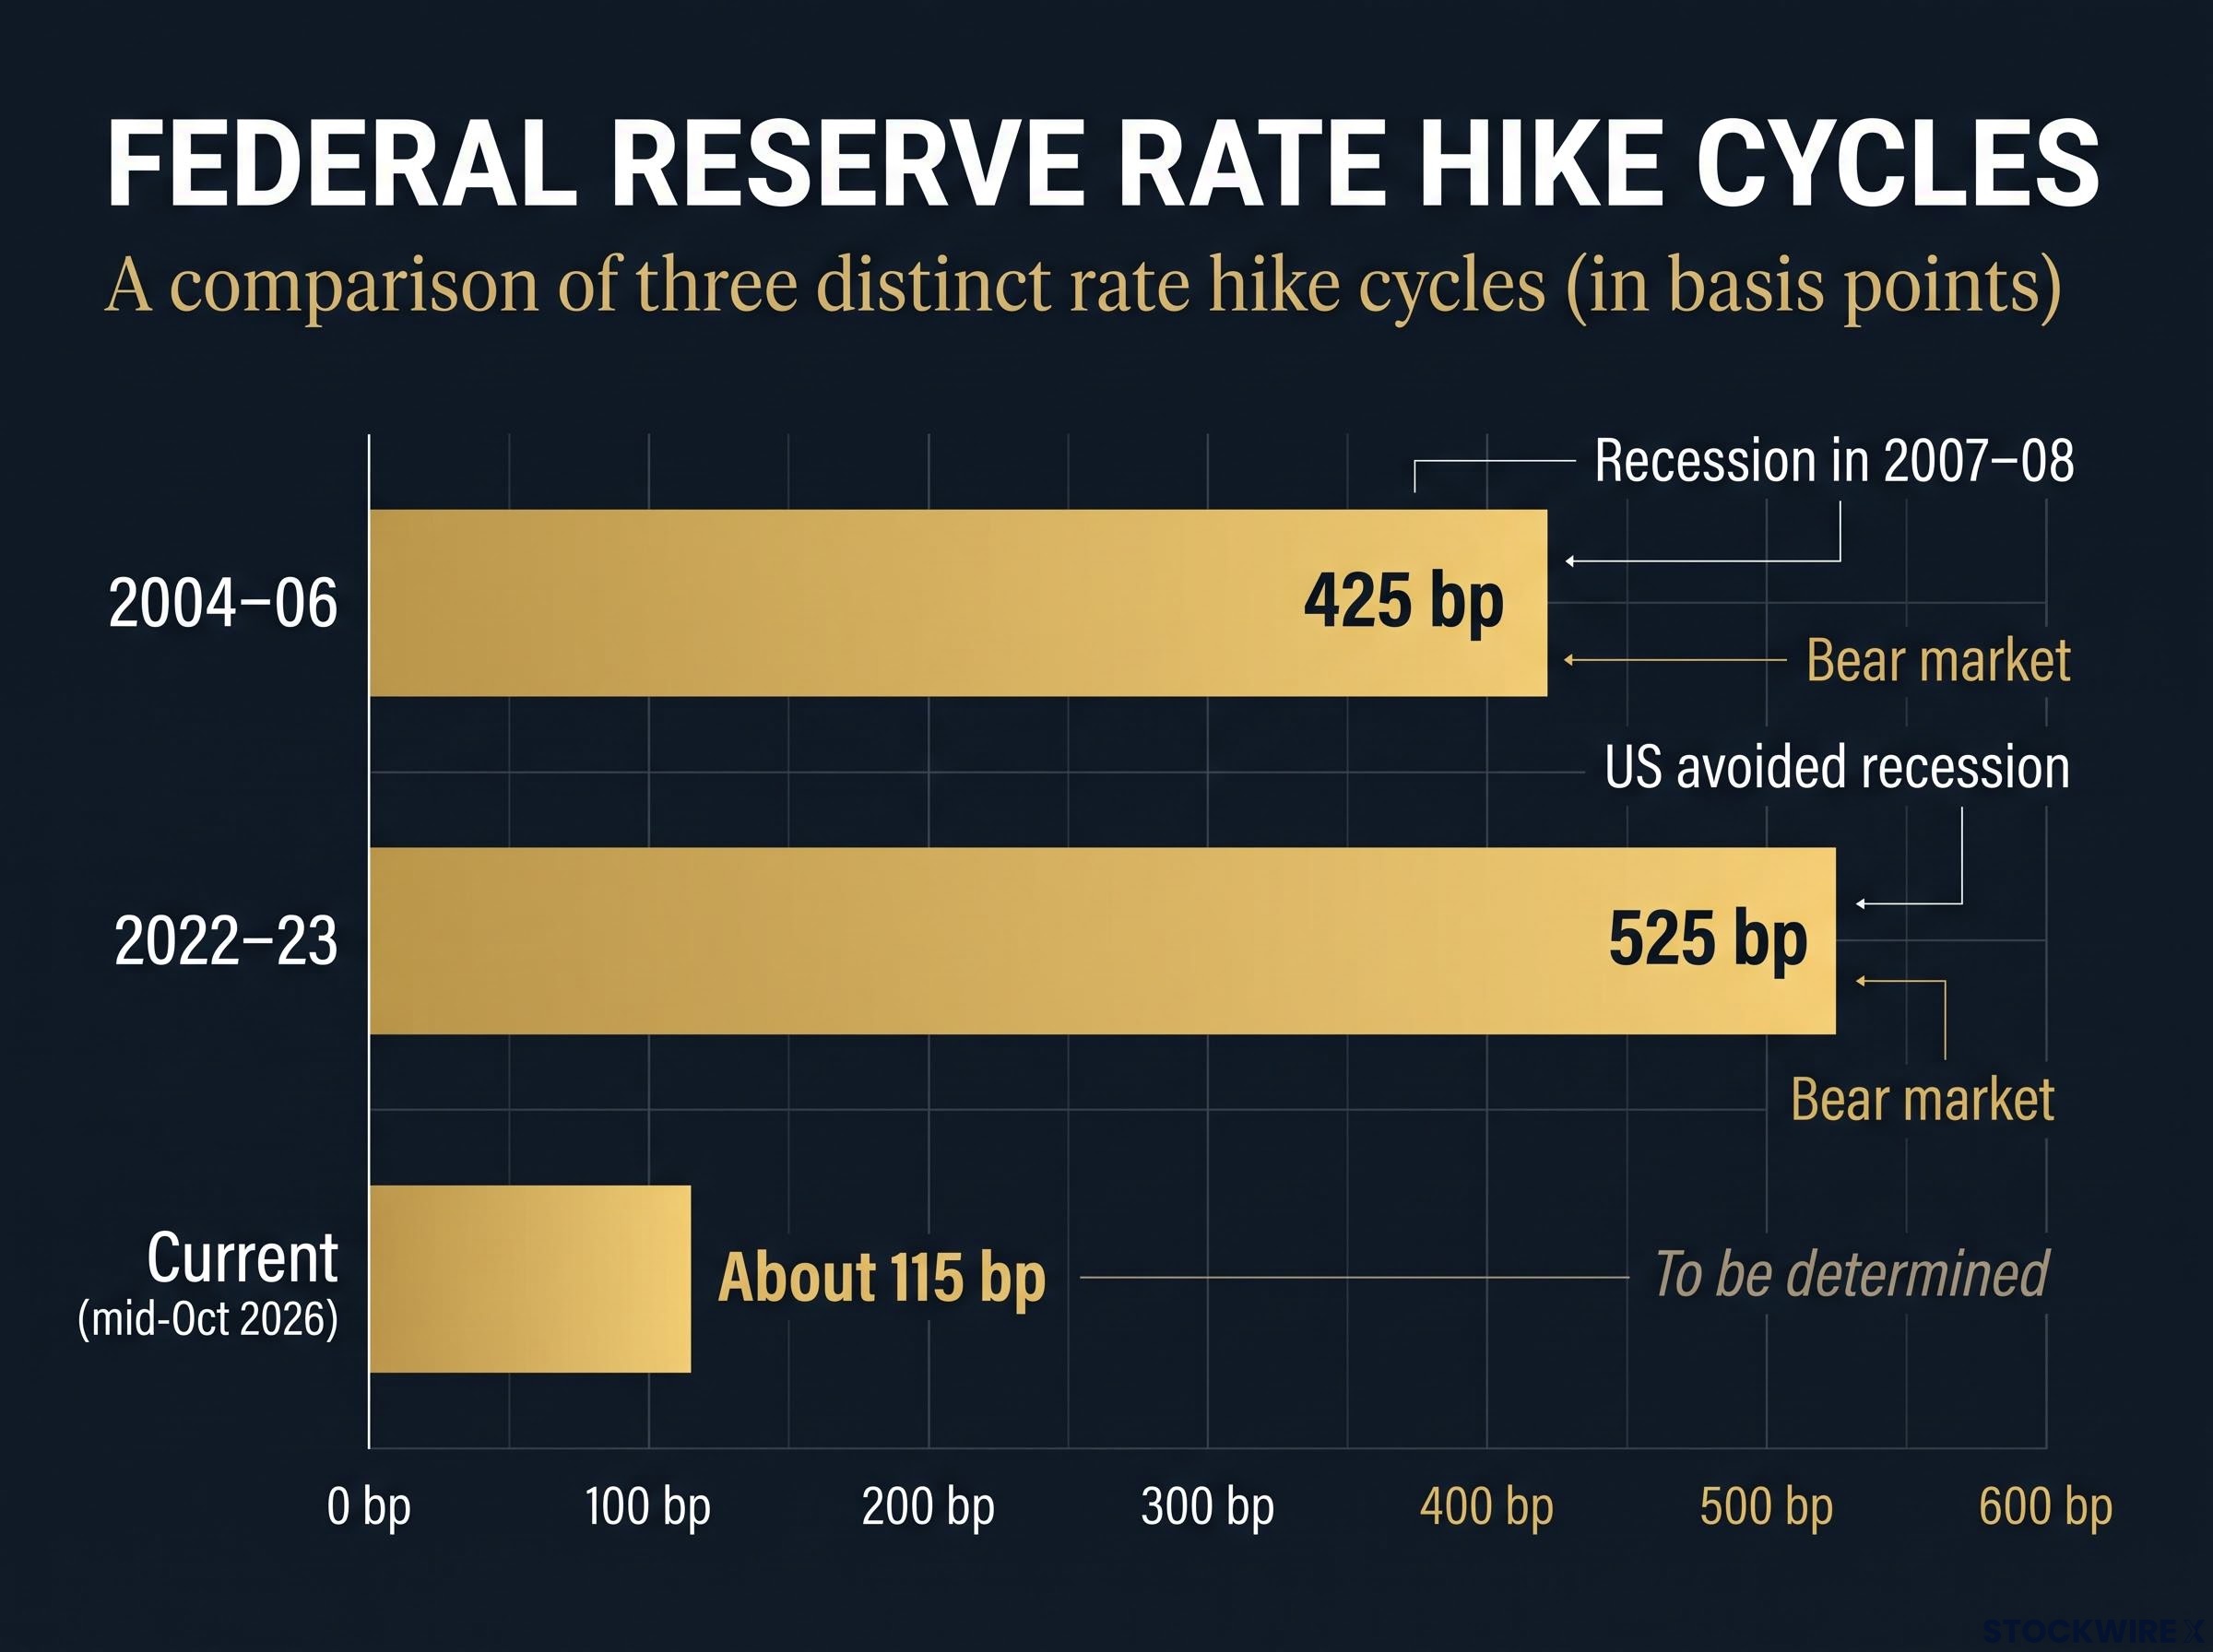
The current hiking cycle is projected to be about 115bp, significantly smaller than the 525bp cycle of 2022-23 and the 425bp cycle of 2004-06.
| Cycle | Cumulative hikes | Economic outcome | Equity result |
|---|---|---|---|
| 2004-06 | 425bp | Recession in 2007-08 | Bear market |
| 2022-23 | 525bp | US avoided recession | Bear market |
| Current (futures, mid-October 2026) | About 115bp | To be determined | To be determined |
Schulze describes the 2022-23 pace as the quickest in 40 years. Against that, a cycle a quarter of the size means a smaller borrowing-cost shock for households and companies, and less pressure on housing and investment spending.
He still expects the usual sequence: early volatility and multiple compression, followed by earnings-led gains. Multiple compression means valuation ratios such as price-to-earnings shrink as rising rates make future profits worth less today.
The table also complicates the argument. Both earlier cycles produced equity bear markets, whatever happened to the wider economy. Size is not the only variable either: the gradual 2004-06 cycle still preceded the 2007-08 recession, a reminder that leverage and financial fragility can matter as much as the rate path.
The read for you is that a small cycle lowers the odds of a damaging squeeze on borrowers and demand. It does not remove valuation risk. Treat it as a better starting point, not a guarantee.
What do equities, earnings and recession signals say so far?
If size sets the starting point, the market evidence shows how investors have handled it so far.
Evidence from past first hikes
Since 1980, the S&P 500 has typically gained an average 5.5% in the three months before a first hike. In 2026 it rose only 0.5 percentage points ahead of the September move. Schulze reads that muted run-up as a sign the adjustment has already happened.
The record after first hikes is mixed:
- RBC Capital Markets / LPL Financial: the S&P 500 was lower three months after the first hike in five of the last six cycles, but recovered within 12 months in four of those five, with a median 12-month gain of 6.8%.
- Strasmore: the SPY fund was down about 2.4% (2004), 2.3% (2015) and 15.8% (2022) three months on, though the author warned three cycles is too small a sample.
- A StockCharts-cited study: an average fall of roughly 4% in the first six weeks, followed by a general recovery.
The pattern points to an early wobble, then an outcome driven by inflation, earnings and financial conditions.
Goldman Sachs data on S&P 500 returns after first hikes adds another lens, showing an early dip of around 2% that has tended to be small relative to the recovery that follows, with 2022 treated as an outlier.
Earnings and recession indicators now
Earnings are the strongest part of the case. FactSet reported on 6 November that with 88% of S&P 500 companies reported, 84% had beaten estimates.
Q3 2026 earnings Blended earnings growth of 31.4% year over year, up from 30.1% a week earlier and 29.1% at 30 September.
If sustained, that would be the eighth straight quarter of double-digit growth. All 11 sectors grew, and seven posted double-digit gains.
Schulze’s late-cycle checklist covers clearly restrictive real rates, an inverted yield curve, widening credit spreads and weakening leading indicators. He sees none of them now. Franklin Templeton’s Recession Risk Dashboard showed 11 of 12 indicators green in October, which he links to recession odds of about 15%.
Taken together, this suggests de-risking ahead of the meeting offers less value. You should still expect possible short-term volatility.
How should investors separate Fed-meeting noise from the AI productivity thesis?
Schulze also sees US equities signalling a possible AI-linked productivity wave over a three-to-five-year horizon. That horizon runs on a different clock from the FOMC calendar.
How AI productivity could reach rates and valuations
Productivity means output per worker. The neutral rate, called r*, is the interest rate that neither speeds up nor slows down the economy. The chain from AI to your portfolio runs in four steps:
- Higher potential growth as workers produce more per hour.
- A higher neutral rate as more profitable investment lifts demand for capital.
- Higher real yields and term premia. Real yields are bond yields after inflation, and the term premium is the extra return investors demand for holding longer bonds.
- Early sector leadership in “picks-and-shovels” businesses such as semiconductors, cloud, data centres and power.
Expert estimates vary widely. Labour productivity forecasts range from about 0.1pp a year (Daron Acemoglu) to about 1.5pp (Goldman Sachs).
| Source | Date | View on AI, r* and yields |
|---|---|---|
| ABN AMRO | Nov 2026 | AI investment of about 3% of GDP could add about 0.2pp to the neutral rate in 2026-30; r* about 2% in a broad boom versus 1.2%-1.6% otherwise |
| Goldman Sachs Asset Management | 2026 | A realised AI boost would likely lift 10-year real yields |
| J.P. Morgan Asset Management | Oct 2026 | AI capex points to higher real rates and elevated term premia |
| Vanguard | Nov 2026 | Growth toward 3% possible but not guaranteed; neutral rate estimated at 3.5% |
AustralianSuper said in October that gains are visible in technology companies but not yet economy-wide. In August it described AI as a multi-decade theme.
Tactical noise versus strategic decisions
Long-horizon owners, such as Australian super funds with heavy US weightings, show how to split the two clocks:
- Tactical: December odds, payroll and CPI prints, meeting-day guidance.
- Strategic: the three-to-five-year horizon, the real-yield regime, diversification across the AI value chain and across countries, separating earnings growth from multiple expansion, managing US-dollar exposure and using private markets selectively.
The research cautions against simply adding US tech. J.P. Morgan advises staying invested while diversifying by style and geography.
If the thesis plays out over years, one December decision should barely move your strategic allocation. The higher real-yield regime it implies should shape how you hold expensive growth stocks.
Semiconductor valuation frameworks differ by stock type, with PEG ratios suited to hypergrowth names and EV/EBITDA to cyclical recovery names, which matters when rising real yields put pressure on expensive growth multiples.
What the December meeting settles, and what it leaves open
A cycle of about 115bp, with green recession indicators and 31.4% earnings growth, is a more benign backdrop than 2004-06 or 2022-23. It is not risk-free: inflation could persist, valuations could compress, AI leadership is concentrated and earlier hikes are still working through the economy.
Three variables deserve your attention:
- October and November CPI
- The December dot plot and guidance on 2027
- Whether cumulative tightening stays near current futures pricing
Treat 8-9 December as a data point on cycle size, and keep strategic decisions anchored to the multi-year horizon. All figures reflect early-to-mid November 2026 and will move with incoming data.
Past performance does not guarantee future results. Financial projections are subject to market conditions and various risk factors.
This article is for informational purposes only and should not be considered financial advice. Investors should conduct their own research and consult with financial professionals before making investment decisions.