Equity Selloff Cascade or Correction? Signals Investors Should Watch

Wall Street shed about $2.3 trillion in one session as the Nasdaq fell 5.52%, and Bloomberg's Mike McGlone says Thursday's 1.8% bounce does nothing to change where an equity selloff cascade may be heading.
By John Zadeh -
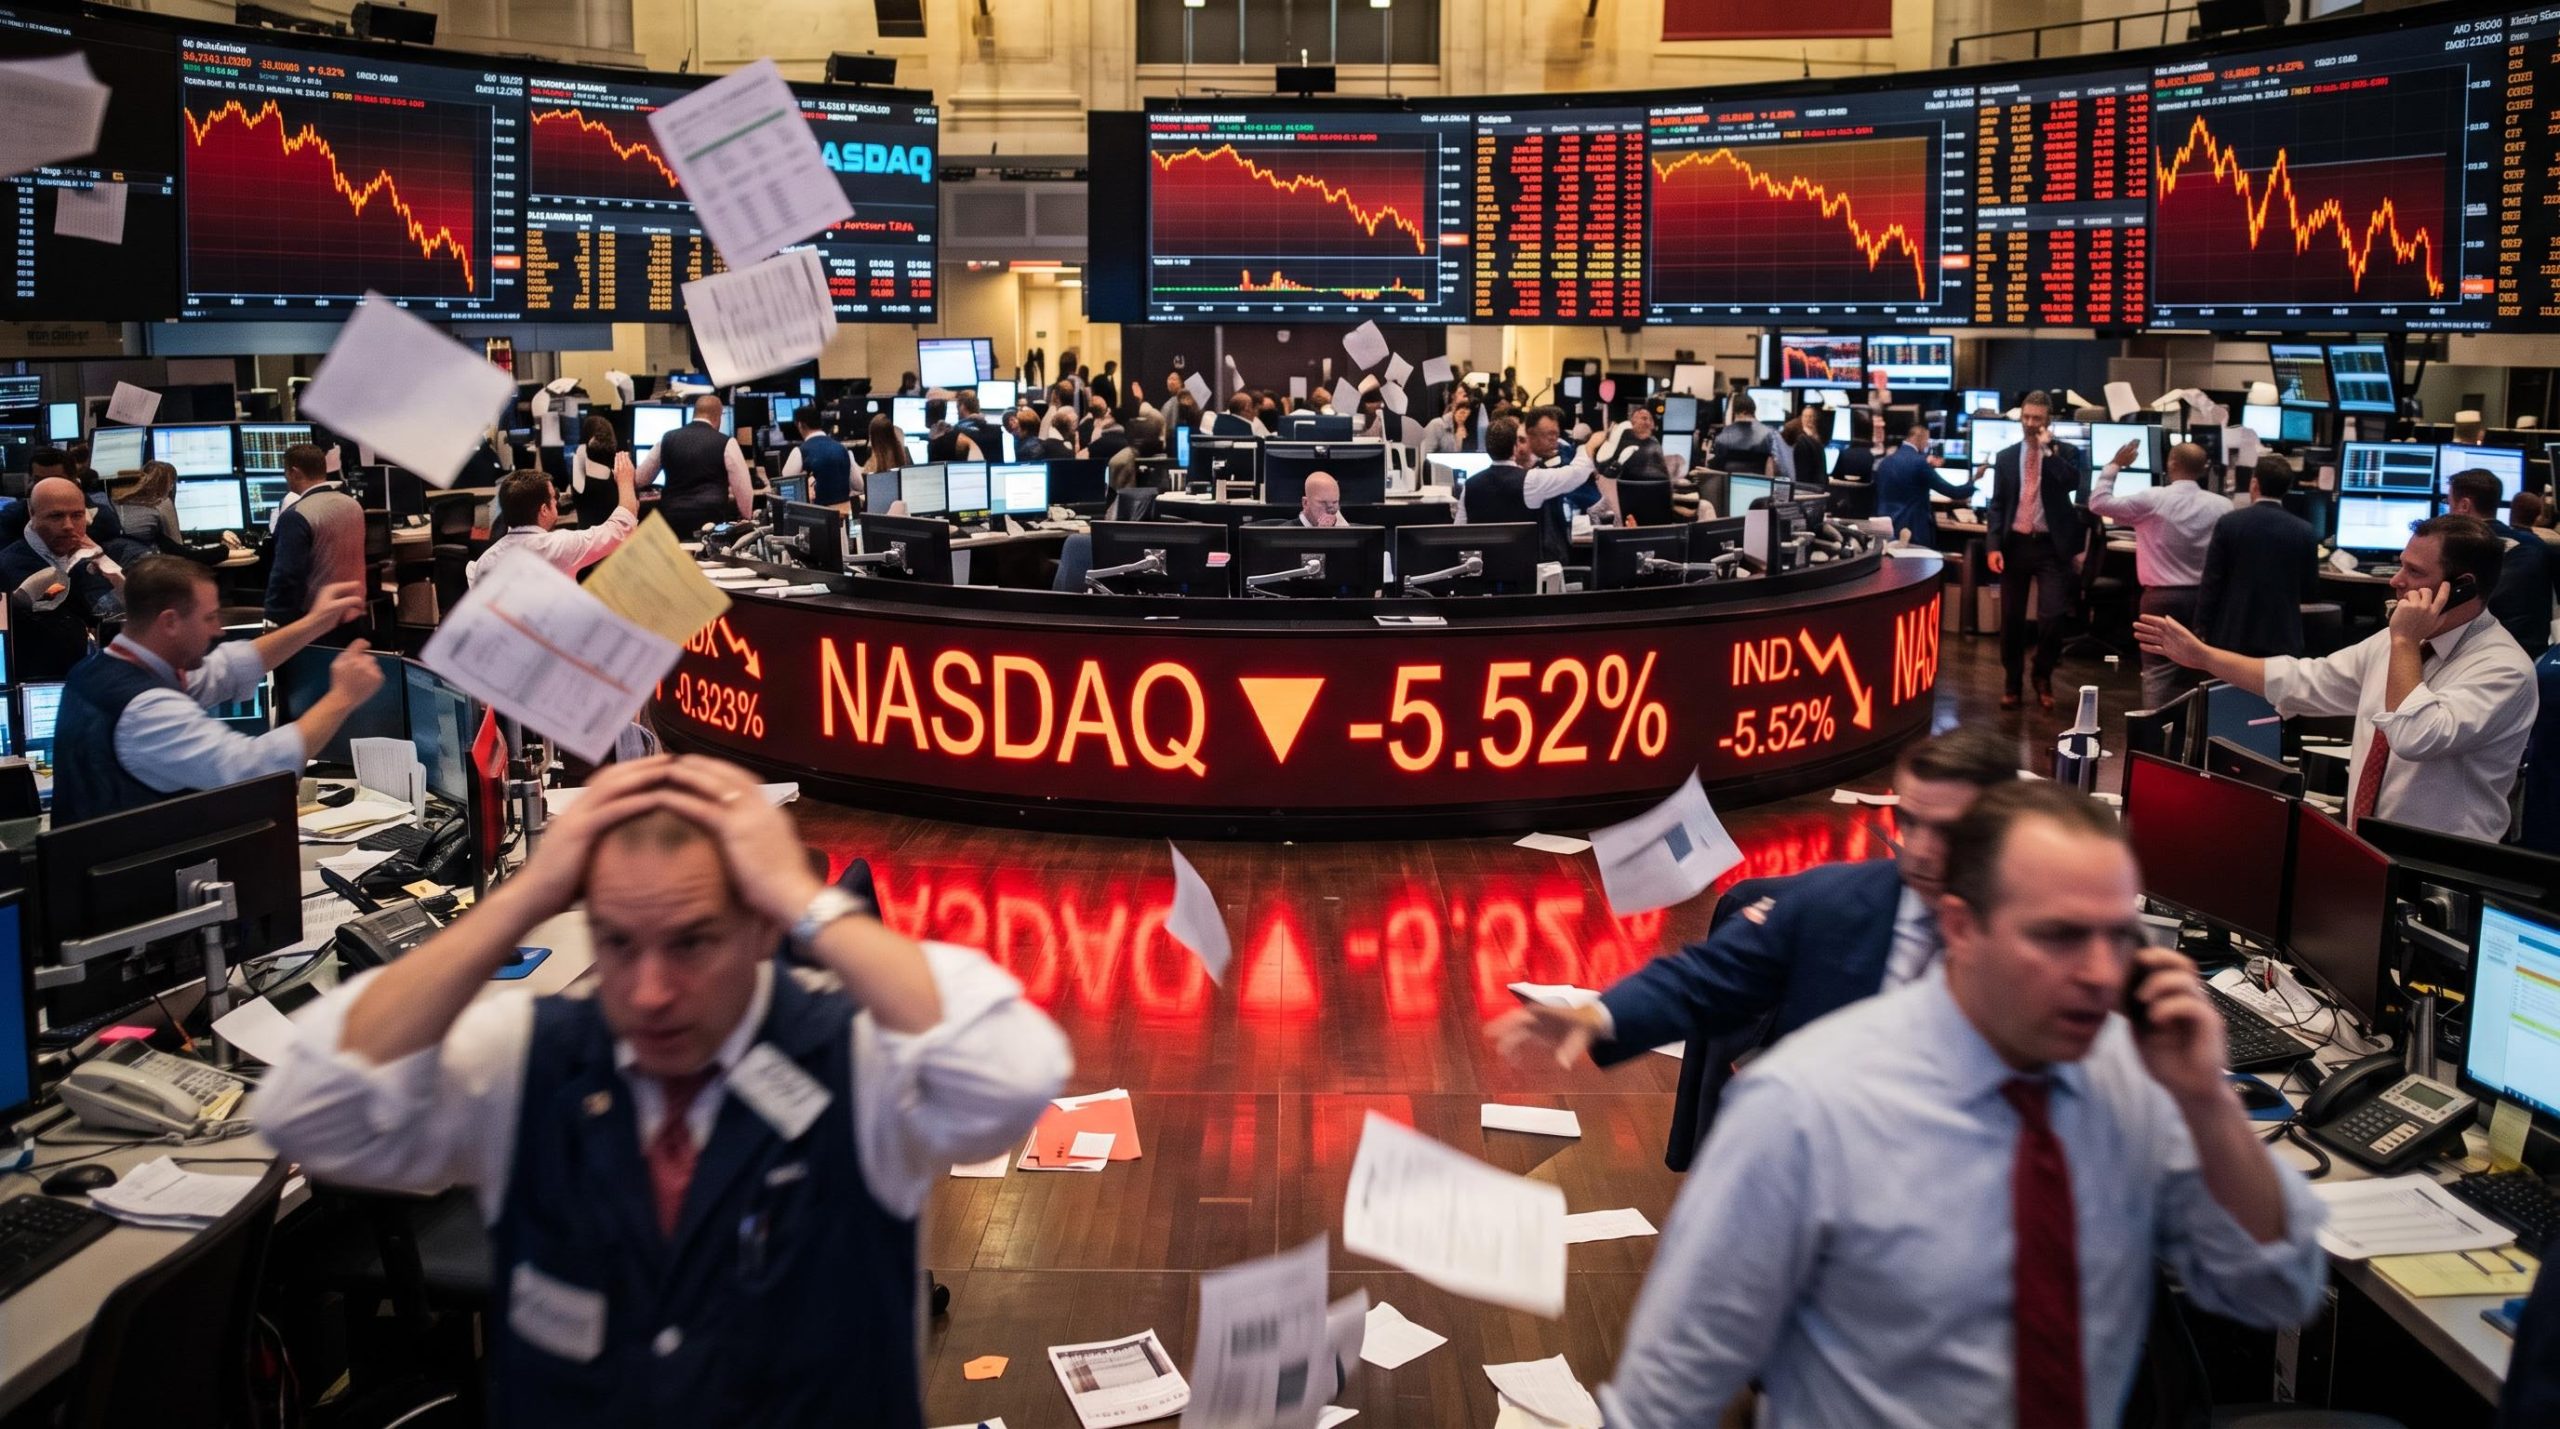
Trading floor ticker flashing Nasdaq -5.52% during an equity selloff cascade as traders react
  • Wall Street lost about $2.3 trillion on 5 November 2026 as the Nasdaq fell 5.52% and the S&P 500 dropped 4.36%, leaving the Nasdaq more than 10% below its 6 October record and in technical correction.
  • Bloomberg Intelligence's Mike McGlone argues a 20% equity drawdown is "nearly unavoidable" and that stocks drive a broad liquidation spreading to crypto and metals, but several of his interview figures drifted from later reporting.
  • The cascade ran through six steps, including CoreWeave bond yields above 16%, an estimated $47 billion of systematic selling (Nomura) and more than $1 billion of crypto derivatives liquidations in 24 hours.
  • The leadership order of crypto, then metals, then stocks is weak: gold, copper and the S&P 500 show unusually high 50-week correlations, so metals can fall with equities rather than ahead of them.
  • The evidence so far supports a concentrated AI-led correction, and the decisive test is whether stress spreads from CoreWeave-style borrowers to hyperscalers, banks or broad funding markets.
Summarise with AI:

Wall Street lost about $2.3 trillion in a single session on 5 November 2026, according to Bloomberg. The Nasdaq Composite fell 5.52% and the S&P 500 dropped 4.36%. Today the Nasdaq bounced roughly 1.8%, and Bloomberg Intelligence commodity strategist Mike McGlone says that bounce changes nothing about where an equity selloff cascade may be heading.

That is the real debate now. One view is that this is a contained correction, a sharp but valuation-driven reset in AI stocks. The other is that it marks the first stage of a liquidation that spreads across stocks, crypto and metals. If you misread which one it is, you either sell into a temporary low or hold through the early phase of something much larger.

Here is a framework for judging any market-wide liquidation: what tends to lead, what follows, and which signals would confirm or refute the cascade thesis. McGlone’s figures come from his interview with David Lin and are attributed to him. Market data comes from named outlets and is current as of 6 November 2026.

What is McGlone actually arguing, and how do the numbers hold up?

McGlone’s case is blunt. He sees stocks as the main driver of a broad liquidation that has only just begun. In his view, metals, crypto and other assets follow equities lower into year-end and into next year.

Mike McGlone, Bloomberg Intelligence: A 20% equity drawdown is “nearly unavoidable”, given how stretched valuations have become relative to GDP and debt.

His valuation argument rests on two claims. Market capitalisation to GDP sits at a century high, he says, and market capitalisation to US debt is at its highest since 2001. He puts total stock market value at about $81 trillion, against a $83 trillion peak this year, with US debt near $40 trillion.

Set those claims against independent data and the picture gets messier. The Buffett indicator measures total stock market value against the size of the economy. StockDoz put it at about 204.6% on 3 November, based on roughly $95.6 trillion in market value against $33.0 trillion of annualised GDP. FinanceBuzz reported closer to 290%. McGlone’s market-cap figures come from a different data series, and his method is unspecified.

Several interview figures also drifted from later reporting.

Metric Interview claim Later reporting Source
S&P 500 drop, 5 Nov Roughly 5% -4.36% to 7,353.73 CNBC
Nasdaq year-to-date gain About 8% +4.6% Reuters
Nasdaq worst fall Worst since Covid Largest one-day fall in 19 months Reuters
Market cap to GDP Century high 204.6% (StockDoz) vs about 290% (FinanceBuzz) StockDoz, FinanceBuzz

The later figures are the ones to rely on. The Nasdaq closed at 24,315.00, the Nasdaq 100 fell 6.4%, and the composite ended more than 10% below its 6 October record, which puts it in technical correction. Retail investors sold a net $338 million of US stocks before late buying cut that to $151 million (Yahoo Finance/WSJ).

What the valuation reading tells you is that the market is priced with little margin for error. It does not tell you when, or whether, a reset begins.

The July chip rout, the worst month for semiconductors since 2008, already showed how a crowded AI trade can reprice sharply while the broader index stays flat.

Does crypto lead, then metals, then stocks? Testing the leadership order

The case for the sequence

A tidy sequence is appealing because it promises an early warning. McGlone lays one out:
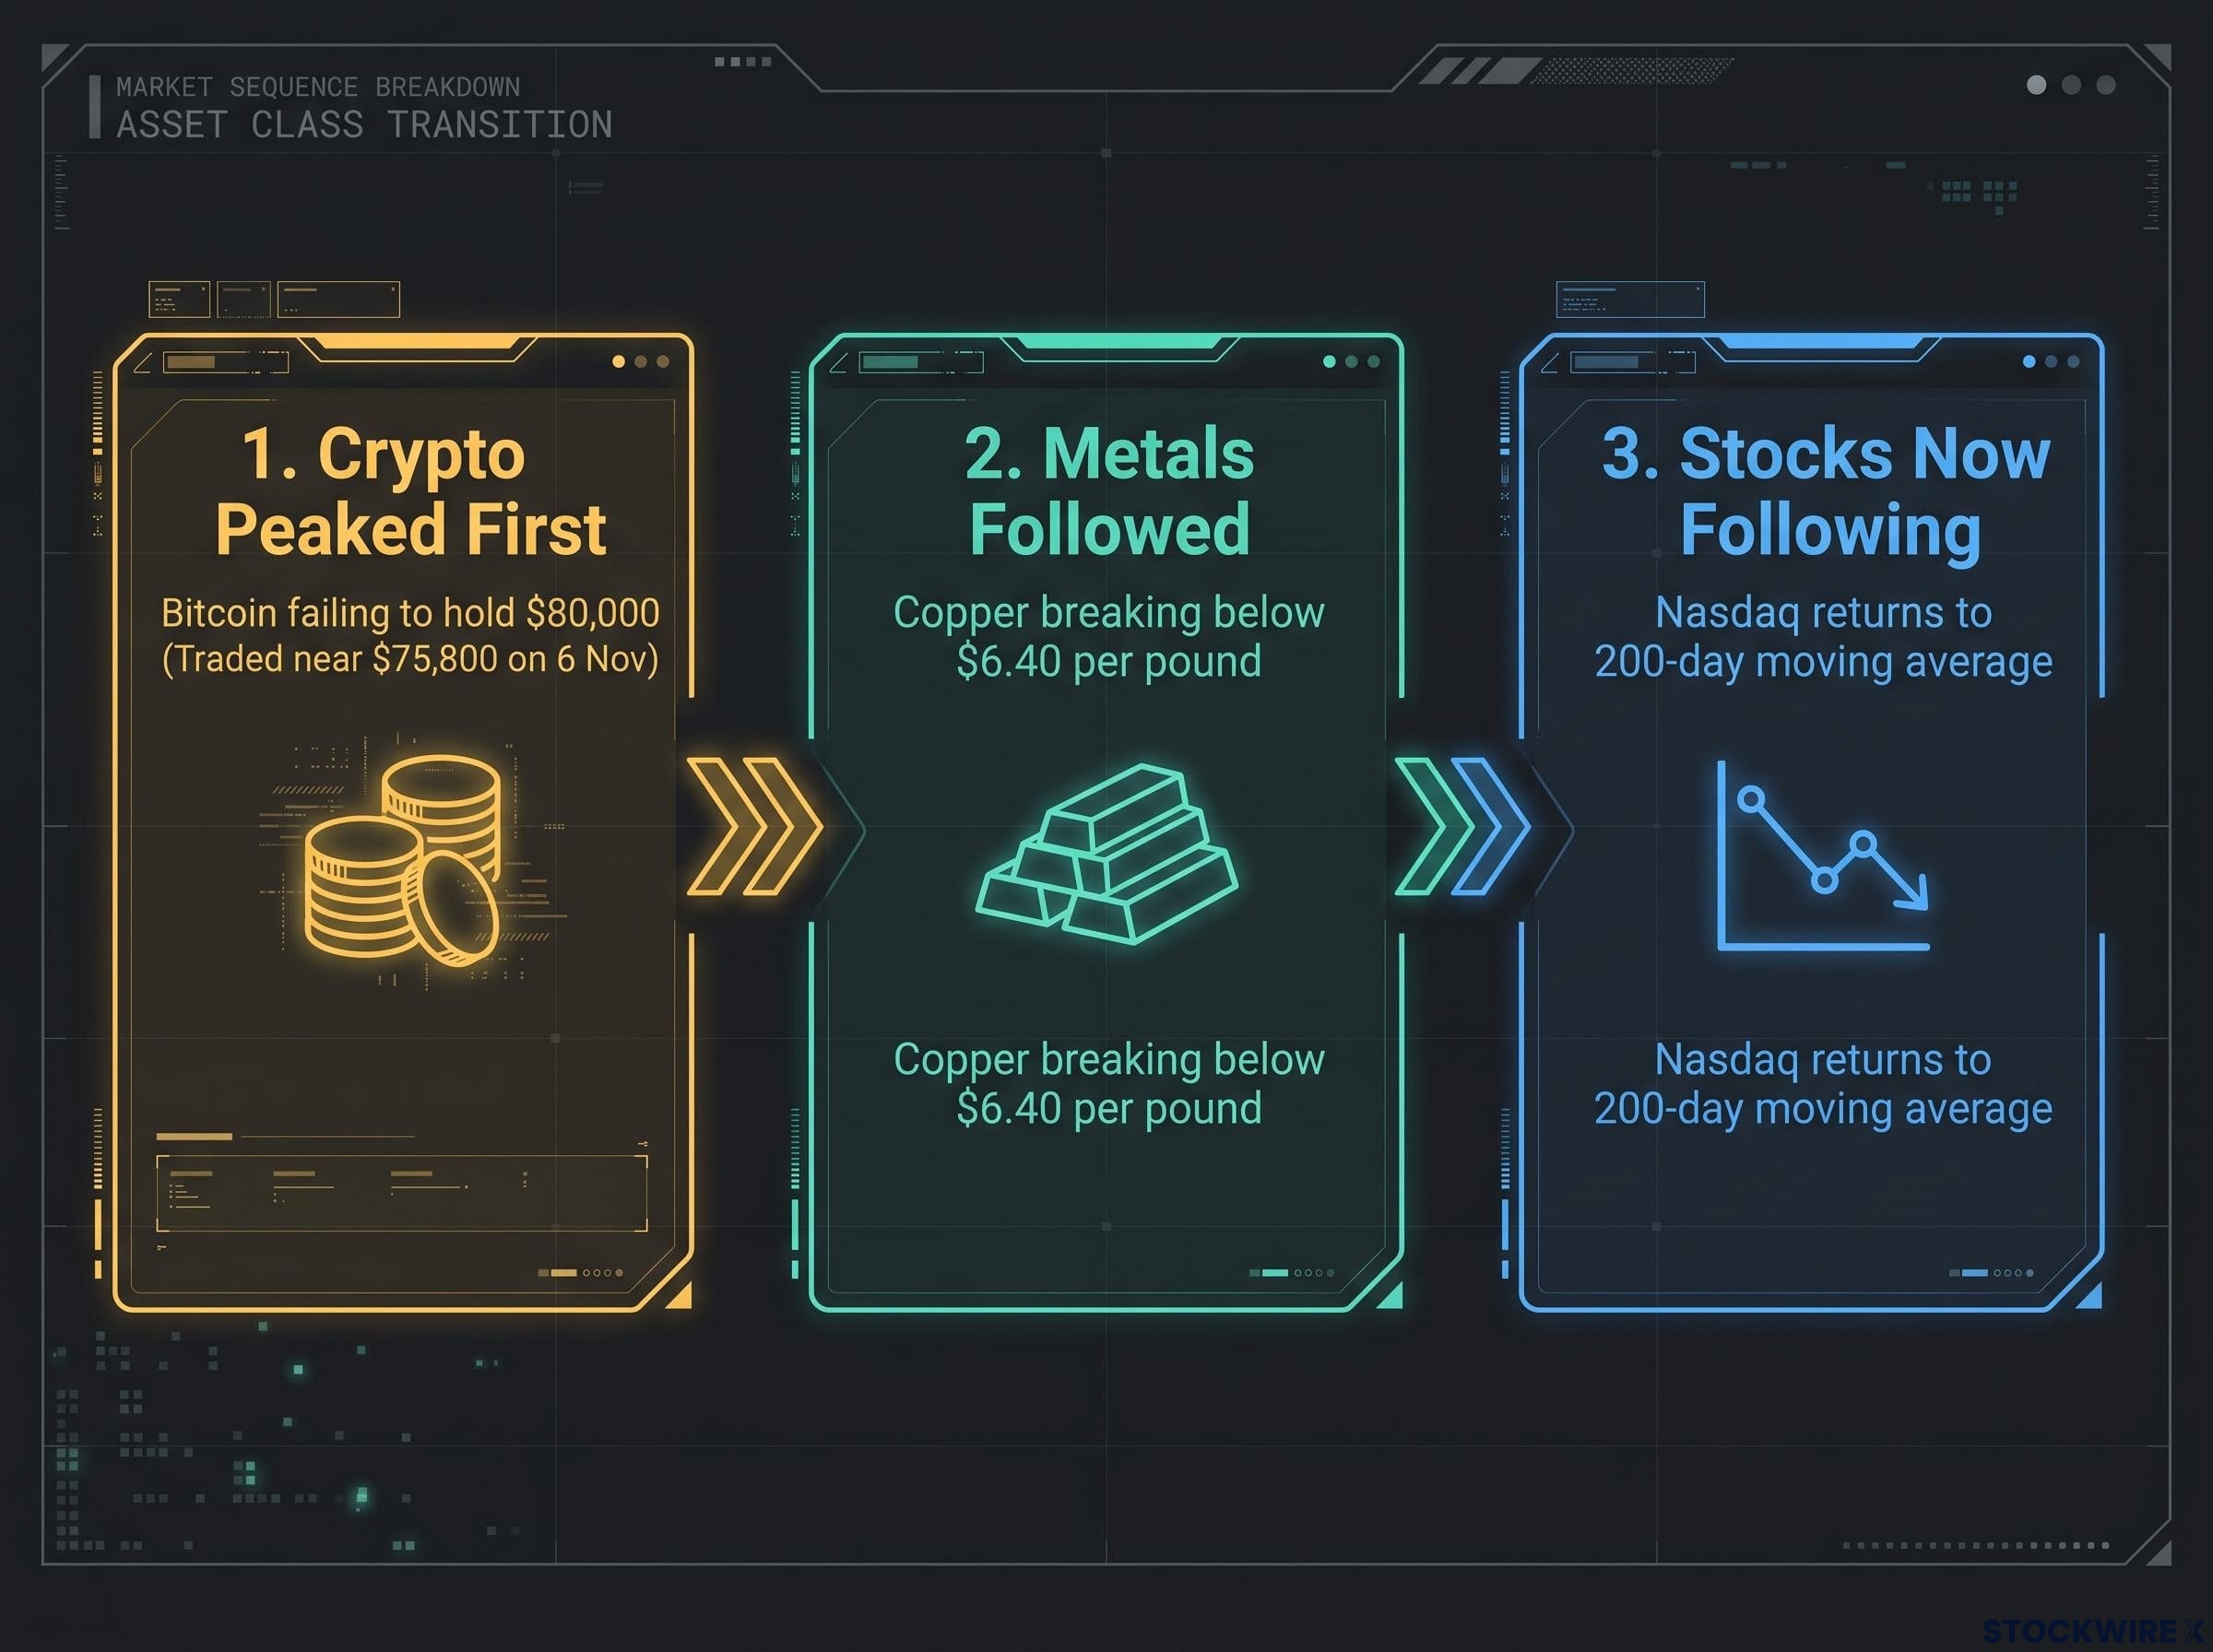
Sequence diagram of asset breakdown: Crypto failed to hold $80,000, metals broke $6.40 per pound, and stocks returned to 200-day moving average.

Crypto peaked first, trading near $75,800 on 6 Nov, before metals broke below $6.40 per pound and stocks returned to their 200-day moving average.

  1. Crypto peaked first. His confirmation signal: Bitcoin failing to hold $80,000.
  2. Precious metals came next. His trigger: copper breaking below support near $6.40 per pound.
  3. Stocks are now following. The Nasdaq and copper have both returned to their 200-day moving averages, which track the average price over roughly the past 200 trading days.

The first trigger has already fired. Bitcoin traded near $75,800 on 6 November, with an intraday low around $75,255 (CCN). More than $1 billion in crypto derivatives positions, mostly bets on higher prices, were liquidated over 24 hours, according to Yahoo Finance. McGlone also floats a 50% retracement of the roughly 100% gain since the 2022 low.

Where the evidence pushes back

The sequence weakens under scrutiny. Benzinga reported unusually high 50-week correlations among gold, copper and the S&P 500, meaning they have tended to move together. In a synchronised deleveraging, metals can fall alongside equities rather than ahead of them.

McGlone’s own framing holds both ideas at once: stocks as the driver, and crypto as the early signal. The evidence from this episode leans towards AI-equity and credit stress leading, with crypto liquidation amplifying the damage rather than forecasting it. The research also does not establish the exact early-October Bitcoin peak, so the size of crypto’s head start is unclear.

If you use Bitcoin or copper as an early-warning gauge, treat them as one input among several. In a forced deleveraging, every correlated asset can fall together, so metals may offer less protection than you expect.

How does a selloff become a cascade? A framework for market-wide liquidation

A violent one-day drop is the part you see on screen. The cascade is the chain of forced selling behind it, where each stage pushes the next one along.
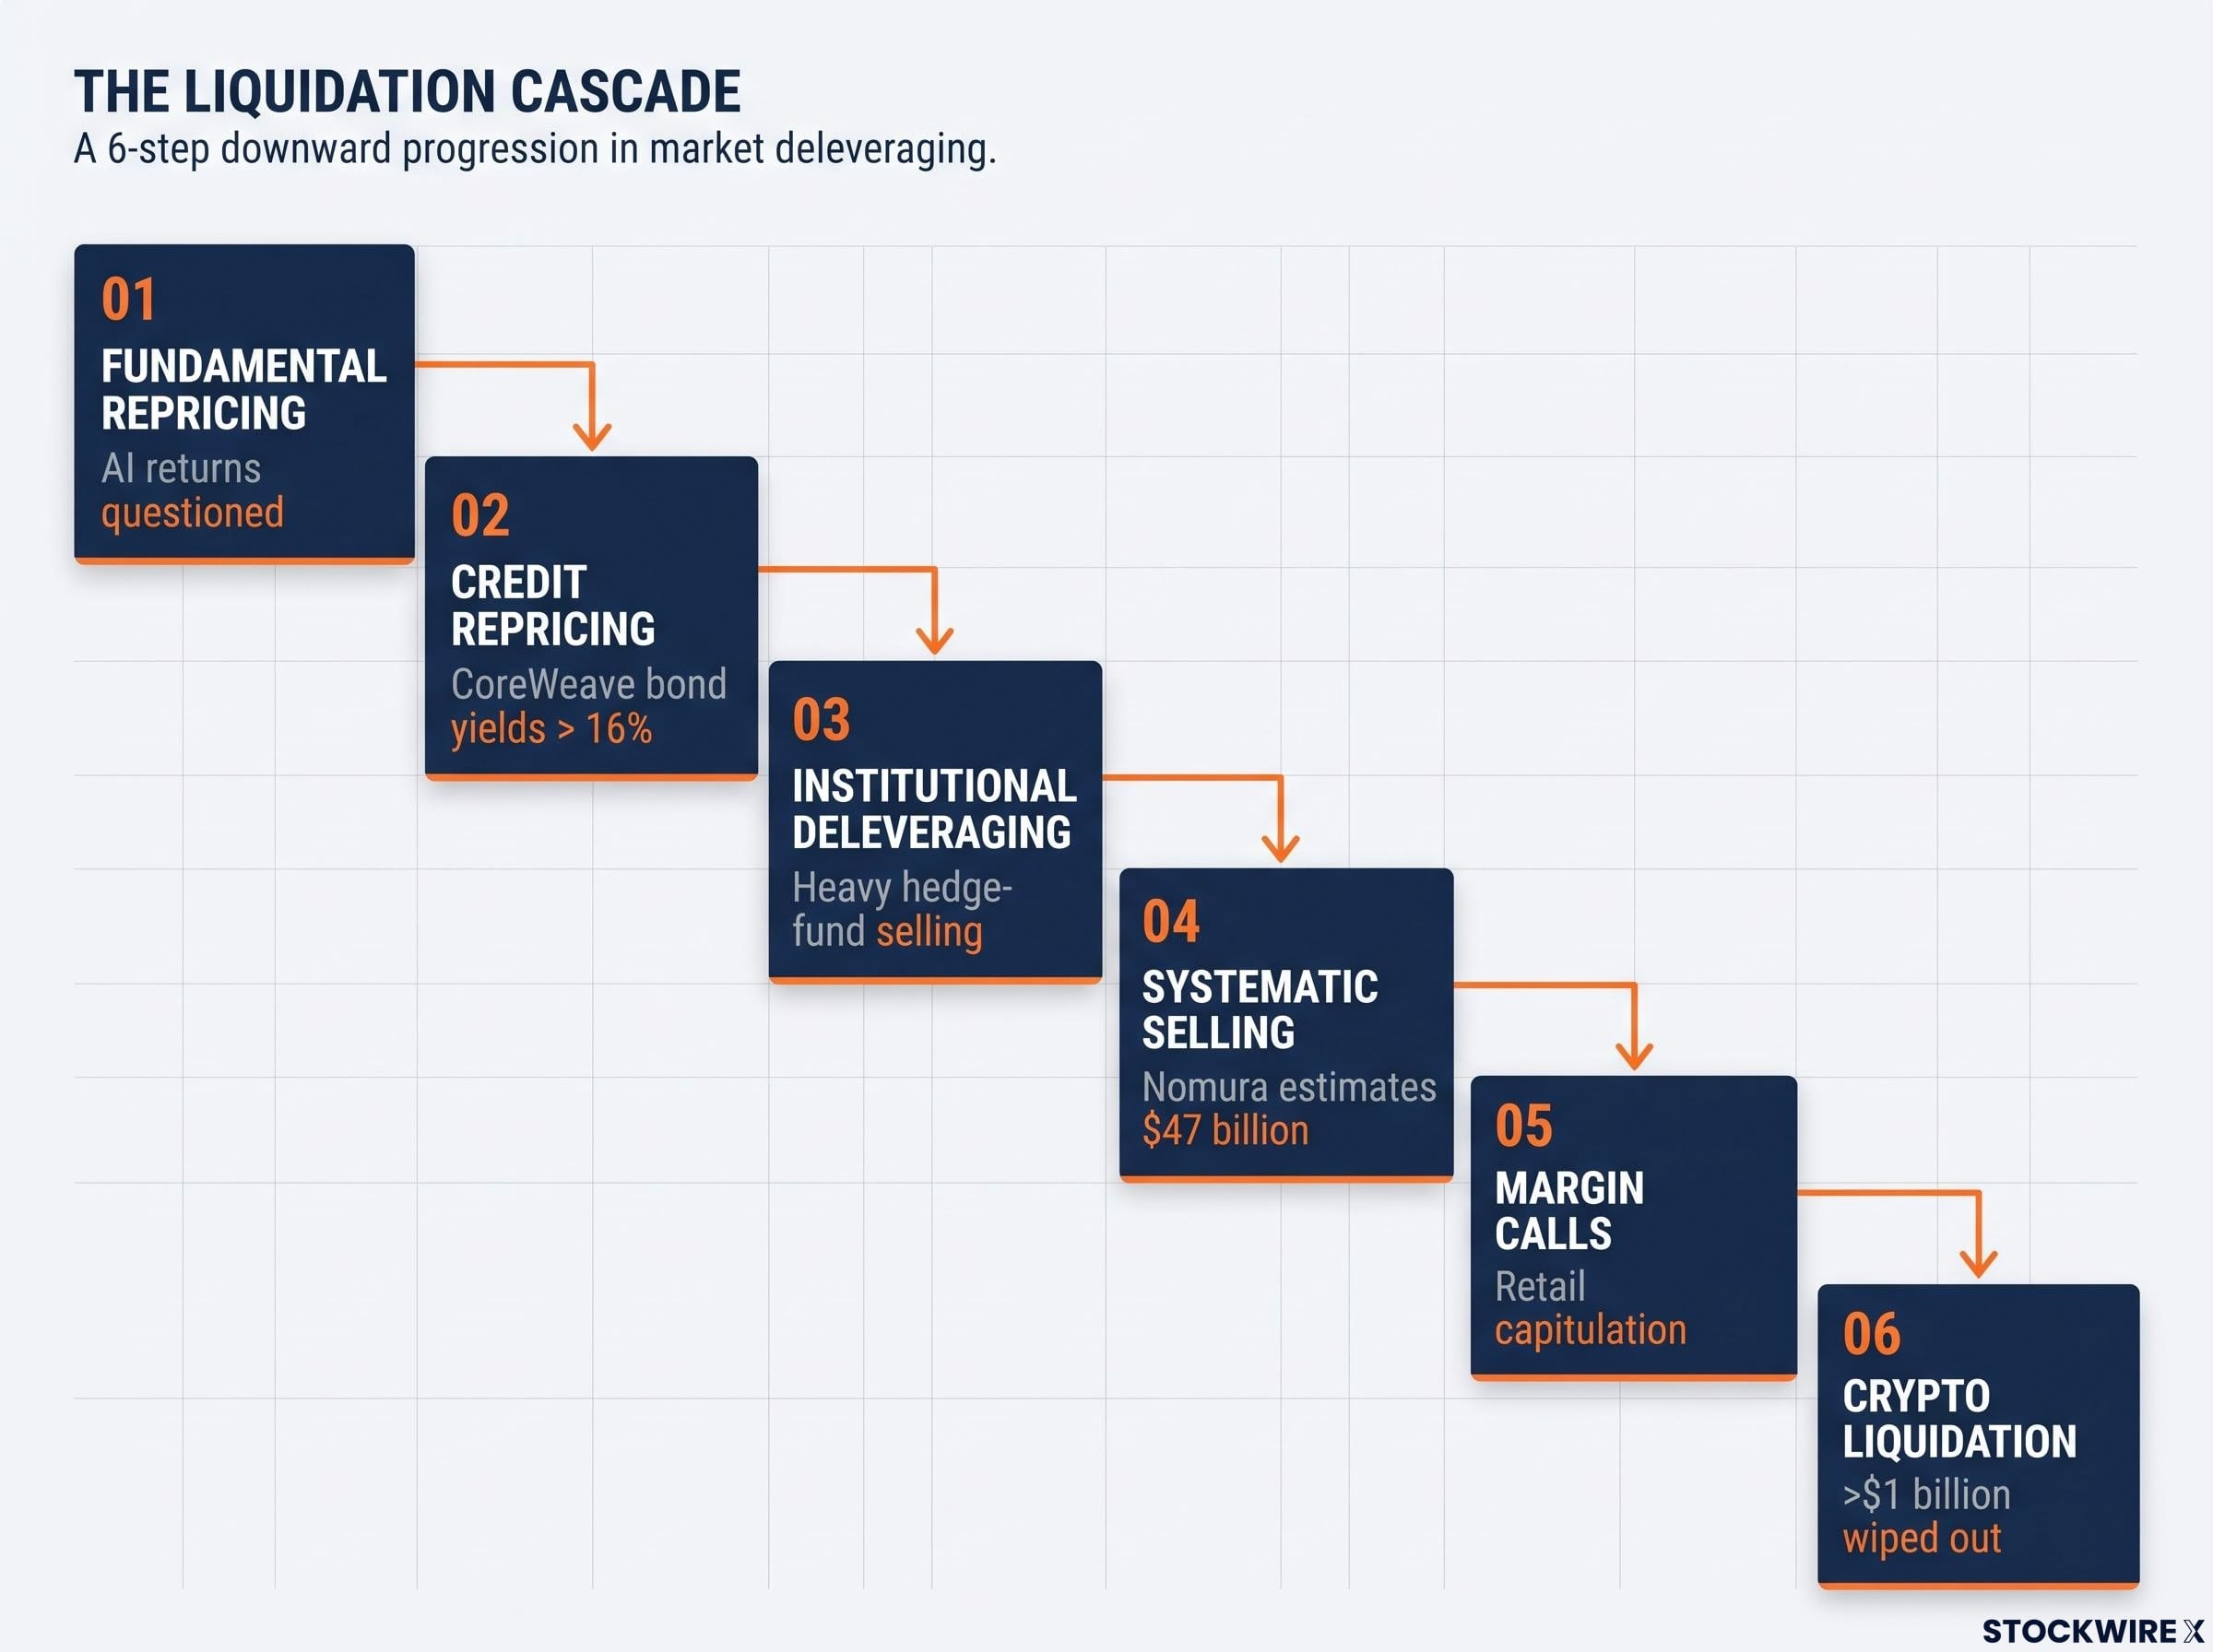
Flowchart of liquidation cascade steps: CoreWeave bond yields ></a> 16%, systematic selling of $47 billion, and crypto liquidation >$1 billion.”></p>
<p><em>The cascade moved through 6 steps, including credit repricing with bond yields > 16%, $47 billion in systematic selling, and >$1 billion in crypto wiped out.</em></p>
<h3>The mechanism, step by step</h3>
<ol>
<li><strong>Fundamental repricing:</strong> investors question whether AI infrastructure spending will earn adequate returns (Reuters).</li>
<li><strong>Credit repricing:</strong> CoreWeave’s bond yields climbed above <strong>16%</strong>, signalling expensive borrowing.</li>
<li><strong>Institutional deleveraging:</strong> Reuters attributed much of the move to heavy hedge-fund selling.</li>
<li><strong>Systematic and leveraged-product selling:</strong> Nomura estimated these strategies could sell about <strong>$47 billion</strong> into the close, its second-largest estimate since <strong>July 2006</strong>.</li>
<li><strong>Margin calls and retail capitulation:</strong> Reuters reported margin calls and spooked retail investors. A margin call is a demand from a broker to add cash when borrowed positions lose value.</li>
<li><strong>Crypto liquidation:</strong> more than <strong>$1 billion</strong> in derivatives positions wiped out in 24 hours.</li>
</ol>
<p>The scale was concentrated. <strong>Nvidia</strong> lost about <strong>$440 billion</strong> in market value on <strong>5 November</strong>, and the Magnificent Seven lost about <strong>$1 trillion</strong> combined (CNBC).</p>
<h3>Mean reversion and the funding channel</h3>
<p>Mean reversion is the tendency for prices that have run far above their long-term average to fall back towards it. McGlone reads the AI declines from early-October peaks this way: <strong>AMD</strong> down about <strong>38%</strong>, <strong>Meta</strong> down <strong>22%</strong> despite <strong>26%</strong> revenue growth, and <strong>Google</strong> down <strong>30%</strong>. Measurement windows vary between sources, so compare like with like.</p>
<div class=

Company Interview decline Market-reporting figure Note on window
AMD About 38% Not available in research Early-October peak to 6 Nov
Nvidia About 25% About $440B lost on 5 Nov (CNBC) Percentage vs single-day value loss
Intel About 62% About 29% (Investing.com) Summer peak to 2022 levels vs initial October selloff
CoreWeave About 70% About 61% below 52-week high by 4 Nov Different baselines

CoreWeave shows how falling share prices can feed back into funding. The company forecasts 2026 capex of up to $39 billion against debt of about $50 billion (Reuters), and recorded free cash flow of roughly -$13.66 billion over the twelve months to 30 June (Trefis). Free cash flow is the cash left after running the business and paying for investment; when it is negative, the company depends on outside money.

Its 2032 bonds yielded above 16% today (CNBC). A lower share price makes raising equity harder, and higher yields make debt dearer.

CoreWeave debt concerns surfaced in the bond market before the equity selloff, with credit default swaps and facility lease structures flagging financing stress well ahead of the share price.

Understanding this sequence lets you see whether the stress is staying inside AI equities or spreading into credit. That spread is the point at which a correction starts to look like a cascade.

Cascade or contained correction? What history and strategists say

The bearish case and the contained case both have evidence. History is the best arbiter, though no precedent fits cleanly.

Episode Pattern Relevance Limits
2000-02 tech bust Extreme tech valuations unwound over years High multiples, uncertain returns Prolonged reset, not a one-day shock
2008 financial crisis Deleveraging and collapsing credit fed each other Strongest cross-asset cascade precedent No comparable banking insolvency now
2022 rate shock Rising rates compressed tech valuations Financing costs matter for AI assets Driven by rates, not bank failure
2020 Covid crash S&P 500 fell more than 30%, then rebounded One-day volatility, retail behaviour Discrete catalyst, fast policy support
November 2026 Concentrated AI liquidation, rising neocloud yields Mechanism looks familiar Credit transmission not yet shown

Named strategists split along the same line:

  • Shane Oliver, AMP: a correction is more likely than a bear market if the economic outlook holds.
  • Michael O’Rourke, JonesTrading: the question is whether data-centre construction slows, with the trade exposed to financing concerns.
  • Mark Hackett, Nationwide: hedge funds have deleveraged in semiconductors and neoclouds for weeks.
  • Sameer Samana, Wells Fargo Investment Institute: flags policy discontinuity and how quickly AI spending turns into profit.
  • Reuters columnists Kemp and McGeever: a complete AI-capex bust is unlikely, but spreading credit stress could make it serious.

The forecasting tools have limits too. Market cap to GDP is a valuation gauge, not a timing signal, and it can stay high for years. A 200-day moving average describes price; it does not cause it. A 50% retracement is a scenario with no timing or catalyst attached.

So far there is no evidence of a broad recession, banking crisis or economy-wide earnings collapse. The open question is whether stress spreads from CoreWeave-style borrowers to hyperscalers, banks or broad funding markets. For your own decisions, that spread matters more than the size of the drawdown.

Three signals to watch before calling this a cascade

McGlone’s thesis is mechanically plausible: leverage, systematic selling, crypto liquidation and AI financing can all feed one another. The evidence so far supports a severe, concentrated AI-led correction rather than a confirmed economy-wide crisis. These are the signals that would separate the two:

  • Credit spreads and neocloud bond yields: watch whether stress moves beyond CoreWeave-style borrowers.
  • Bitcoin and copper levels: a sustained hold below $80,000 and $6.40 per pound would strengthen McGlone’s case.
  • Earnings and data-centre demand: firm results would point towards containment.

Private credit stress, including gated redemptions and wide discounts to stated NAV, is one of the channels through which equity weakness could reach funding markets.

This is an analysis of one strategist’s thesis, not a forecast or personal financial advice.

This article is for informational purposes only and should not be considered financial advice. Investors should conduct their own research and consult with financial professionals before making investment decisions.

Frequently Asked Questions

What is an equity selloff cascade?

An equity selloff cascade is a chain of forced selling in which each stage pushes the next: fundamental repricing, credit stress, hedge-fund deleveraging, systematic selling, margin calls and crypto liquidation. A one-day drop becomes a cascade when stress spreads from stocks into credit and funding markets.

What signals show a market correction is turning into a cascade?

The article points to three signals: credit spreads and neocloud bond yields spreading beyond CoreWeave-style borrowers, Bitcoin holding below $80,000 and copper below $6.40 per pound, and weak earnings or data-centre demand. Firm earnings would point to containment instead.

What is the Buffett indicator and why do its readings differ?

The Buffett indicator compares total stock market value with the size of the economy. StockDoz put it near 204.6% on 3 November while FinanceBuzz reported about 290%, so the gap comes from different data series and methods, and it works as a valuation gauge rather than a timing signal.

Why did CoreWeave's bond yields matter in the November 2026 selloff?

CoreWeave's 2032 bonds yielded above 16%, which signals expensive borrowing for a company forecasting up to $39 billion of 2026 capex against about $50 billion of debt. Falling shares and rising yields squeeze funding on both sides, which is how equity weakness can feed credit stress.

Does the evidence support McGlone's cascade thesis so far?

The evidence supports a severe, concentrated AI-led correction rather than a confirmed economy-wide crisis. There is no sign yet of a broad recession, banking crisis or economy-wide earnings collapse, and credit transmission beyond AI borrowers has not been shown.

John Zadeh
By John Zadeh
Founder & CEO
John Zadeh is an investor and media entrepreneur with over a decade in financial markets. As Founder and CEO of StockWire X and Discovery Alert, Australia's largest mining news site, he's built an independent financial publishing group serving investors across the globe.
Learn More

Breaking ASX Alerts Direct to Your Inbox

Join +20,000 subscribers receiving alerts.

Join thousands of investors who rely on StockWire X for timely, accurate market intelligence.

About the Publisher