Gold has lost roughly 31% of its value since January 2026, falling from a record $5,595 an ounce to about $3,876 at the end of October. Silver dropped nearly 60% over the same stretch. Most investors still describe gold as a shelter, but its recent price action looks nothing like one, and that gap sits at the centre of any honest gold price outlook right now.
On 6 November 2026, gold trades near $4,072. October payrolls came in at +165,000, far above expectations, and futures markets now price a December Federal Reserve rate hike at roughly 75-77%.
Bloomberg Intelligence senior commodity strategist Mike McGlone has a blunt reading of all this. He argues precious metals are now volatile risk assets, oil is heading toward $50, and US Treasuries are the safer place to park money.
Here is a framework for testing that view across gold, oil and rate expectations, including the places where the evidence pushes back hardest.
Has gold stopped being a safe haven and become a risk asset?
The scale of the fall is the first thing to absorb.
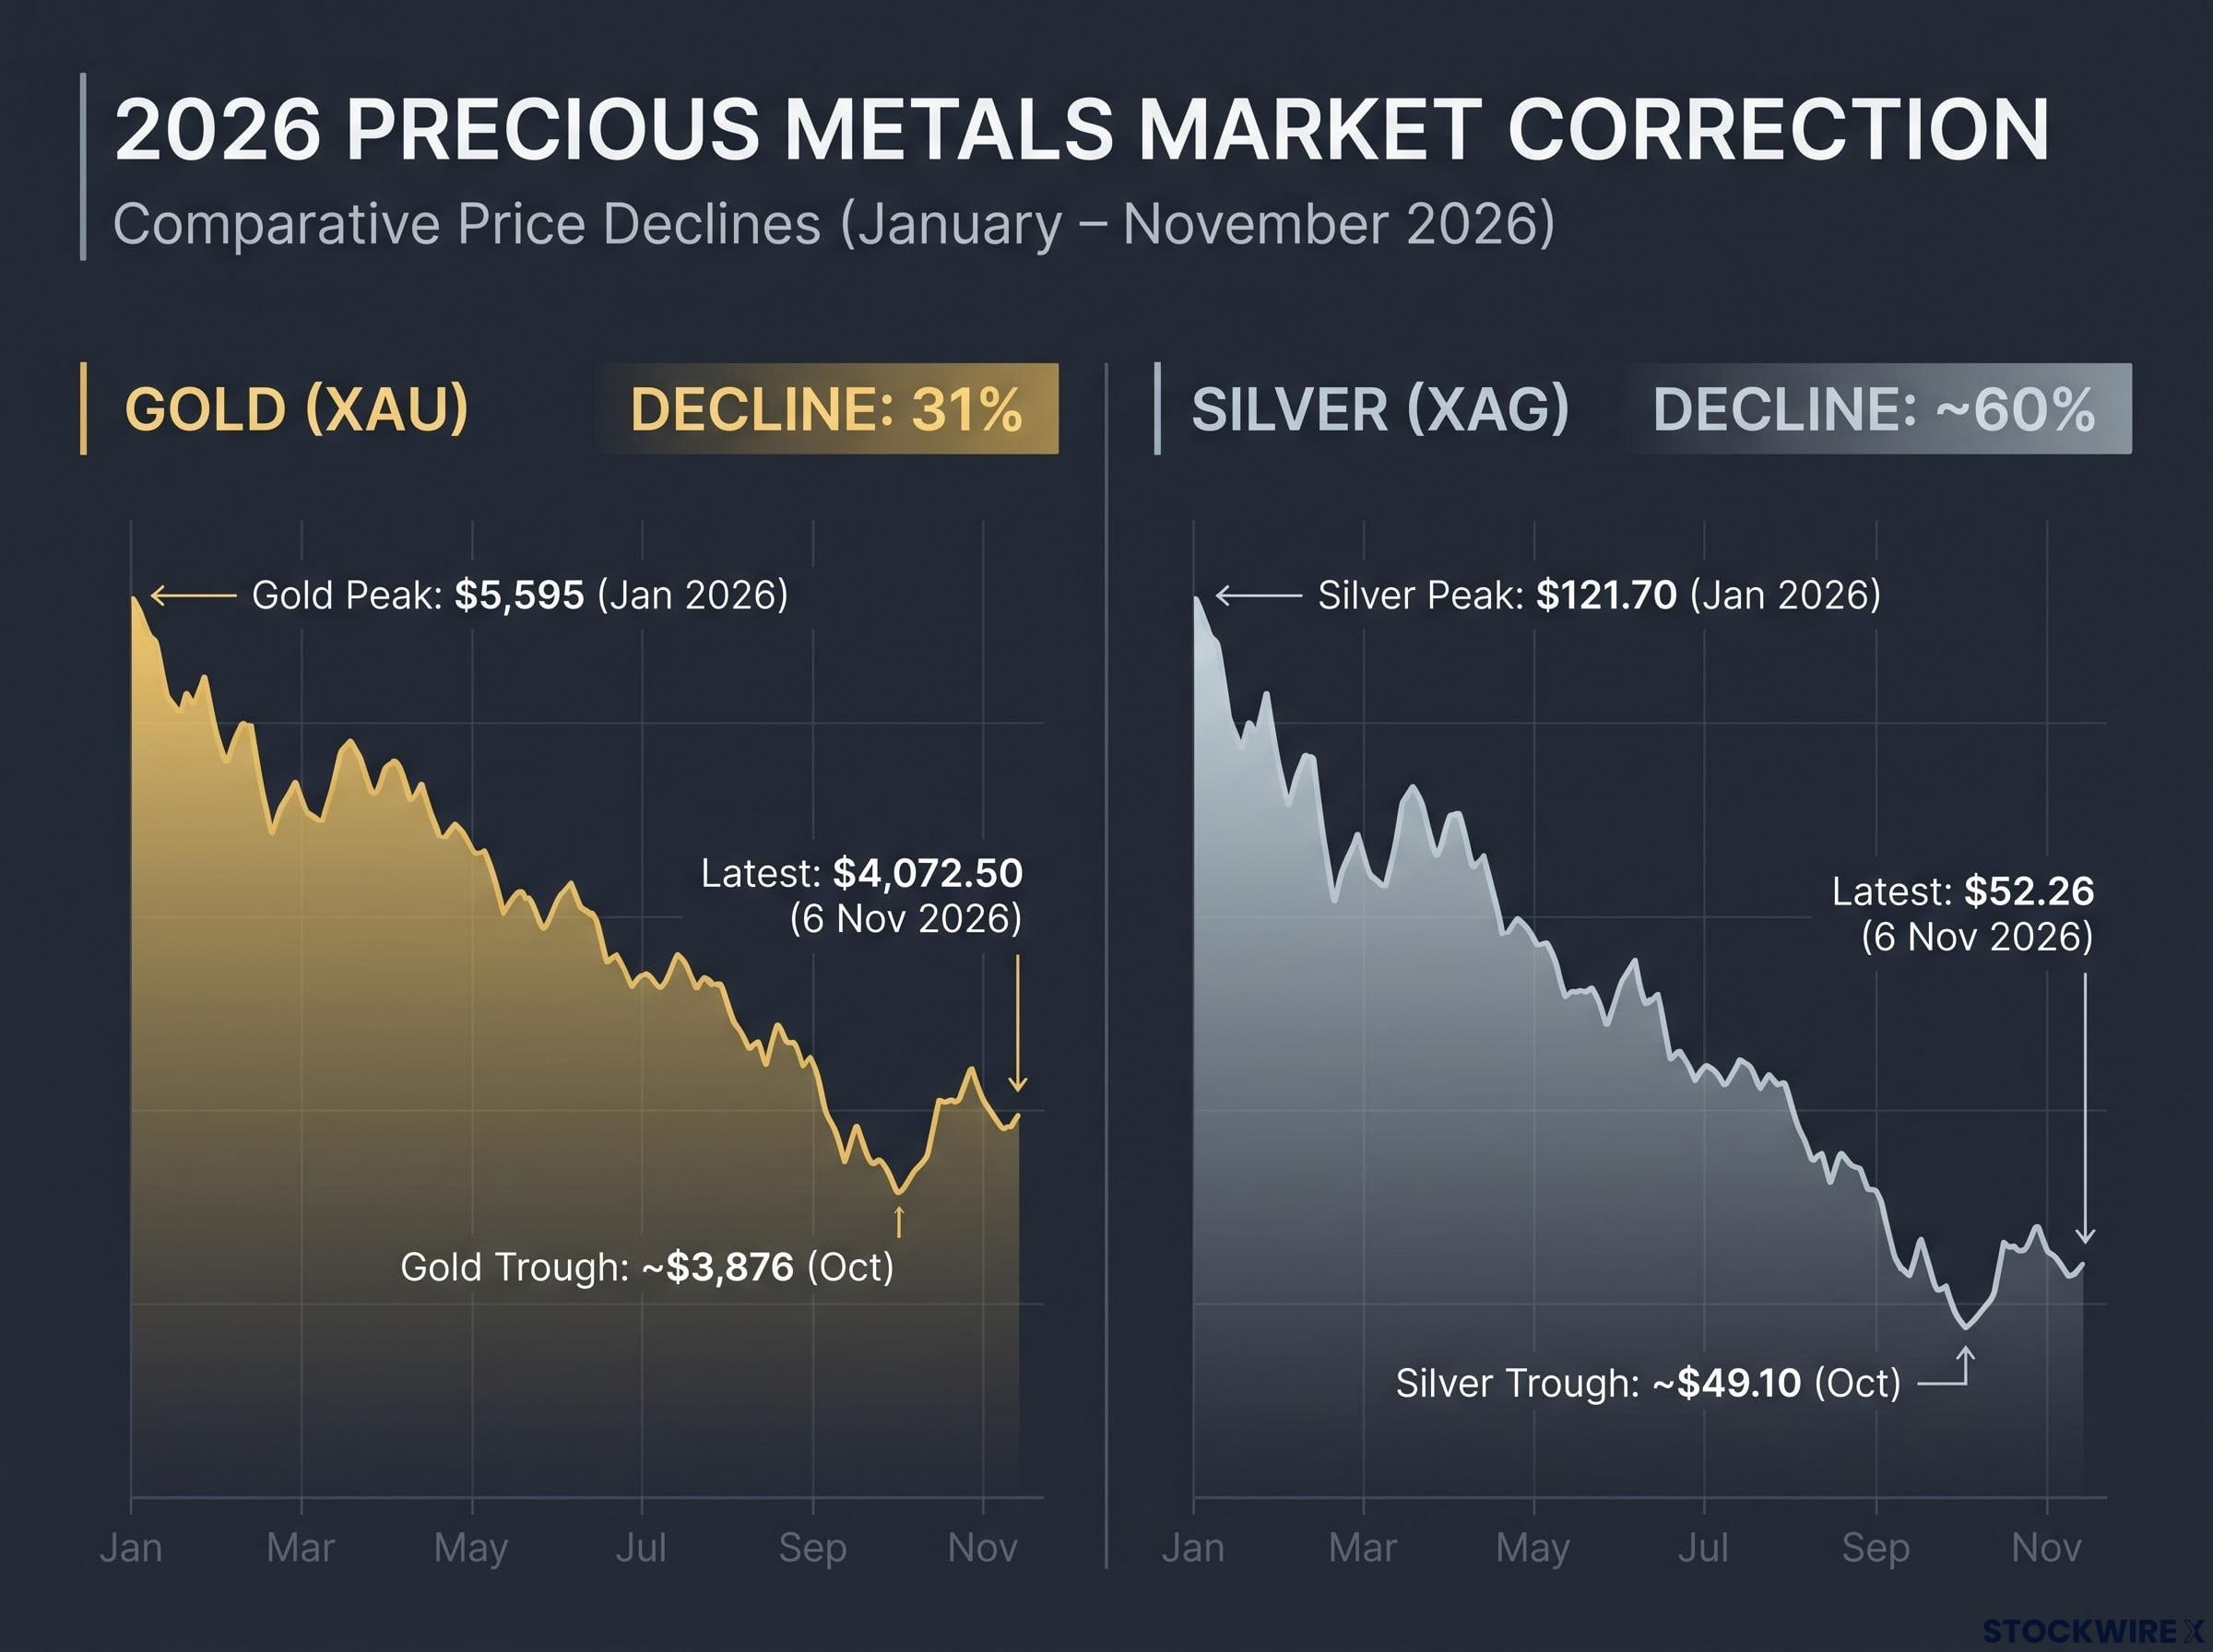
Gold fell 31% from its $5,595 January peak, while silver plummeted ~60% from $121.70, reflecting highly volatile risk-asset behavior.
| Metal | Latest (6 Nov 2026) | Peak | Trough (Oct month-end) | Decline |
|---|---|---|---|---|
| Gold | $4,072.50 | $5,595 (28 Jan 2026) | About $3,876 | About 30.7% |
| Silver | $52.26 | $121.70 (Jan 2026) | About $49.10 | About 59.6% |
McGlone says both metals now carry higher volatility and a stronger correlation with equities than with bonds. In practice, that means they would likely fall harder if stocks sold off. By his measure, gold’s volatility runs at about twice that of the S&P 500, and he has dropped his earlier bullish stance in favour of selling rallies and buying dips.
McGlone’s verdict Gold and silver now behave as trading vehicles rather than safe investments, and Treasuries are the better home for capital you want to protect.
The wider analyst field complicates that verdict without overturning it.
| Source | View | Reasoning |
|---|---|---|
| Goldman Sachs | End-2026 cut to $4,150 (from $4,650); end-2027 to $4,800 (from $5,400) | More hawkish Fed, weaker positioning; still constructive longer term |
| World Gold Council | Central banks bought 321 tonnes in Q3, up 42% year on year | 675 tonnes bought year to date |
| State Street Global Advisors | 60% base-case range of $4,500-$5,250 | Next $1,000 move more likely higher in 2027 |
| Saxo Bank (Ole Hansen) | Silver could reach the mid-$40s | Continued systematic and technical selling |
| Commerzbank | Medium-term silver recovery | Panic selling viewed as excessive |
Goldman’s cuts and the central-bank buying sit side by side. “Risk asset” describes the short run accurately; it says much less about the long run.
Gold’s safe-haven record is conditional rather than absolute: it fell sharply in March 2020 and March 2026 alongside equities, because forced liquidation, rising real yields and a strong dollar can override defensive demand depending on crisis type.
What the bearish case needs to be true
Real yields (bond returns after inflation) and the US dollar keep rising, central banks stay restrictive, and leveraged investors keep liquidating positions.
What the bullish case needs to be true
Rate hikes damage growth, yields fall, the Fed eventually cuts (Goldman assumes late 2027 or 2028), and official-sector buying absorbs private selling.
What this tells you is that gold’s path over the next year hinges on real yields, the dollar and Fed expectations far more than on its safe-haven label. Size your position as you would any volatile asset. Past performance does not guarantee future results, and forecasts are subject to market conditions and various risk factors.
When big ASX news breaks, our subscribers know first
What do post-parabolic cycles and the gold-to-bond ratio actually tell you?
McGlone’s argument rests on two tools: the shape of the rally and the ratios that measure it against other assets.
How a parabolic move unwinds
A parabolic advance is a price rise that accelerates until the chart turns almost vertical. These moves usually run on momentum and borrowed money, which is why the aftermath tends to last years rather than weeks.
The typical sequence runs in three stages:
- Blow-off: buying accelerates into a final, near-vertical peak.
- Violent liquidation: leveraged holders are forced to sell, and prices collapse quickly.
- Long range-bound repair: prices drift sideways while excess positioning clears.
Gold in 1980 is the case McGlone leans on. It peaked near $850 in January 1980, slid to about $250 by 1999, and only reclaimed that high in 2008. Economist Mark Skousen, speaking to Kitco, points to 1980 as proof that rising real rates and a stronger dollar can end a parabola, and he regards roughly $50 as an important floor for silver.
| Precedent | What happened | Relevance |
|---|---|---|
| Gold after 1980 | Fell from about $850 to about $250 by 1999 under Volcker tightening | Strongest bearish precedent, but central-bank demand is far larger today |
| Gold in 2008 | Fell about 35% in forced liquidation, then rose after Fed easing | Falling yields can reverse a slump quickly |
The contrast matters. In 1980, then Fed chair Paul Volcker pushed real yields sharply higher and the dollar strengthened. Today’s market has official buyers absorbing hundreds of tonnes a quarter.
Analysts argue the old inverse link between gold and real yields has weakened since 2022-2023, partly because central-bank gold accumulation and doubts over policy credibility now put a floor under demand that earlier tightening cycles never had.
Reading the ratios without over-trusting them
McGlone says the gold-to-bond ratio is at its lowest since 1987 and may be bottoming. He also says metals and the Bloomberg commodity index sit near four-decade highs against Treasuries.
Two calculations help you see this yourself. Gold divided by the 10-year Treasury yield gives about 841; that is a valuation-style calculation, not a standardised published ratio. The gold-to-oil ratio, a more conventional published measure, works out at about 42.4 barrels of WTI per ounce.
An extreme ratio or a vertical chart tells you risk is elevated, not when the turn arrives. Use them to inform position sizing, not to time entries.
Can oil really fall toward $50 when it trades near $96?
That same post-parabolic logic drives McGlone’s oil call, and the gap with today’s prices is wide. On 3 November 2026, WTI settled at $96.09 and Brent at $103.60.
His case rests on four drivers:
- Americas supply: the IEA raised its 2026 Americas supply-growth estimate to about 1.5 million b/d, more than 600,000 b/d above its earlier figure.
- OPEC+ output: the producer group is unwinding voluntary cuts.
- Weaker demand: the IEA’s September report forecast a 2.5 million b/d fall in 2026 demand.
- EV substitution: electric vehicles and efficiency gains erode fuel demand.
McGlone calls the energy shock temporary and cites Volkswagen’s roughly 100,000 layoffs and US tariffs on Chinese EVs as deflationary signals. He also points to oil’s 2008 path, from about $147 in July to about $32 by December.
The balance data is less tidy.
| Source | Date | 2026 balance | 2027 balance |
|---|---|---|---|
| IEA | August 2026 | Surplus of nearly 4 million b/d | Not stated |
| IEA | October 2026 | Deficit through year-end | Not stated |
| EIA | October 2026 | Deficit of 1.34 million b/d | Surplus of 4.91 million b/d |
McGlone’s cited surplus of nearly 9 million b/d is not supported by IEA or EIA figures. The agencies shifted their views as Middle East production and shipping assumptions changed.
What would delay the surplus
Attacks on infrastructure, blocked shipping through the Strait of Hormuz, sanctions or a prolonged US-Iran confrontation could all keep Brent well above $50.
How quickly any surplus arrives depends partly on Hormuz bypass routes, which cover only a fraction of the strait’s normal throughput and explain why a sustained closure would still point to a very different price range.
That makes $50 a surplus-and-normalisation scenario for 2027 and beyond. Do not treat it as a near-term target when judging your energy exposure or inflation expectations.
Could markets force the Fed to cut after a hike?
Oil’s path feeds inflation, and inflation feeds the Fed. Here, McGlone holds two ideas at once: don’t fight a Fed that is priced to hike, yet expect markets to force cuts later.
The chain runs in five stages:
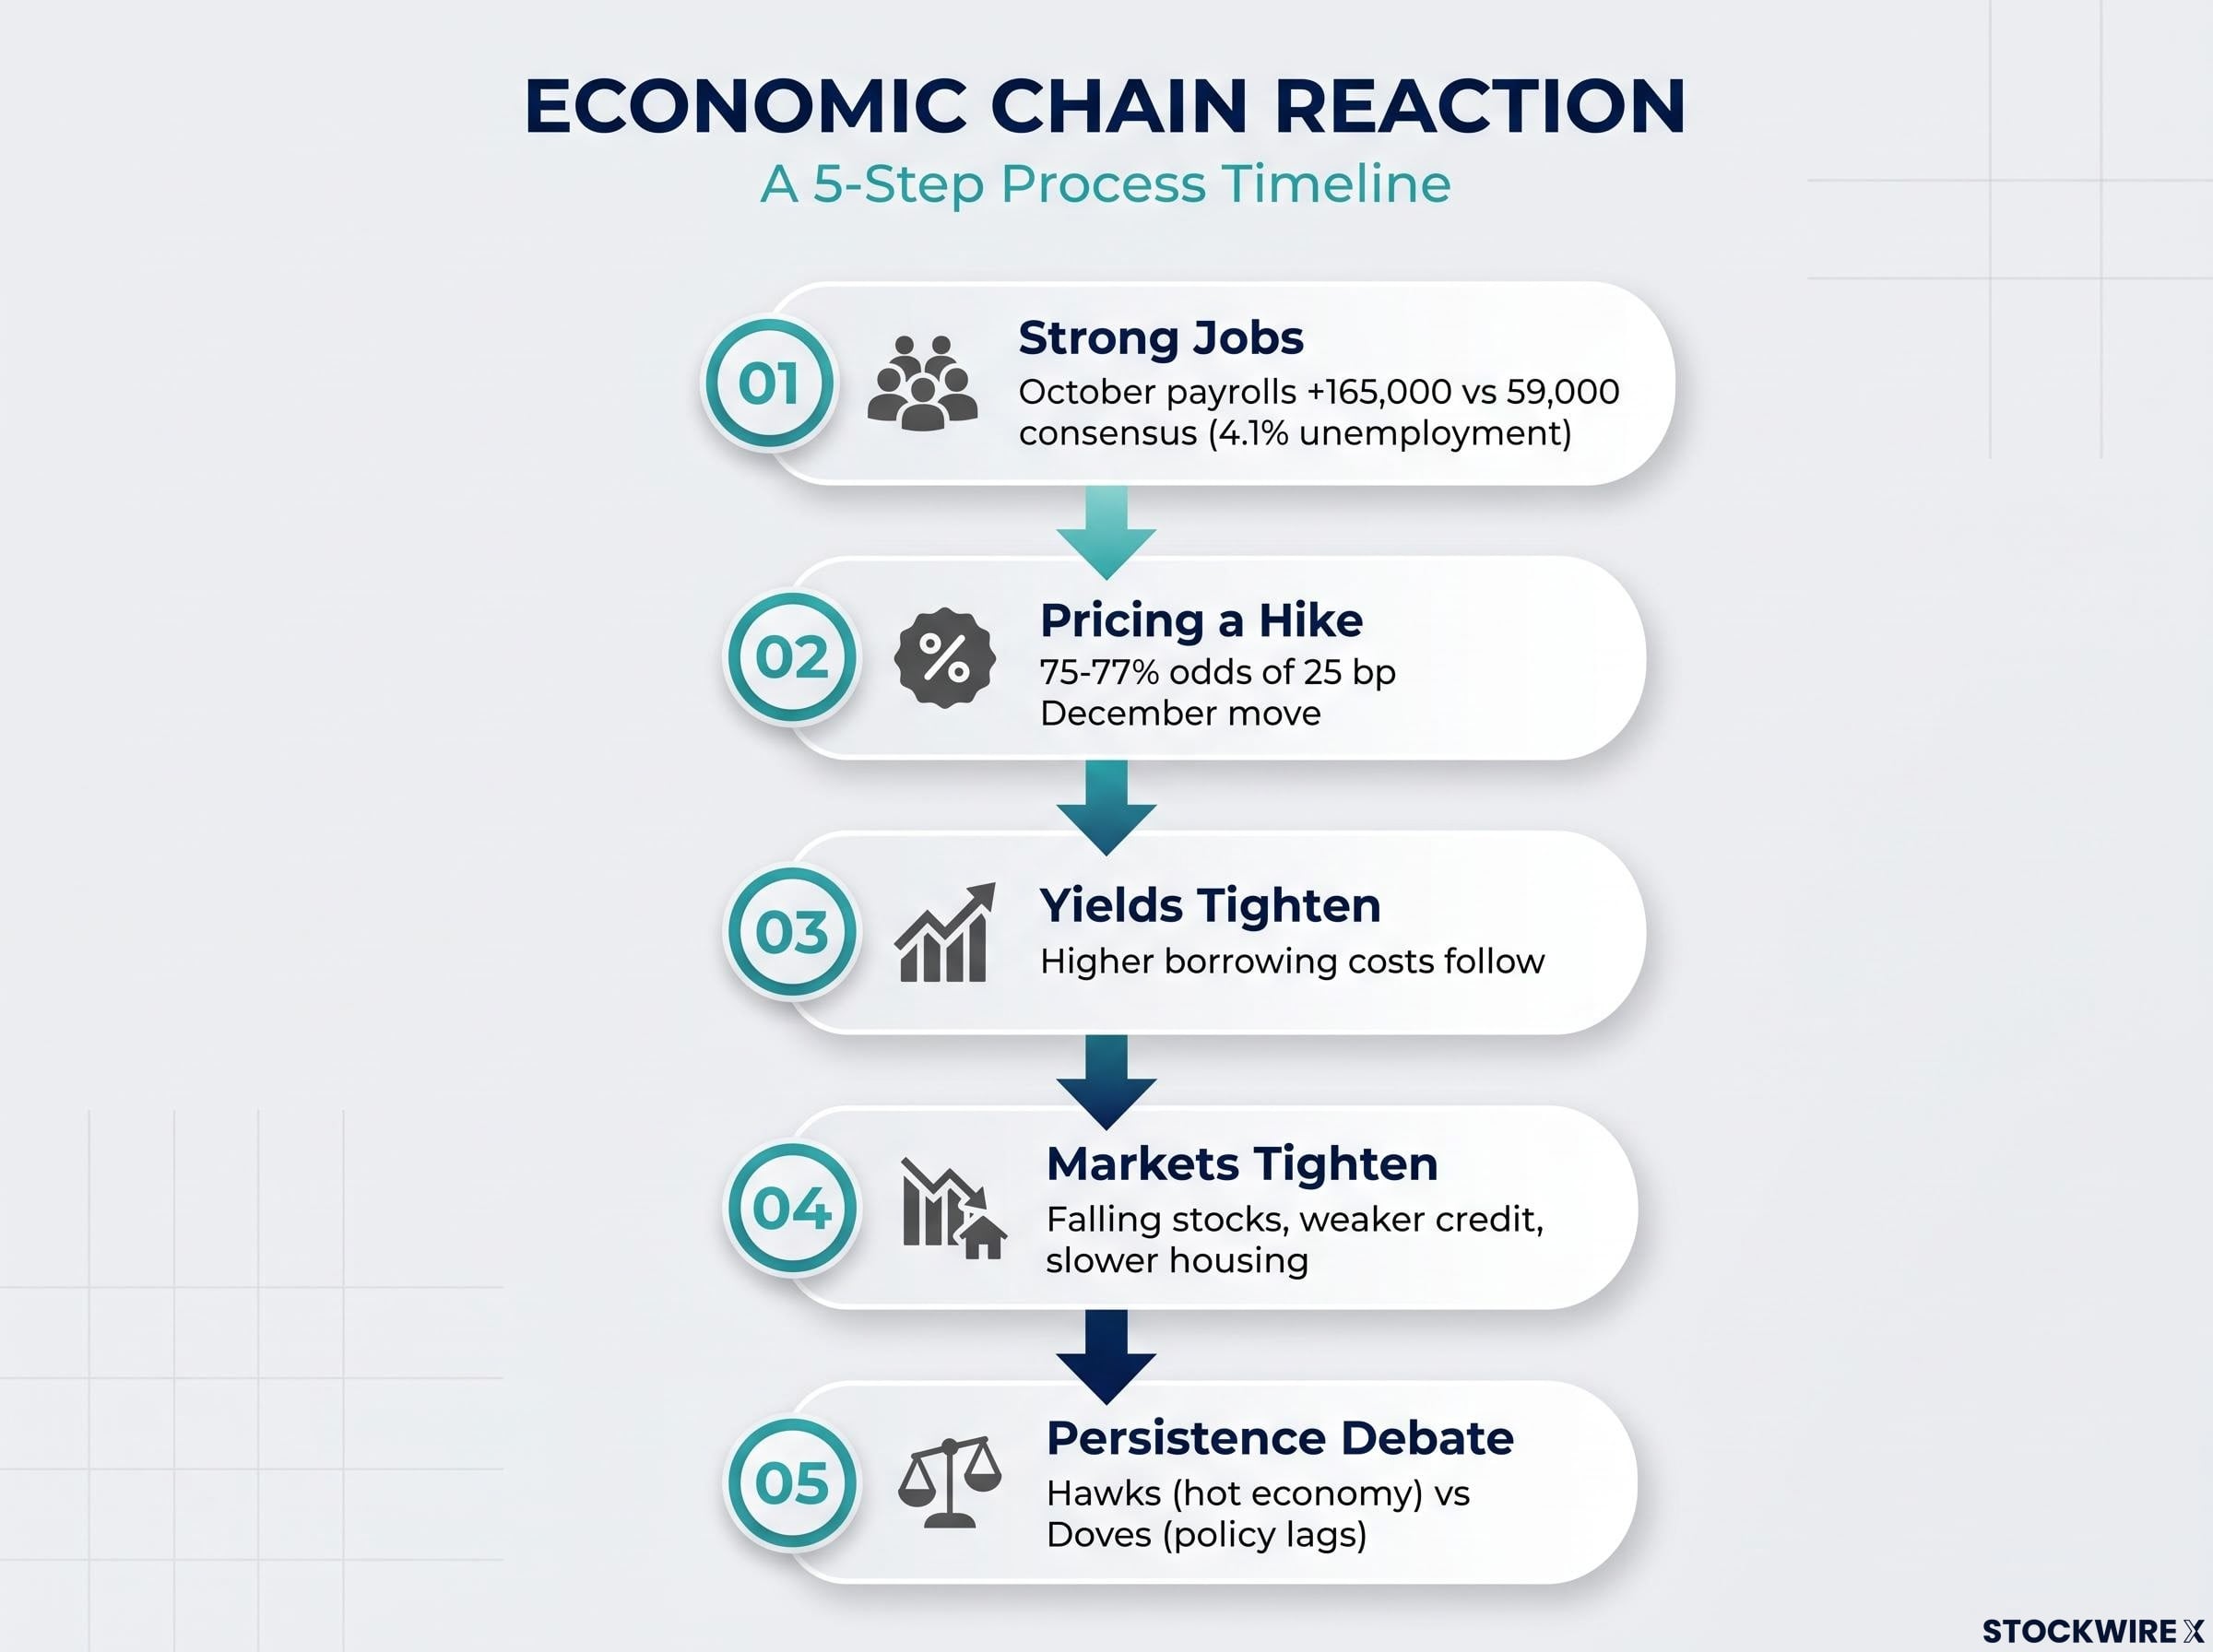
Strong October payrolls of +165,000 drove markets to price in 75-77% odds of a 25 bp December rate hike, triggering a 5-stage reaction.
- Strong jobs raise policy concern: payrolls rose 165,000 in October against a consensus near 59,000, with unemployment at 4.1% (BLS).
- Markets price a hike: CME FedWatch shows about 75-77% odds of a 25 bp December move.
- Yields tighten conditions: higher borrowing costs, mortgage rates and lower equity valuations follow.
- Markets tighten before the Fed cuts: falling stocks, weaker credit and slower housing curb demand.
- The persistence debate: hawks see a hot economy; doves point to long policy lags.
“A blowout jobs report.” Angelo Kourkafas, Senior Investment Strategist, Edward Jones
| Indicator | Latest | Date |
|---|---|---|
| CPI (y/y) | 3.7% (+0.6% m/m, core +0.3%) | September 2026 |
| 5-year Treasury | 4.59% | 5 Nov 2026 |
| 10-year Treasury | 4.84% | 5 Nov 2026 |
| 30-year mortgage | 7.18% | 5 Nov 2026 |
| 15-year mortgage | 6.57% | 5 Nov 2026 |
McGlone treated the 5-year yield’s 5.15% peak on 15 October as a signal to favour bonds. If equities tighten further, he foresees a series of 50 bp cuts, and he suggests CPI could reach zero or turn negative next year. Those are his views, not consensus.
This is where gold and Treasuries split. Rising yields hurt gold now; a forced pivot to cuts would lift both bond prices and, eventually, gold. The October CPI release on 10 November and equity and credit conditions matter more for your view than the jobs headline, because they show whether strength is durable or lagging.
Weighing the gold price outlook against rates, oil and the next data points
Gold’s near-term path is tied to real yields and Fed expectations, not to its reputation. Oil at $50 is a conditional scenario, and Treasuries are McGlone’s preferred refuge.
Three variables will test the thesis next:
- October CPI on 10 November: confirms or eases inflation pressure.
- The December Fed decision: a hike versus a pause resets real yields.
- Middle East supply news: decides whether any oil surplus arrives on schedule.
History offers mechanisms, not forecasts, and steady central-bank buying keeps the long-run case for gold alive. Watch how each data point moves real yields, and let that guide how much volatility you are prepared to hold.
One practical way to track the inflation side of this chain is TIPS breakeven inflation: a widening gap between nominal and inflation-linked yields tends to support gold, while a narrowing one flags that the tailwind is fading.
This article is for informational purposes only and should not be considered financial advice. Investors should conduct their own research and consult with financial professionals before making investment decisions.