WTI crude is heading for a weekly loss of roughly 12%, yet it has just posted a second straight daily gain and climbed back above $90. A bounce like that can look like a change of heart. The evidence suggests it is something narrower.
The WTI crude oil price recovered from a trough near $86 this week as US-Iran signals, a Democratic sweep of Congress and fresh tanker attacks in the Strait of Hormuz pulled sentiment in opposite directions. Each headline has shifted the odds of a long war, and the market has repriced those odds within hours.
Another trigger arrives later today. The US Nonfarm Payrolls report could add a fresh round of volatility to a market already moving on every statement from Washington and Tehran.
Here is how to separate the geopolitical premium from the underlying supply and demand picture, and where the chart levels that matter sit right now.
Why did the WTI crude oil price fall 8% and then bounce back above $90?
The week began with diplomacy and ended with fire. The order of events explains most of the price path.
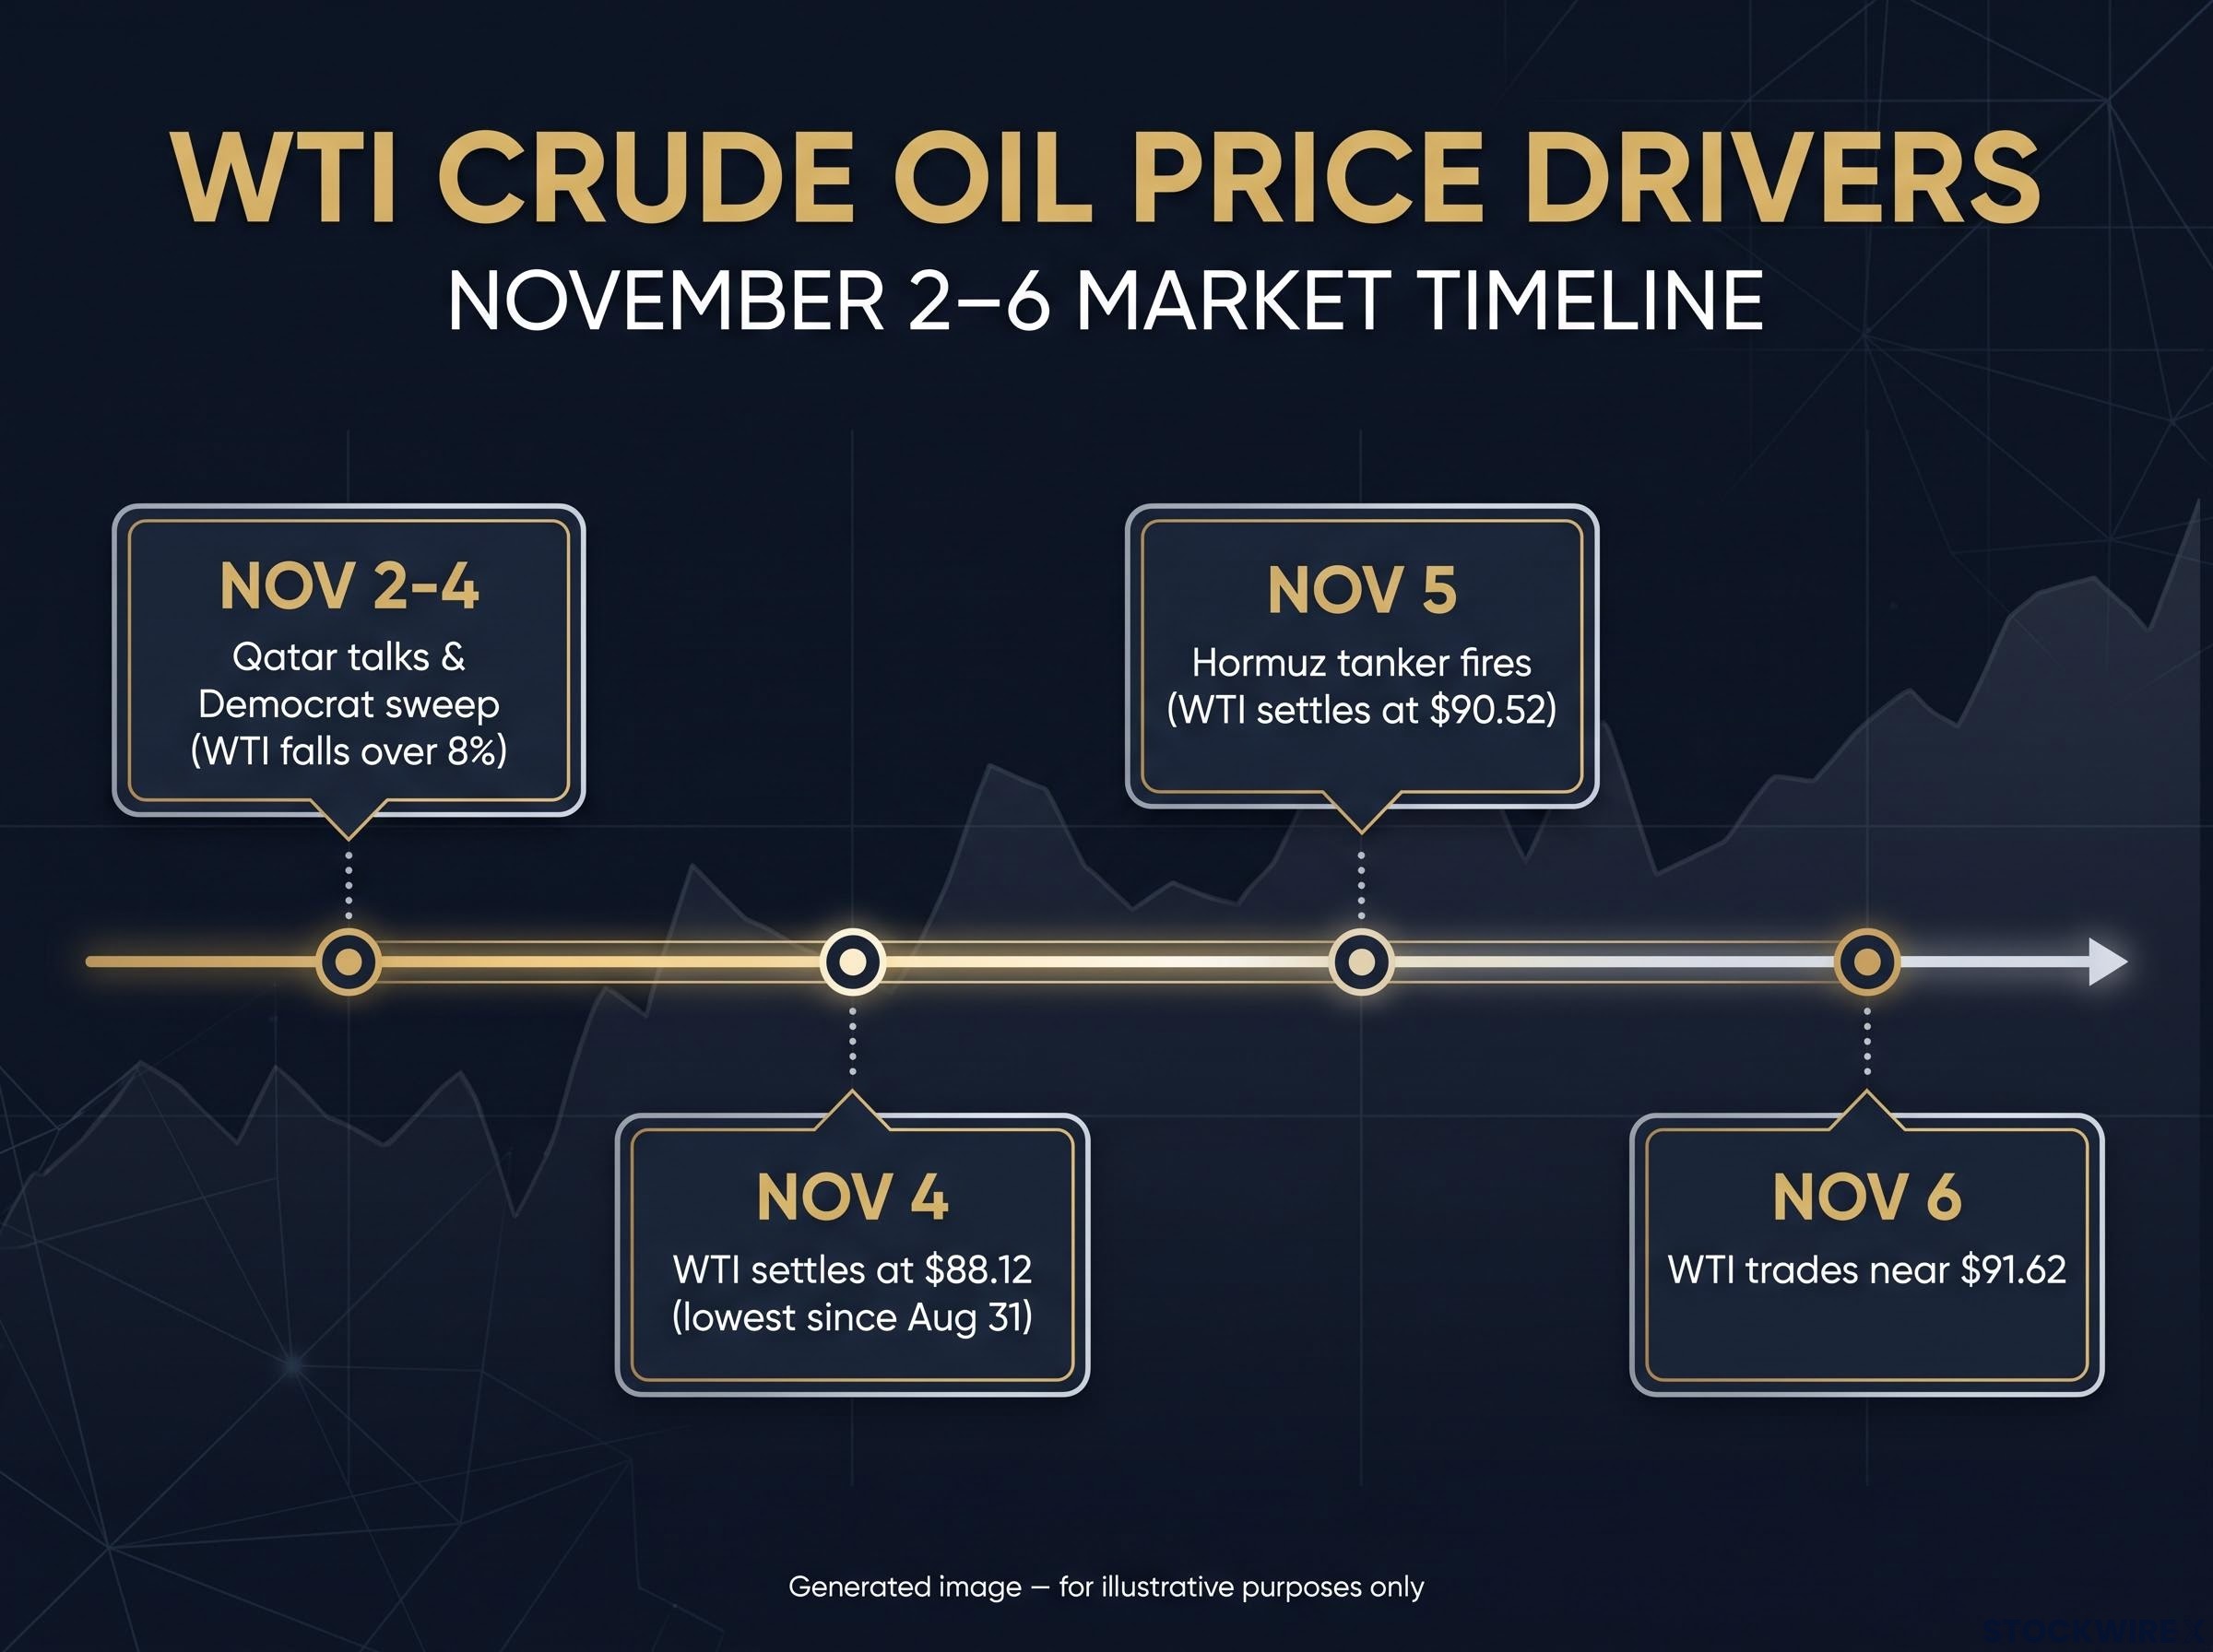
- 2-4 November: Qatar-mediated talks end without a breakthrough. Democrats win control of Congress, and WTI falls more than 8% across the sell-off.
- Wednesday 4 November: WTI settles at $88.12, its lowest settlement since 31 August, after touching a low near $86.
- 5 November: Iran reports tanker fires in Hormuz. WTI settles at $90.52, up $2.40 or 2.72% (Reuters).
- 6 November: WTI trades near $91.62, up 1.22% intraday (Reuters via U.S. News), while FXStreet describes a gain of about 0.50% just above $90.00.
Diplomacy and politics
The talks centred on a reported proposal to end the US blockade, reopen Hormuz, allow Iranian oil sales and ease sanctions, according to Reuters. Iranian officials said the two sides remained far apart, and the dispute over Tehran’s nuclear programme remains unresolved.
The Democratic sweep then changed the clock. Senate Democratic leader Chuck Schumer said Democrats would push for a rapid end to the Iran war, potentially using Congress’s control over government funding as leverage.
What the sell-off actually priced Reuters market coverage framed the fall as a lower expected probability of prolonged war, not any improvement in how much oil could physically reach buyers.
President Trump’s post-election remarks eased fears of immediate strikes. On Thursday he also said the US might need to wipe out what remains of Iran, leaving traders holding two incompatible readings at once.
Shipping and tanker attacks
Then the physical risk came back into view. Iran reported that two oil tankers and a tugboat caught fire after attempting unauthorised routes through the Strait, and later reported three more damaged tankers (Reuters, 5 November).
That matters because Hormuz previously carried about one-fifth of global crude and gas supplies, according to Reuters. Sources differ on current flows: FXStreet says they have recovered, while Reuters describes traffic as sharply reduced. Both agree shipping risk persists.
What this tells you is that the entire swing came from expectations, not barrels. The rebound is a repricing of risk, so you should treat headline-driven moves as fragile in both directions.
When big ASX news breaks, our subscribers know first
How does a geopolitical risk premium work in the WTI crude oil price?
You have just watched the price drop on talk and rise on fire. That pattern has a name.
A geopolitical risk premium is the extra price traders pay for the possibility that future barrels will be delayed, destroyed or made inaccessible. It builds through freight costs, insurance costs and precautionary buying, where refiners hold extra stock in case supply tightens. This week showed five channels at work:
- Physical-flow risk: Tanker fires in Hormuz pushed buyers to bid harder for alternative barrels.
- Probability over confirmed loss: Prices rose on attacks before any export data showed a decline.
- Diplomacy removing expected scarcity: Talk of reopening Hormuz drained premium in the 2-4 November sell-off.
- Political shifts changing war duration: The Democratic sweep and Schumer’s funding stance encouraged pricing of faster negotiations.
- Contradictory signals creating volatility: Trump eased strike fears without guaranteeing de-escalation, while Tehran said talks had stalled.
Lessons from June 2025
The Israel-Iran conflict of June 2025 offers a recent precedent. Brent rose from below $70 to about $81.40 after the conflict and US strikes, then fell to roughly $67 once Trump announced a ceasefire.
WTI dropped about 6% on the ceasefire announcement alone and recovered only modestly. The premium disappeared as soon as traders judged infrastructure and shipping routes safe.
An earlier US-Iran peace framework showed the same binary dynamic, with a confirmed breakthrough judged capable of unwinding a large slice of risk premium in a single move.
That gives you a reusable test. When oil rallies, ask whether tighter physical indicators back the move, or only fear.
Where are the key technical levels for WTI: 200-day SMA, Fibonacci and resistance?
With the premium understood, the chart shows where it is likely to meet buyers and sellers. FXStreet’s technical analysis gives WTI a constructive bias while it holds above the 200-day simple moving average (SMA), which is the average closing price over the past 200 trading days, and the 38.2% Fibonacci retracement. A Fibonacci retracement marks levels where a pullback from a prior move has historically tended to pause, based on fixed ratios of that move.
| Level | Price | Role | What it signals |
|---|---|---|---|
| Cycle high anchor | $104.09 | Distant resistance | Longer-range bullish target |
| 23.6% Fibonacci | $95.31 | First resistance | Next hurdle for the rebound |
| 38.2% Fibonacci | $89.88 | Support (former resistance) | Holding it keeps the bias constructive |
| 200-day SMA and 50% retracement | $86.10-$85.49 | Deeper support band | Where buyers are expected on a sharper pullback |
The $89.88 level has flipped. It capped price on the way up, and now that WTI has moved through it, the same level acts as a floor.
Above, $95.31 is the first test, with $104.09 far beyond. Below, the $86.10-$85.49 band sits right where this week’s two-month low formed, so it has already been tested once.
Reference points, not forecasts Fibonacci zones and moving averages take no account of tanker attacks, diplomacy, inventory surprises or OPEC+ decisions. Markets can overshoot them when the physical outlook changes abruptly.
These levels tell you where reactions are likely. If WTI breaks below the $85.49-$86.10 band, read it as a sign that fundamentals have overridden the chart.
For readers wanting to pair support and resistance with weekly data, our full explainer on combining EIA data with WTI chart levels sets out a repeatable Wednesday routine.
What actually moves WTI crude: inventories, OPEC+ and the US Dollar
West Texas Intermediate (WTI) is a light, sweet crude, meaning it has low density and low sulphur, which makes it easy to refine. Sourced in the US, it is delivered at the Cushing hub in Oklahoma and sits alongside Brent and Dubai as one of three main global benchmarks. Because futures contracts settle at Cushing, stock levels there feed directly into WTI pricing.
Inventories
The American Petroleum Institute (API) publishes weekly stock estimates on Tuesdays, and the US Energy Information Administration (EIA) follows on Wednesdays. The EIA series is the official government figure and usually takes precedence, though the two land within 1% of each other about 75% of the time.
For the week ended 30 October, EIA commercial crude fell 865,000 barrels to 409.8 million, a fifth straight draw. API showed a larger drop of about 5.3 million barrels. The detail beneath the headline was mixed: Cushing rose 280,000 barrels to about 27.3 million, gasoline fell about 200,000 and distillates fell about 3.6 million.
OPEC+
OPEC+ kept December production targets unchanged and does not expect further adjustments until 2027, according to Reuters. About 2 million barrels per day (bpd) of cuts remain in place for most members through end-2026, after the group completed rolling back a 1.65 million bpd cut agreed in 2023. Targets are not output, so a freeze supports prices only if members actually comply and spare capacity is limited.
The US Dollar and demand data
The US Dollar Index sat around 101.722 on 6 November. A stronger dollar makes crude dearer for non-US buyers, though the link is not mechanical; in a severe geopolitical shock both can rise together.
The International Energy Agency (IEA) expects 2026 demand to fall by about 2.6 million bpd, with September supply near 102.3 million bpd, yet still sees balances tight through year-end. To tell genuine tightness from short covering, check for backwardation (near-term contracts priced above later ones), widening physical price differentials and rising freight or insurance costs.
| Driver | Latest reading | Normal reading of it | Caveat |
|---|---|---|---|
| EIA crude stocks | -865,000 barrels (5th draw) | Supportive | Cushing rose 280,000 barrels |
| OPEC+ policy | December targets unchanged | Floor under supply | Targets differ from actual output |
| US Dollar Index | 101.722 | Firmer dollar weighs on crude | Can move with oil in a shock |
| IEA balance | Tight through year-end | Supportive near term | 2026 demand seen 2.6 million bpd lower |
A fifth straight draw supports near-term prices. Before you call it a trend, weigh it against rising Cushing stocks and the IEA’s wider supply view.
Payrolls, scenarios and the horizon problem: what could move WTI next?
Those indicators frame the slower story. Today’s catalyst is faster.
The payrolls wildcard
Consensus for October payrolls is 65,000 jobs versus 29,000 previously, with unemployment at 4.2% and average hourly earnings up 0.3% month on month and 2.9% year on year, according to Futunn.
Neither outcome points cleanly in one direction. A strong print supports fuel demand but can lift yields and the dollar, while a weak one can soften the dollar yet signal slower demand. Watch the price reaction rather than assuming a direction.
Short-term premium versus long-term surplus
Forecasters disagree, but mostly about time. The IEA sees tight balances through year-end. ING’s 2026 outlook expects a sizeable surplus from rising OPEC+ supply and modest demand, while Goldman Sachs’s 2026 outlook puts average Brent near $56 and WTI near $52, assuming roughly 2 million bpd of oversupply.
A longer-run question is how much OPEC’s pricing power remains, given its share of global crude supply has fallen sharply and US output now acts as the dominant swing factor.
| Scenario | Likely price direction | Reasoning |
|---|---|---|
| Escalation | Bullish | Strikes, tanker damage or fuller Hormuz closure raise freight and insurance costs |
| Durable US-Iran deal | Bearish | Reopened shipping and Iranian exports remove much of the premium |
| Political pressure, no deal | Initially bearish, then volatile | Congress may constrain the war, but shipping risk lingers |
| Surplus and weak demand | Bearish | ING and Goldman expect supply growth and inventory builds |
| Further inventory draws | Moderately bullish | Tighter near-term US balances, though one report is not a trend |
| Strong or weak payrolls | Mixed | Dollar and demand effects pull in opposite directions |
These scenarios and forecasts are speculative and subject to change based on market developments. Past performance does not guarantee future results.
The rebound is best read as a partial restoration of the Hormuz premium. It is not proof that the bearish supply and demand outlook has gone.
What to watch after the rebound, and how to read the next move
The bounce restored part of the risk premium. Whether it holds depends on two checks: the chart levels and the physical data beneath them. Keep these on your list:
- Payrolls reaction: Whether crude follows the dollar or the demand signal.
- US-Iran talks and Hormuz incidents: The fastest route for premium to build or drain.
- Next EIA release: Whether the draws extend, and what Cushing does.
- $89.88 support and $95.31 resistance: The near-term range the market is testing.
- The $86.10-$85.49 band: A break suggests fundamentals have taken control.
If a rally arrives without backwardation, firmer differentials or tighter stocks, you are likely looking at fear rather than scarcity, and fear can reverse quickly.
This article is for informational purposes only and should not be considered financial advice. Investors should conduct their own research and consult with financial professionals before making investment decisions.