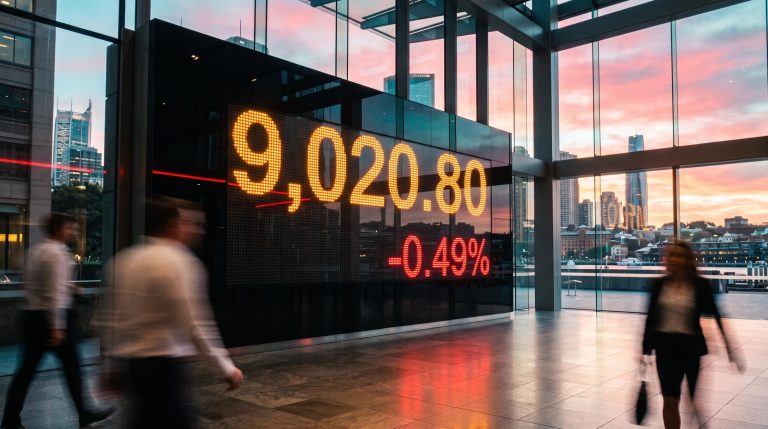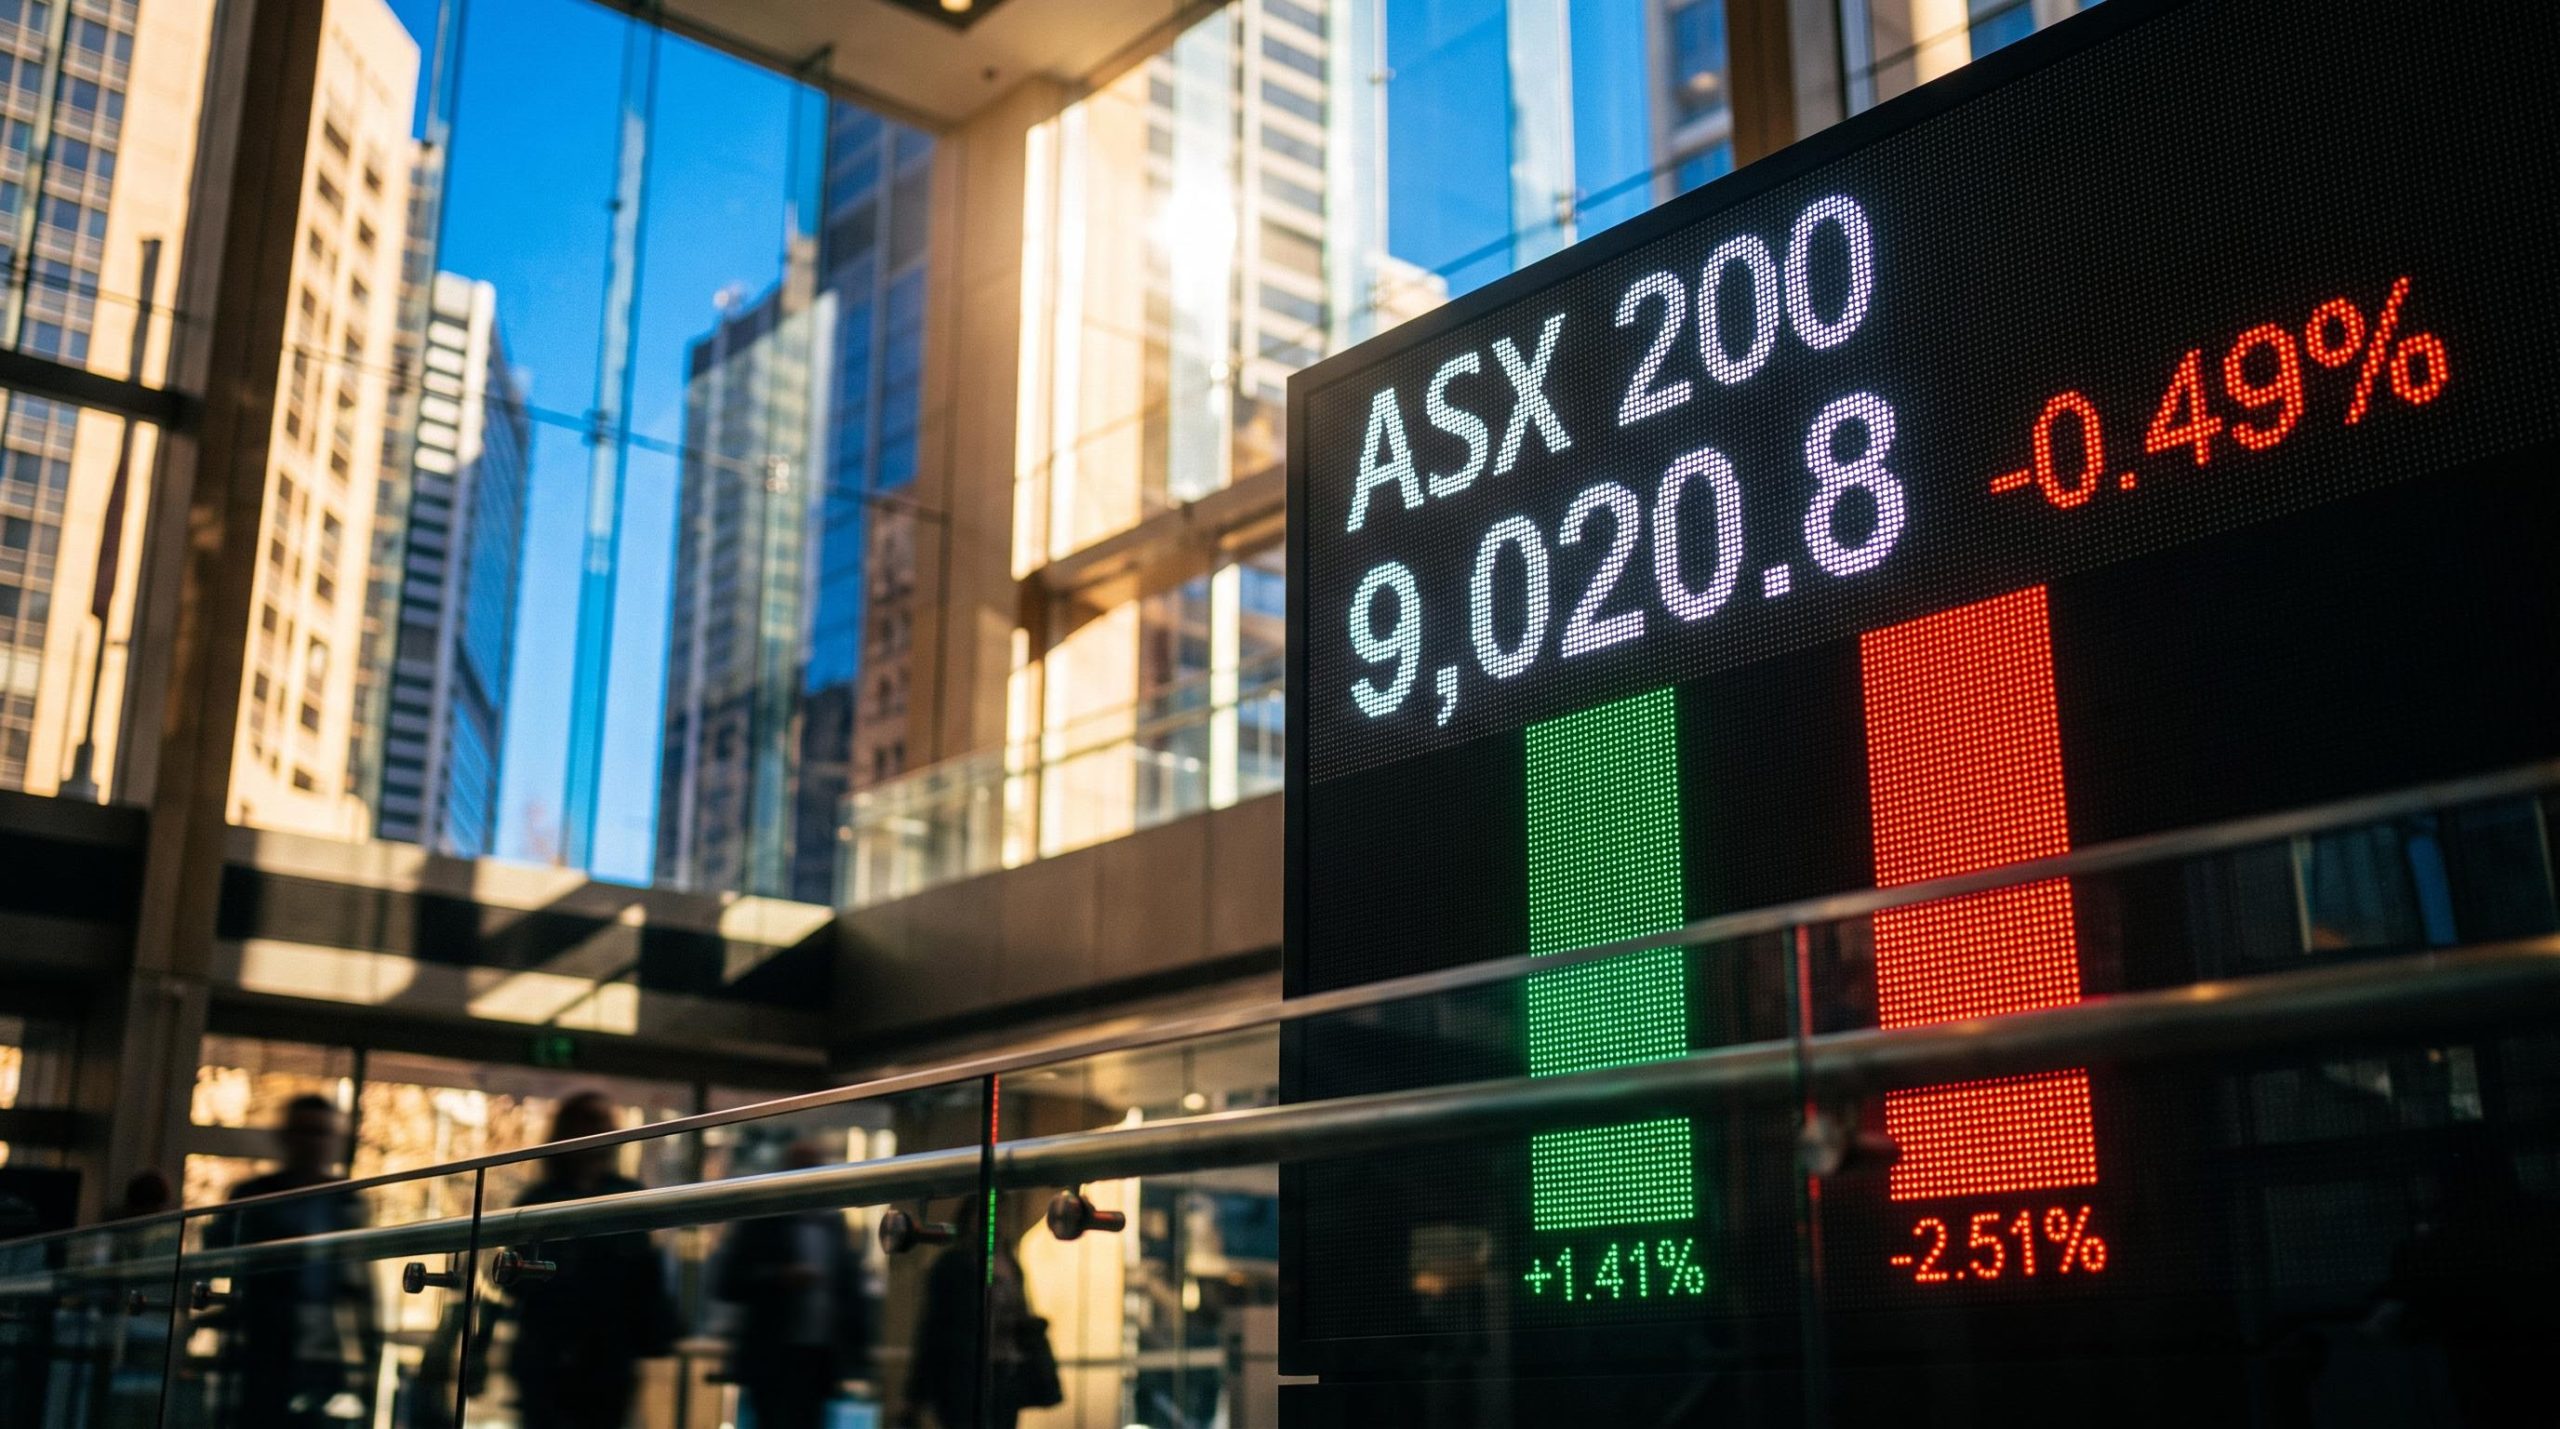
The ASX 200 today fell as much as 1.5% shortly after the open. By the close on Friday 6 November 2026 it had cut that loss to 0.49%, finishing at 9,020.8. That came after a US session in which the Nasdaq dropped 6.4% and semiconductor stocks lost 12%.
The headline number is the least useful figure from the session. It hides what actually moved underneath.
Materials fell 2.51% while consumer staples rose 1.41%. That gap is how a global shock reaches Australian portfolios: not as one uniform fall, but as money moving from one part of the market to another.
The day is also unfinished. The US October payrolls report lands at 21:30 AEDT, well after the ASX closed, so the next session’s direction is still open.
Here is how to read any trading day by connecting four things: the global trigger, the sector rotation, the company news and the chart levels.
Why did a US tech rout hit miners before it hit banks?
The trigger came from Wall Street. The S&P 500 fell 4.4%, the Nasdaq 6.4% and the Philadelphia Semiconductor Index 12%, its worst fall since 2020. About US$2.3 trillion of US market value was erased.
David Tuckwell, chief investment officer of ETF Shares, traced the selling to stocks priced on future AI growth.
Hedge funds pulling back Tuckwell said US hedge funds were taking profits on AI-exposed stocks, with hedge fund gross exposure (the total size of their long and short bets) down 8% from its recent high. That is the largest such fall since 2016.
From there the shock moved through the Australian market in sequence:
- US selling hit first. Expensive AI, semiconductor and data-centre shares were sold on Wall Street.
- Local tech was exposed next. Names such as Megaport, Xero and NEXTDC depend on global growth and financing conditions for their valuations.
- Money rotated to cash flow. Banks, supermarkets, Telstra and utilities drew buyers because their earnings arrive sooner and carry less duration risk.
- Miners were sold last. After heavy buying the day before, they faced fresh concerns about global growth, commodity demand and crowded positioning.
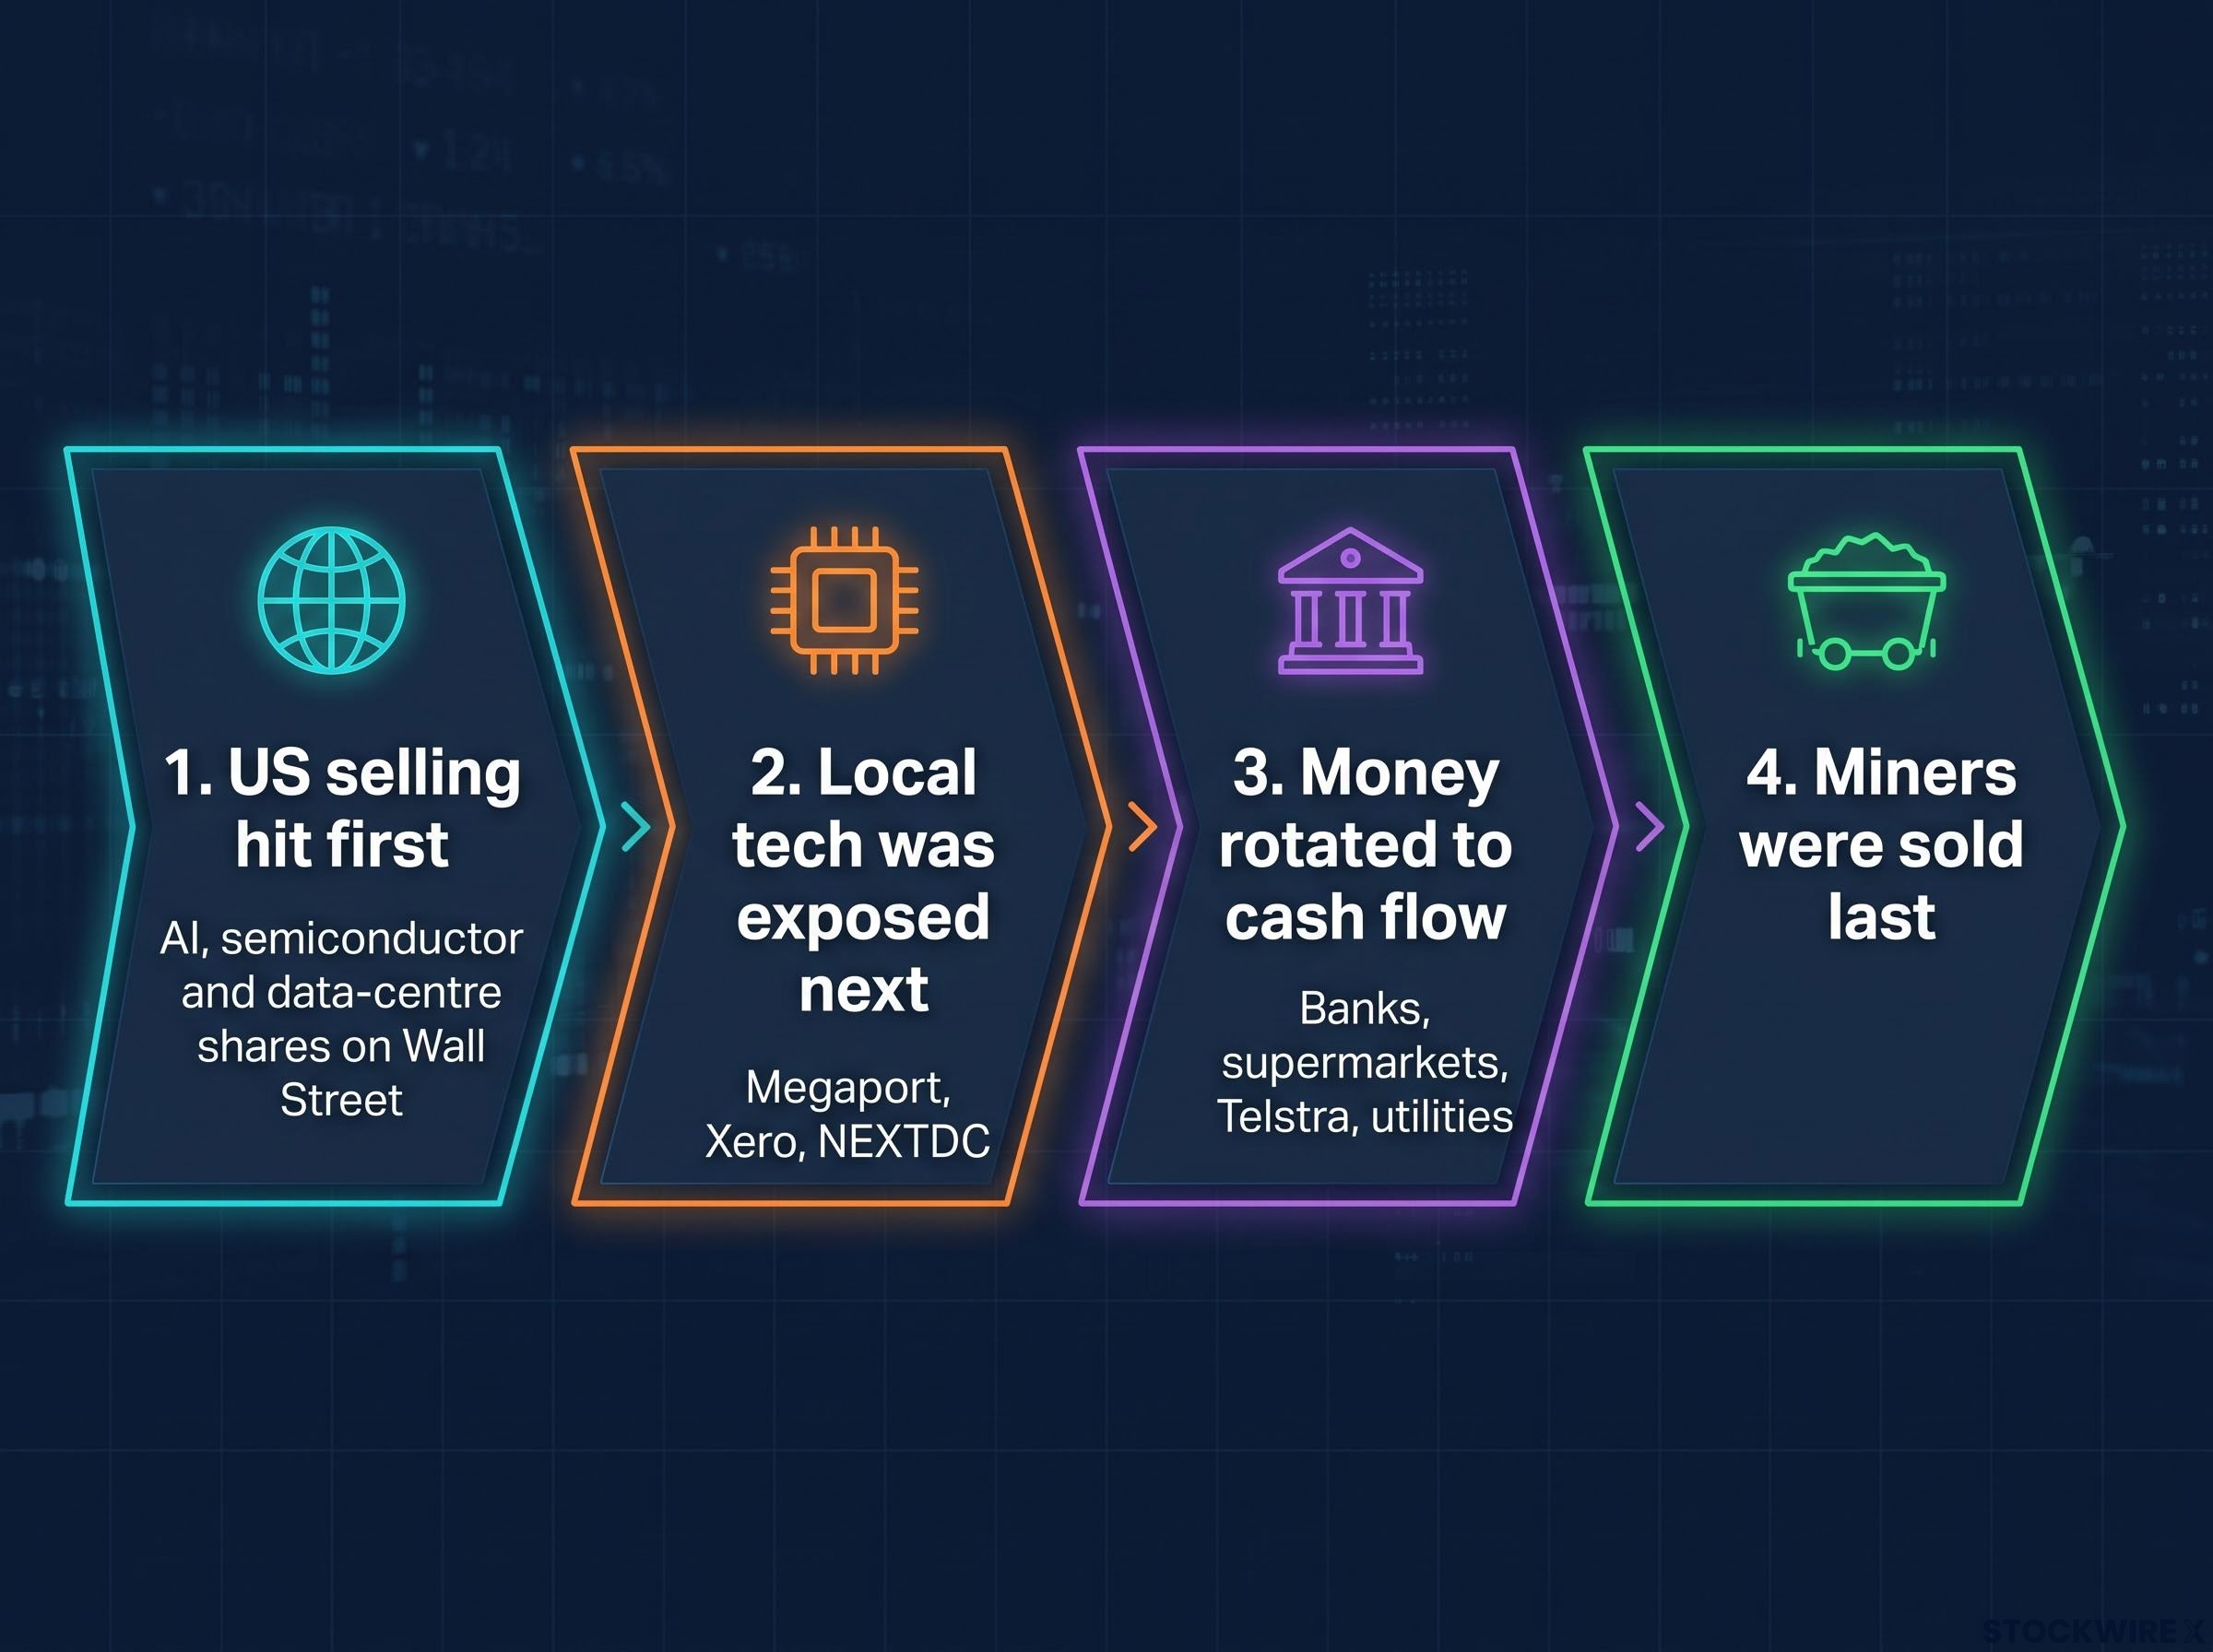
The rotation was a shift from long-duration valuations (prices that depend on profits years away) to nearer-term cash flows. One caveat applies to step four. No named strategist was found explaining the miner sell-off; the mechanism fits the price action but remains an inference.
The pattern had been building since the Nasdaq peak on 6 October, when US and Australian defensives rose together, which points to global drivers such as rates and AI valuation worries rather than local factors alone.
How the ASX held up against the US shock
The ASX 200 shed 44.3 points, closing about 1.1% above its session low and still up 1.3% for the week. Breadth told a weaker story: in the ASX 300, 75 stocks rose and 208 fell. The Australian dollar slipped 0.59% to US$0.6889.
What this tells you is that a portfolio heavy in miners and tech carried the shock directly, while one tilted to banks and staples absorbed it. Your sector mix mattered far more than the index headline.
When big ASX news breaks, our subscribers know first
Where did the money move? A sector-by-sector read of the session
The sector table shows the scale of the split.
| Sector | Move |
|---|---|
| Consumer Staples | +1.41% |
| Financials | +0.56% |
| Communication Services | +0.30% |
| Utilities | +0.20% |
| Industrials | -0.02% |
| Energy | -0.08% |
| Health Care | -0.20% |
| Consumer Discretionary | -0.52% |
| Information Technology | -0.78% |
| Real Estate | -0.86% |
| Materials | -2.51% |
Almost four percentage points separate the top and bottom of that table. At the weak end, BHP and Rio Tinto were among the main drags, sold after heavy buying the previous session.
The banks versus miners split has a valuation backdrop: earlier in 2026 miners traded at a steep forward earnings discount to banks, which helps explain why crowded mining positions were vulnerable to a sharp reversal.
At the strong end, Woolworths and Coles each rose 1.8%. Banks added support, with NAB up 2.7%, and insurer QBE gained 3.3%.
The damage deepened further down the market:
- All Ordinaries: 9,144.7 (-0.66%)
- Small Ordinaries: 3,199.3 (-2.23%)
- All Technology: 3,012.6 (-1.16%)
- Emerging Companies: 2,741.3 (-2.43%)
Smaller companies fell roughly four times as hard as the benchmark. The index average masked a sharp reallocation, so check your sector and size exposure rather than relying on the headline number.
What company news and broker calls did to individual shares
Sector flows set the tide. Company news decided which shares swam against it.
Stocks that moved on news
- Nine Entertainment: +11.6%
- Mayne Pharma: +13.7%
- NEXTDC: +5.6%
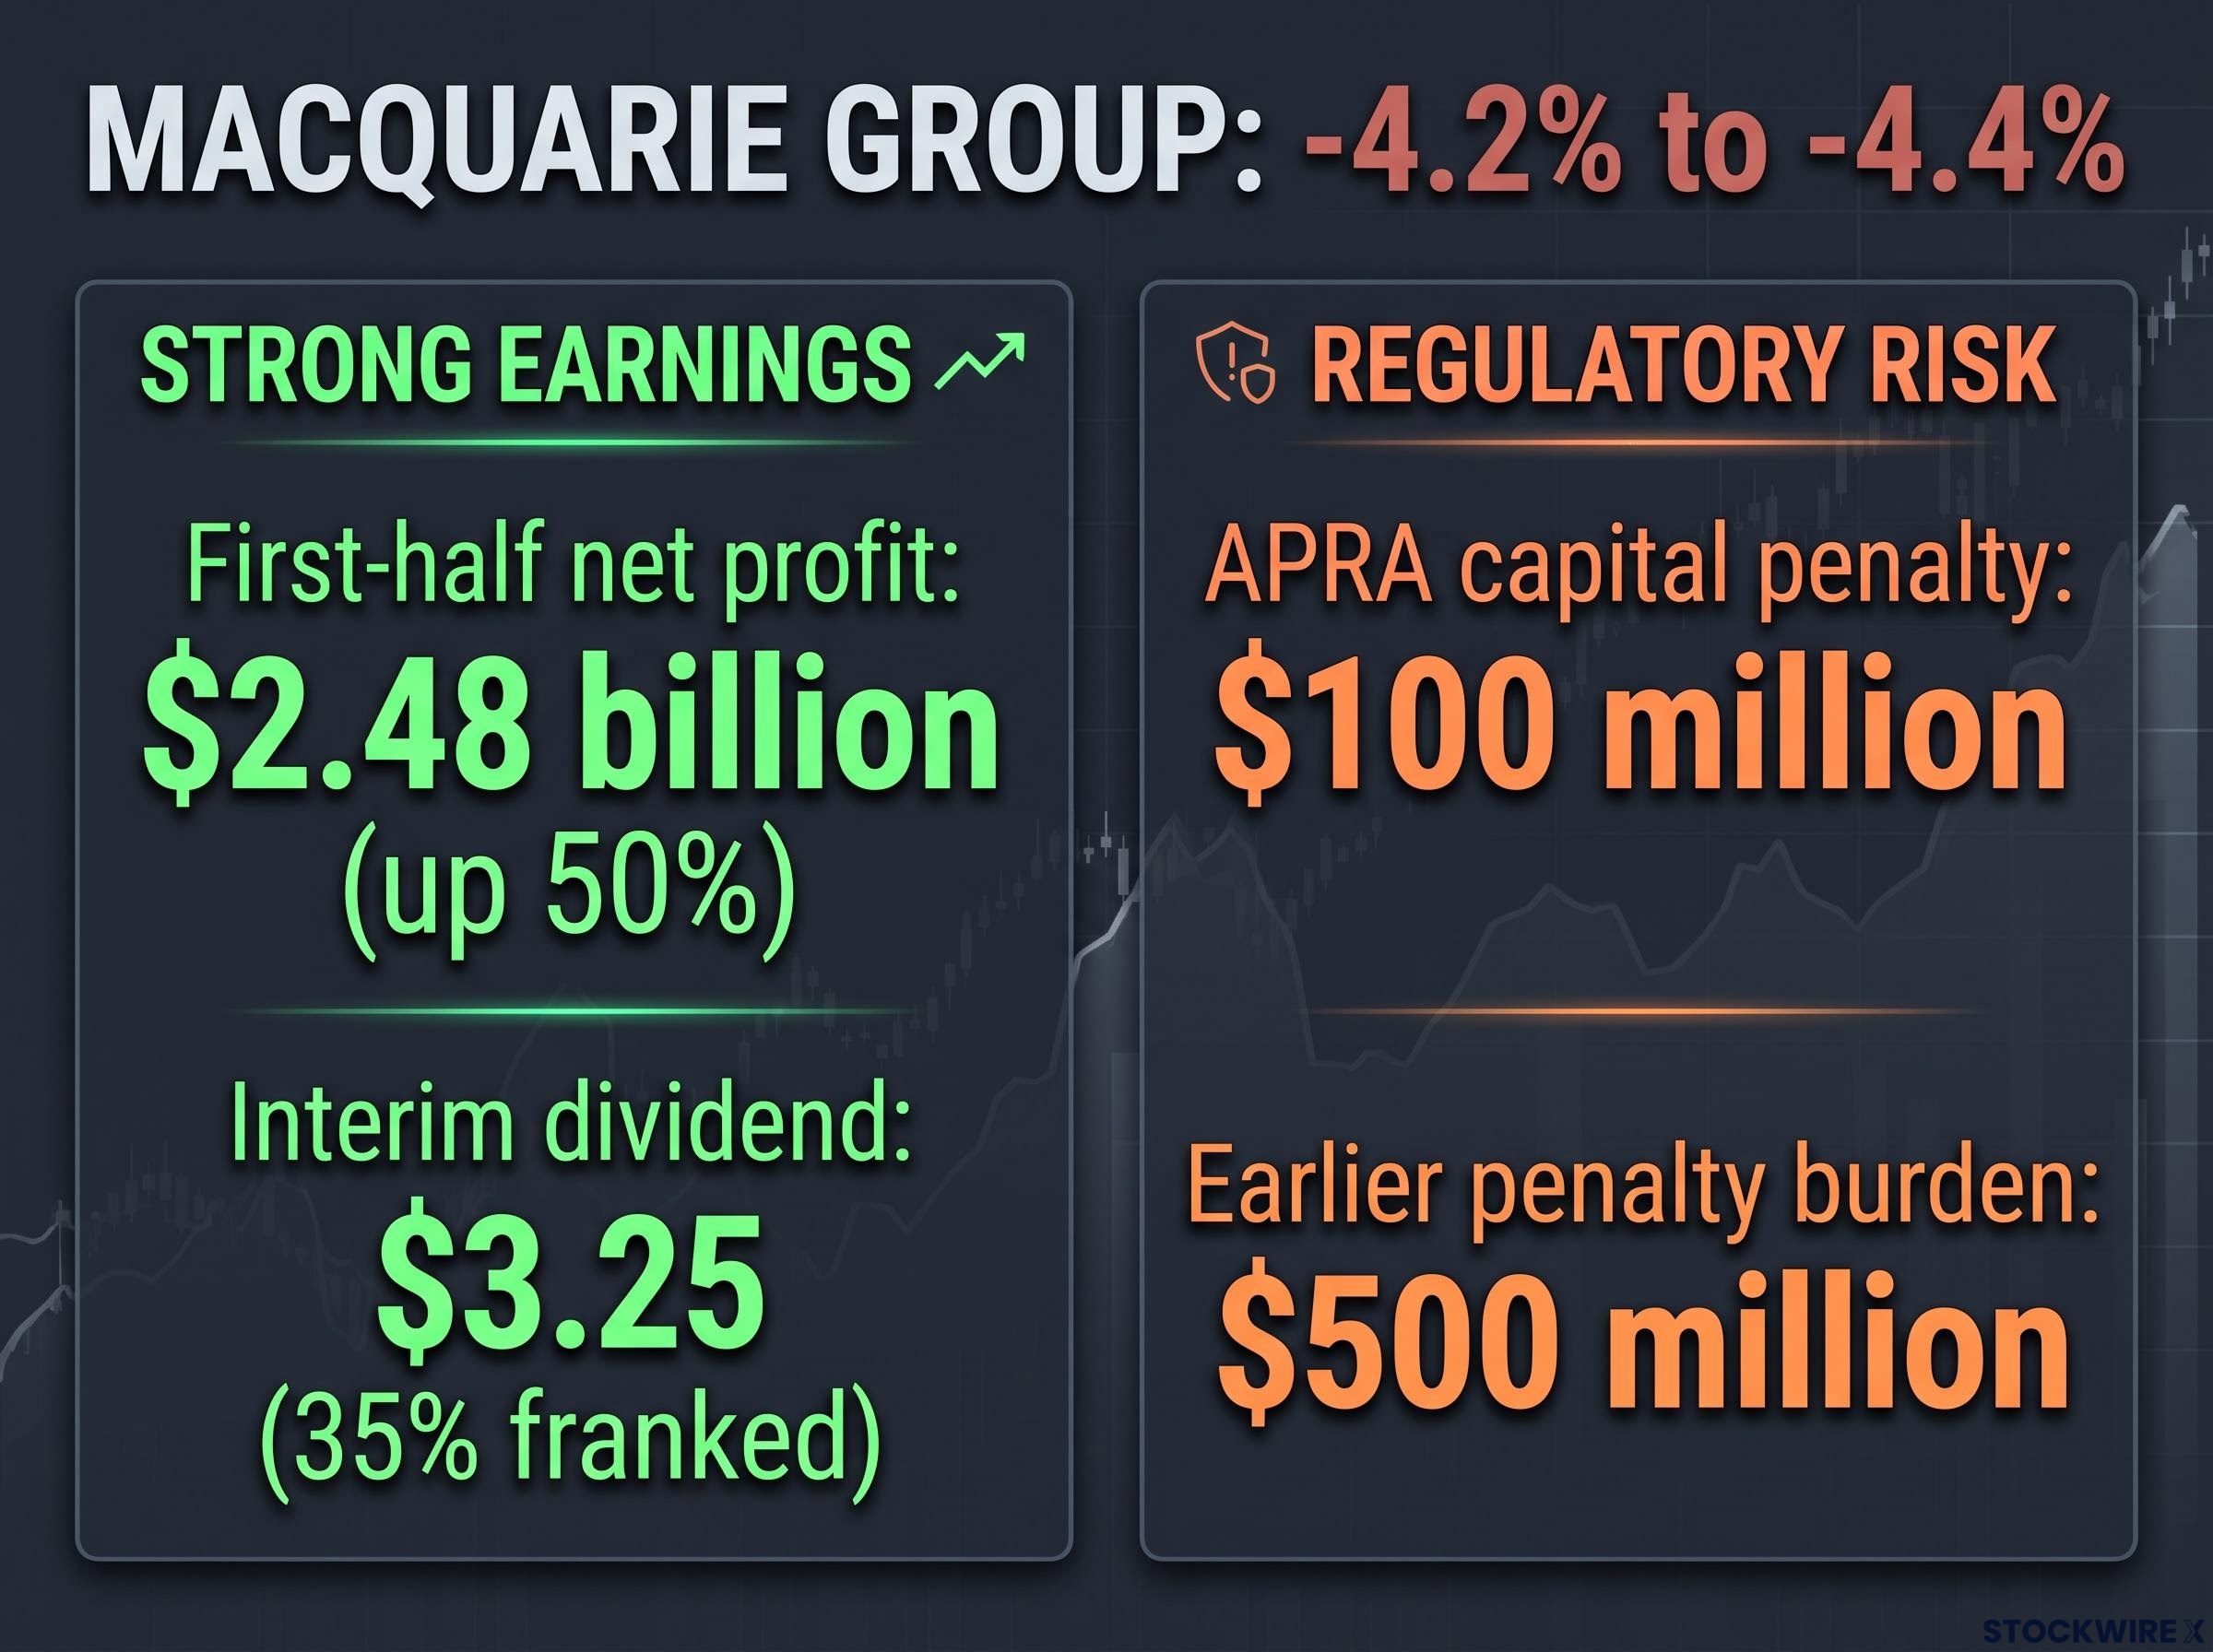
- Macquarie Group: about -4.2% to -4.4%
- James Hardie: -6.2%
- News Corp: -9.3%
- Develop Global: -10.1%
Nine used its annual general meeting to raise its cost savings target to at least $180 million and flag mid-teens first-half outdoor revenue growth. Asset sales have brought in about $100 million. The rally came despite about 34% opposition to its remuneration report, a first strike.
Mayne Pharma agreed to sell its international business to Evaris Pharma for $55.5 million cash, lifting its shares to $3.08. Tourism Holdings received revised non-binding proposals from BGH Capital and Indie Campers, though the price was undisclosed and no share price reaction was verified.
Macquarie is the session’s clearest lesson. First-half net profit came in at $2.48 billion, up about 50%, with an interim dividend of $3.25 per share, 35% franked. Yet the shares fell after APRA added a $100 million capital penalty on top of an earlier $500 million burden.
The market priced regulatory capital risk ahead of headline earnings. A strong result does not guarantee a rising share price when the regulator is tightening the screws.
APRA’s capital overlay announcement attributes the penalty to a breach in how Macquarie calculated required capital for its non-bank businesses, and cites weaknesses in governance and assurance processes. For shareholders, that makes it a control issue, not only a one-off charge.
James Hardie slid on difficult US housing conditions. Develop Global and News Corp fell without stock-specific news from the day, carried by the materials sell-off and the US reaction respectively.
Broker upgrades, downgrades and target cuts
Brokers were busy, mostly trimming.
| Stock | Broker | Change | Detail |
|---|---|---|---|
| ASX Ltd | UBS | Downgrade | To Neutral from Buy |
| NEXTDC | Morgans | Downgrade | To Accumulate; target $11.50 from $7.50 |
| REA Group | Morgans | Downgrade | To Accumulate from Buy |
| Woodside Energy | Ord Minnett | Upgrade | To Accumulate from Hold |
| Xero | Macquarie | Target cut | $158.50 from $235.80 |
| NAB | UBS | Target cut | $45.00 from $48.50; Buy retained |
| Eagers Automotive | Bell Potter | Target cut | $21.50 from $27.50 |
NEXTDC shows how mixed signals can sit together: a lower rating alongside a sharply higher target. NAB rallied the same day multiple brokers cut its targets. Treat a rating change as one data point, not an instruction.
Is this a valuation reset or something bigger? Three readings of the sell-off
The same price action supports three different stories, and each points your attention somewhere different.
| Interpretation | Reasoning | Implication for ASX investors |
|---|---|---|
| Profit-taking after an AI-led rally | Hedge funds banked gains, and crowded semiconductor bets amplified the fall | Damage may stay concentrated in high-multiple tech and data-centre shares |
| Wider credit or earnings risk | Doubts over whether earnings can justify heavy AI spending; falls this large suggest more than one stock’s problem | Pressure through global funding costs, lower valuations and mining earnings |
| Regulatory-policy shock | Reports linked the rout to fears of heavier regulation of the AI build-out after the US political shift | Companies with US tech customers, data-centre plans or reliance on global capital |
The first reading is the mildest: investors who made money sold, and the fall burns out once crowded positions clear. The second is more serious because it reaches beyond tech into lending and growth.
Carl Capolingua, author of the ChartWatch column, leans toward taking that second risk seriously.
A credit warning Capolingua warned that an AI-driven US crash could turn into a credit crisis, which would flow through to the ASX.
Reports did not establish a systemic credit event. The warning describes a possibility, not a confirmed outcome.
“Defensive” needs a precise meaning here. A defensive sector earns steadier revenue that depends less on economic growth, which is why banks and staples drew buyers. Defensive does not mean immune, and miners remain exposed to Chinese and global demand.
History offers less help than you might hope. The US fall was the worst since the 2025 “liberation day” rout, but no complete ASX sequence after that episode was located, and a falling Nasdaq does not mechanically set the size or length of an ASX decline. With no single reading confirmed, your position sizing should reflect uncertainty rather than a firm bet on one story.
Which chart levels and data matter next for the ASX 200 and Nasdaq?
A few terms first. A supply zone is a price range where selling previously overwhelmed buying; a demand zone is the reverse. A trend ribbon combines several moving averages to show trend direction, and volume confirmation means checking that a breakout has heavy trading behind it.
Key levels to watch
The following levels come from Capolingua’s ChartWatch, as of the 5-6 November close, plus separate ATFX commentary.
| Index | Zone type | Level | Source |
|---|---|---|---|
| Nasdaq | Latent supply | 25145-26049 | Capolingua |
| Nasdaq | Dynamic supply | 24909-25712 | Capolingua |
| Nasdaq | Critical level | 26049 | Capolingua |
| Nasdaq | Potential latent demand | 23722-24425 | Capolingua |
| ASX 200 | Closest supply | 9123-9297 | Capolingua |
| ASX 200 | Dynamic demand | 8795-8845 | Capolingua |
| Nasdaq | Support / resistance | Support 26,133 and 25,830; resistance 27,132 and 27,440 | ATFX (not independently confirmed) |
Capolingua reads the Nasdaq as bearish. Another peak within its long-term ribbon would confirm a bear market under his model, and he has cut US exposure to one third of his risk position.
On the ASX 200 he sees demand outweighing supply, holding a 2/3 risk position (67% cash, 33% invested). ATFX uses a different method and labels as support a range Capolingua treats as supply, so do not swap one set for the other.
The payrolls catalyst
The US October jobs report is due at 21:30 AEDT tonight. The result was not available at the time of writing.
- Jobs added: about +63,000 (Market Index) against +29,000 in September
- Reuters/FactSet consensus: about +65,000 (not independently confirmed)
- Unemployment rate: forecast 4.2%
- Average hourly earnings: forecast +0.3% month on month
US futures were mixed at the wrap: S&P 500 -0.03%, Dow -0.97%, Nasdaq +0.80%. The ASX 200 sits between demand near 8,800 and supply above 9,123, and tonight’s figure could push it toward either edge.
What charts cannot tell you
Treat these levels as a map for decisions, not a forecast. Zones are partly arbitrary, indicators lag, false breakouts happen and hindsight makes past patterns look cleaner than they were.
Charts also miss earnings, regulatory events like Macquarie’s penalty and overnight gaps. These levels are opinions and remain subject to change as market conditions develop.
Reading the next trading day with all four lenses
Each lens explained part of Friday. The US sell-off supplied the trigger, rotation decided which sectors bled, company news overrode the tide for Nine, Mayne and Macquarie, and chart levels framed where the index now sits. None of them alone told the full story.
The next markers are already set: the payrolls result, the Nasdaq’s critical level of 26049, and the ASX 200’s demand zone at 8795-8845 and supply zone at 9123-9297.
On any trading day, ask four questions:
- What was the global trigger? Identify the overseas event driving sentiment.
- Which sectors rotated? Check the sector table, not the headline.
- Which stocks moved on news? Separate company-specific moves from the tide.
- Where are the key levels? Note the zones the market is approaching.
This article is for informational purposes only and should not be considered financial advice. Investors should conduct their own research and consult with financial professionals before making investment decisions.