
An 85% win rate sounds like a strategy that works. In one hosted backtest of zero DTE put spreads on the S&P 500, the trade collected an average credit of about $238 and kept an average profit of roughly $15.88 per trade. Most of the premium never stayed in the account.
That gap matters because more traders are looking at this structure. Daily S&P 500 index (SPX) expirations only became available on every trading day in May 2022. Zero days to expiration (0DTE) options, which expire on the day they trade, now account for roughly 59-66% of SPX volume, according to Cboe.
Cboe also reports that more than 95% of SPX 0DTE flow uses limited-risk structures. That makes defined-risk spreads the natural trade to study. The figures below come from a backtest presented by its hosts, with the idea credited to Options Kai. They are not market-wide facts.
This shows you where the profit leaks out of a high-win-rate trade, and which variables (volatility, spread width and position size) change the outcome.
Why does a strategy that wins most days earn so little?
The tested trade was mechanical. Each morning it sold a put spread with the short strike at about 20 delta and $20 wide, then held it to the close with no stop and no profit target. Delta is the option’s sensitivity to the index price and serves as a rough proxy for the chance of finishing in the money. A short put spread sells one put and buys a lower one, which caps the maximum loss.
SPX and its mini version, XSP, are cash settled and European style, so there is no early assignment. XSP carries about one-tenth the notional value of SPX.
On those terms, the headline looks strong.
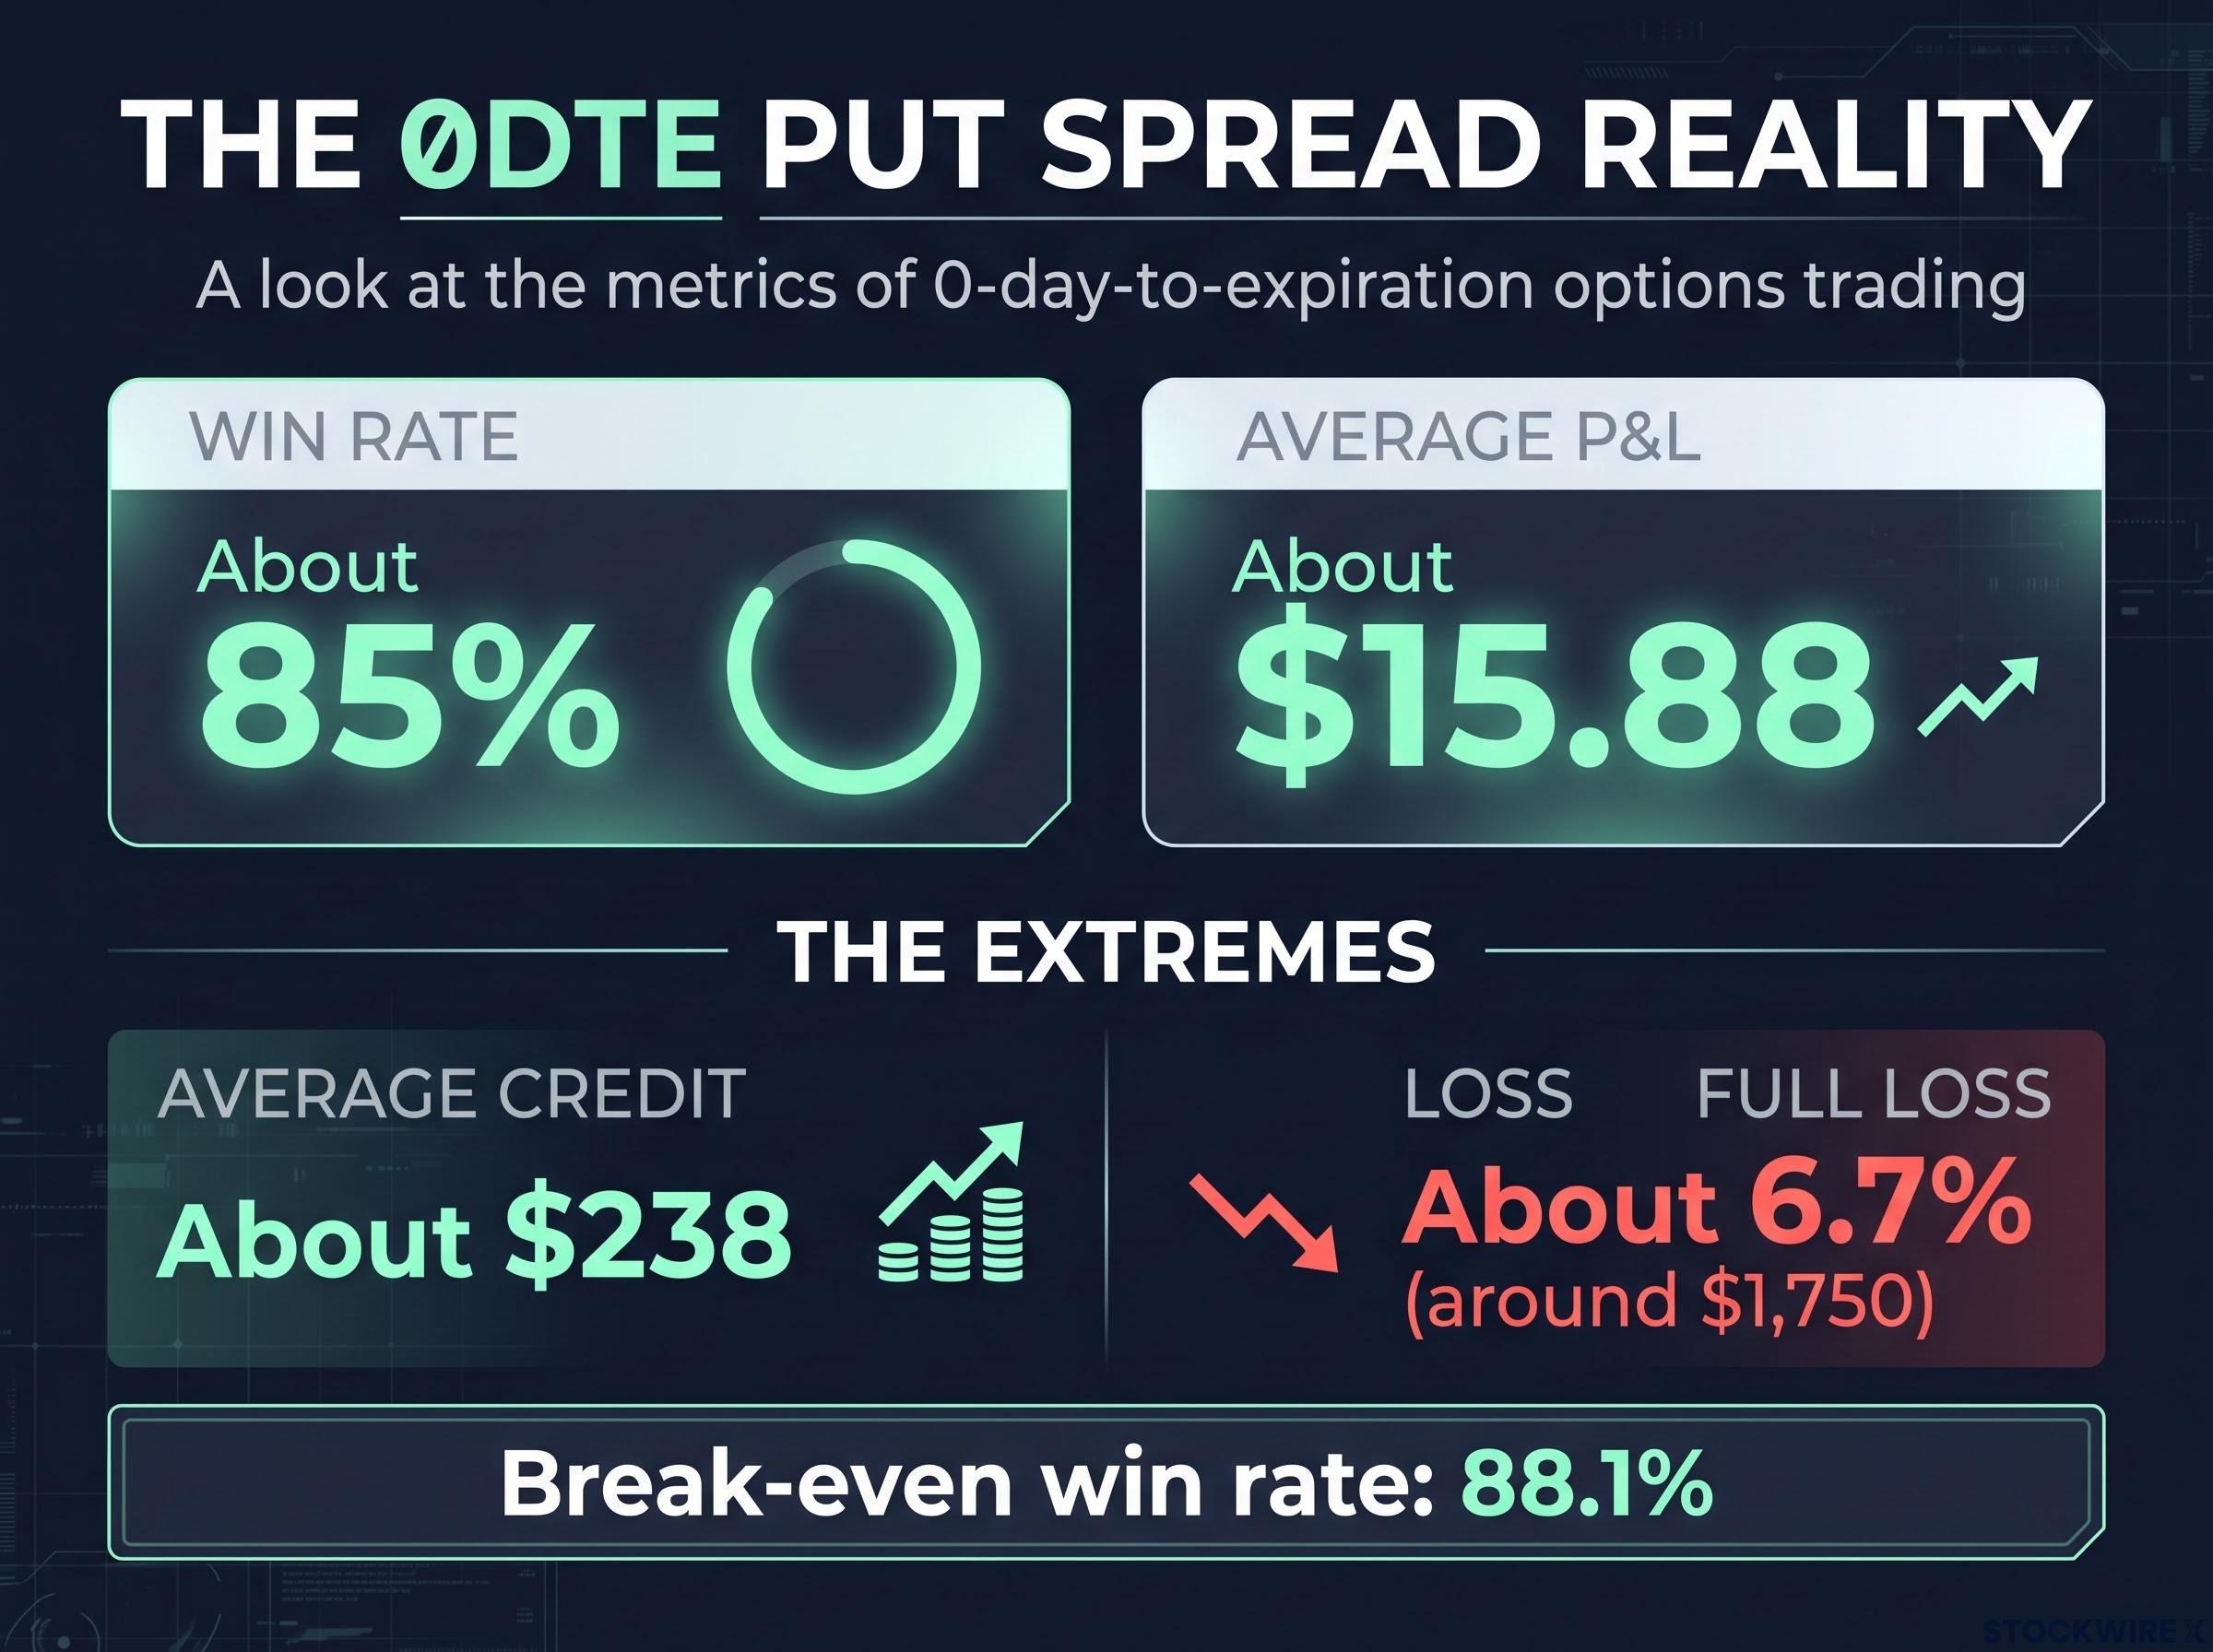
| Metric | Value | What it implies |
|---|---|---|
| Win rate | About 85% | Frequent small gains |
| Full credit kept | About 84% | Most days pay in full |
| Full loss | About 6.7% (around $1,750) | Rare but heavy damage |
| Average credit | About $238 | Maximum gain per trade |
| Average P&L | About $15.88 | Very thin edge |
The table describes negative skew: many small credits balanced against rare losses several times larger. One maximum loss erased roughly seven full-credit wins. The window ran from roughly late 2022 or 2023 to the present.
How expectancy works in plain terms
Expectancy is the average amount a trade makes or loses each time you place it.
The break-even formula Expectancy = (win rate × average win) minus (loss rate × average loss)
A $20-wide spread collecting $238 risks about $1,762. The break-even win rate before costs is therefore 1,762 / (1,762 + 238), or about 88.1%. The backtest’s 85% sits below that line. Partial losses, where the index finished between the strikes, kept the average slightly positive.
Gamma, the rate at which delta changes, rises sharply near expiry, according to Cboe’s Henry Schwartz. In practice, small index moves late in the day swing the spread’s value hard.
Gamma’s late-session surge also feeds back into the index itself, because dealer hedging flows tied to same-day contracts can pin the S&P 500 near heavily traded strikes and then release it quickly, which is part of why spreads swing so hard into the close.
A high win rate tells you how often you win, not how much you make. With a $15.88 cushion, modest slippage or commission could erase the edge entirely.
When big ASX news breaks, our subscribers know first
Does the VIX change how zero DTE put spreads perform?
If thin profits are the problem, a higher Cboe Volatility Index (VIX) looks like the fix. The VIX measures expected 30-day S&P 500 volatility. In the backtest, higher readings brought bigger credits and stronger average P&L, while the win rate barely moved.
Conventions treat readings below 15 as low, 15-20 as ordinary, above 20 as elevated and above 30 as severe stress. Cboe puts the long-run median at 17.6, and the commonly cited average is about 21. The VIX closed at 16.61 yesterday, 4 November 2026, although sources differ slightly on the exact figure.
The hosts found average P&L improved above about 20, and results held up even under a low-volatility cutoff of 14.8. Maximum loss arrived in roughly 6% of cases since 2023. Conditional value at risk, the average loss on the worst days, was nearly identical across regimes. Longer 30 and 45 day trades showed similar stability.
The mechanism explains why:
- Delta-based strikes move. A 20-delta strike sits further from the index as implied volatility rises.
- Credit rises. Higher extrinsic value, the part of an option’s price above its intrinsic value, pays more for a similar spread.
- Compensation scales. The bigger credit pays for a wider expected range, so the breach probability can stay roughly constant.
- A variance premium may exist. Freire (2024) and a 2024 profitability study found implied variance tended to exceed realised variance in their samples, although that is not guaranteed.
- Path and gamma still bite. Breaches depend on intraday moves, and losses can accelerate late in the session.
The hosts warned that liquid 0DTE data covers only a couple of years, and clustered losses in one VIX band could distort the picture. A higher VIX looks like a bigger payday with no extra failure rate. You should treat that as a property of this delta-based test, not a law that will hold in a shock.
Because every strike’s price and delta are outputs of implied volatility, the larger credit at a higher VIX is mechanical rather than a bonus: the same 20-delta label simply sits at a different distance from the index, with a skew that prices downside puts richer.
What happens when the short strike is breached?
Equal win rates can hide very different days, and the breach data shows how. A breach looks survivable at first:
- 31% of sessions crossed below the short strike.
- Roughly half of those still finished profitable.
- Breached sessions spent a median of nearly three hours below the strike.
- The rest ended at maximum or very deep losses.
Once the short strike is breached, recovery is roughly a coin flip.
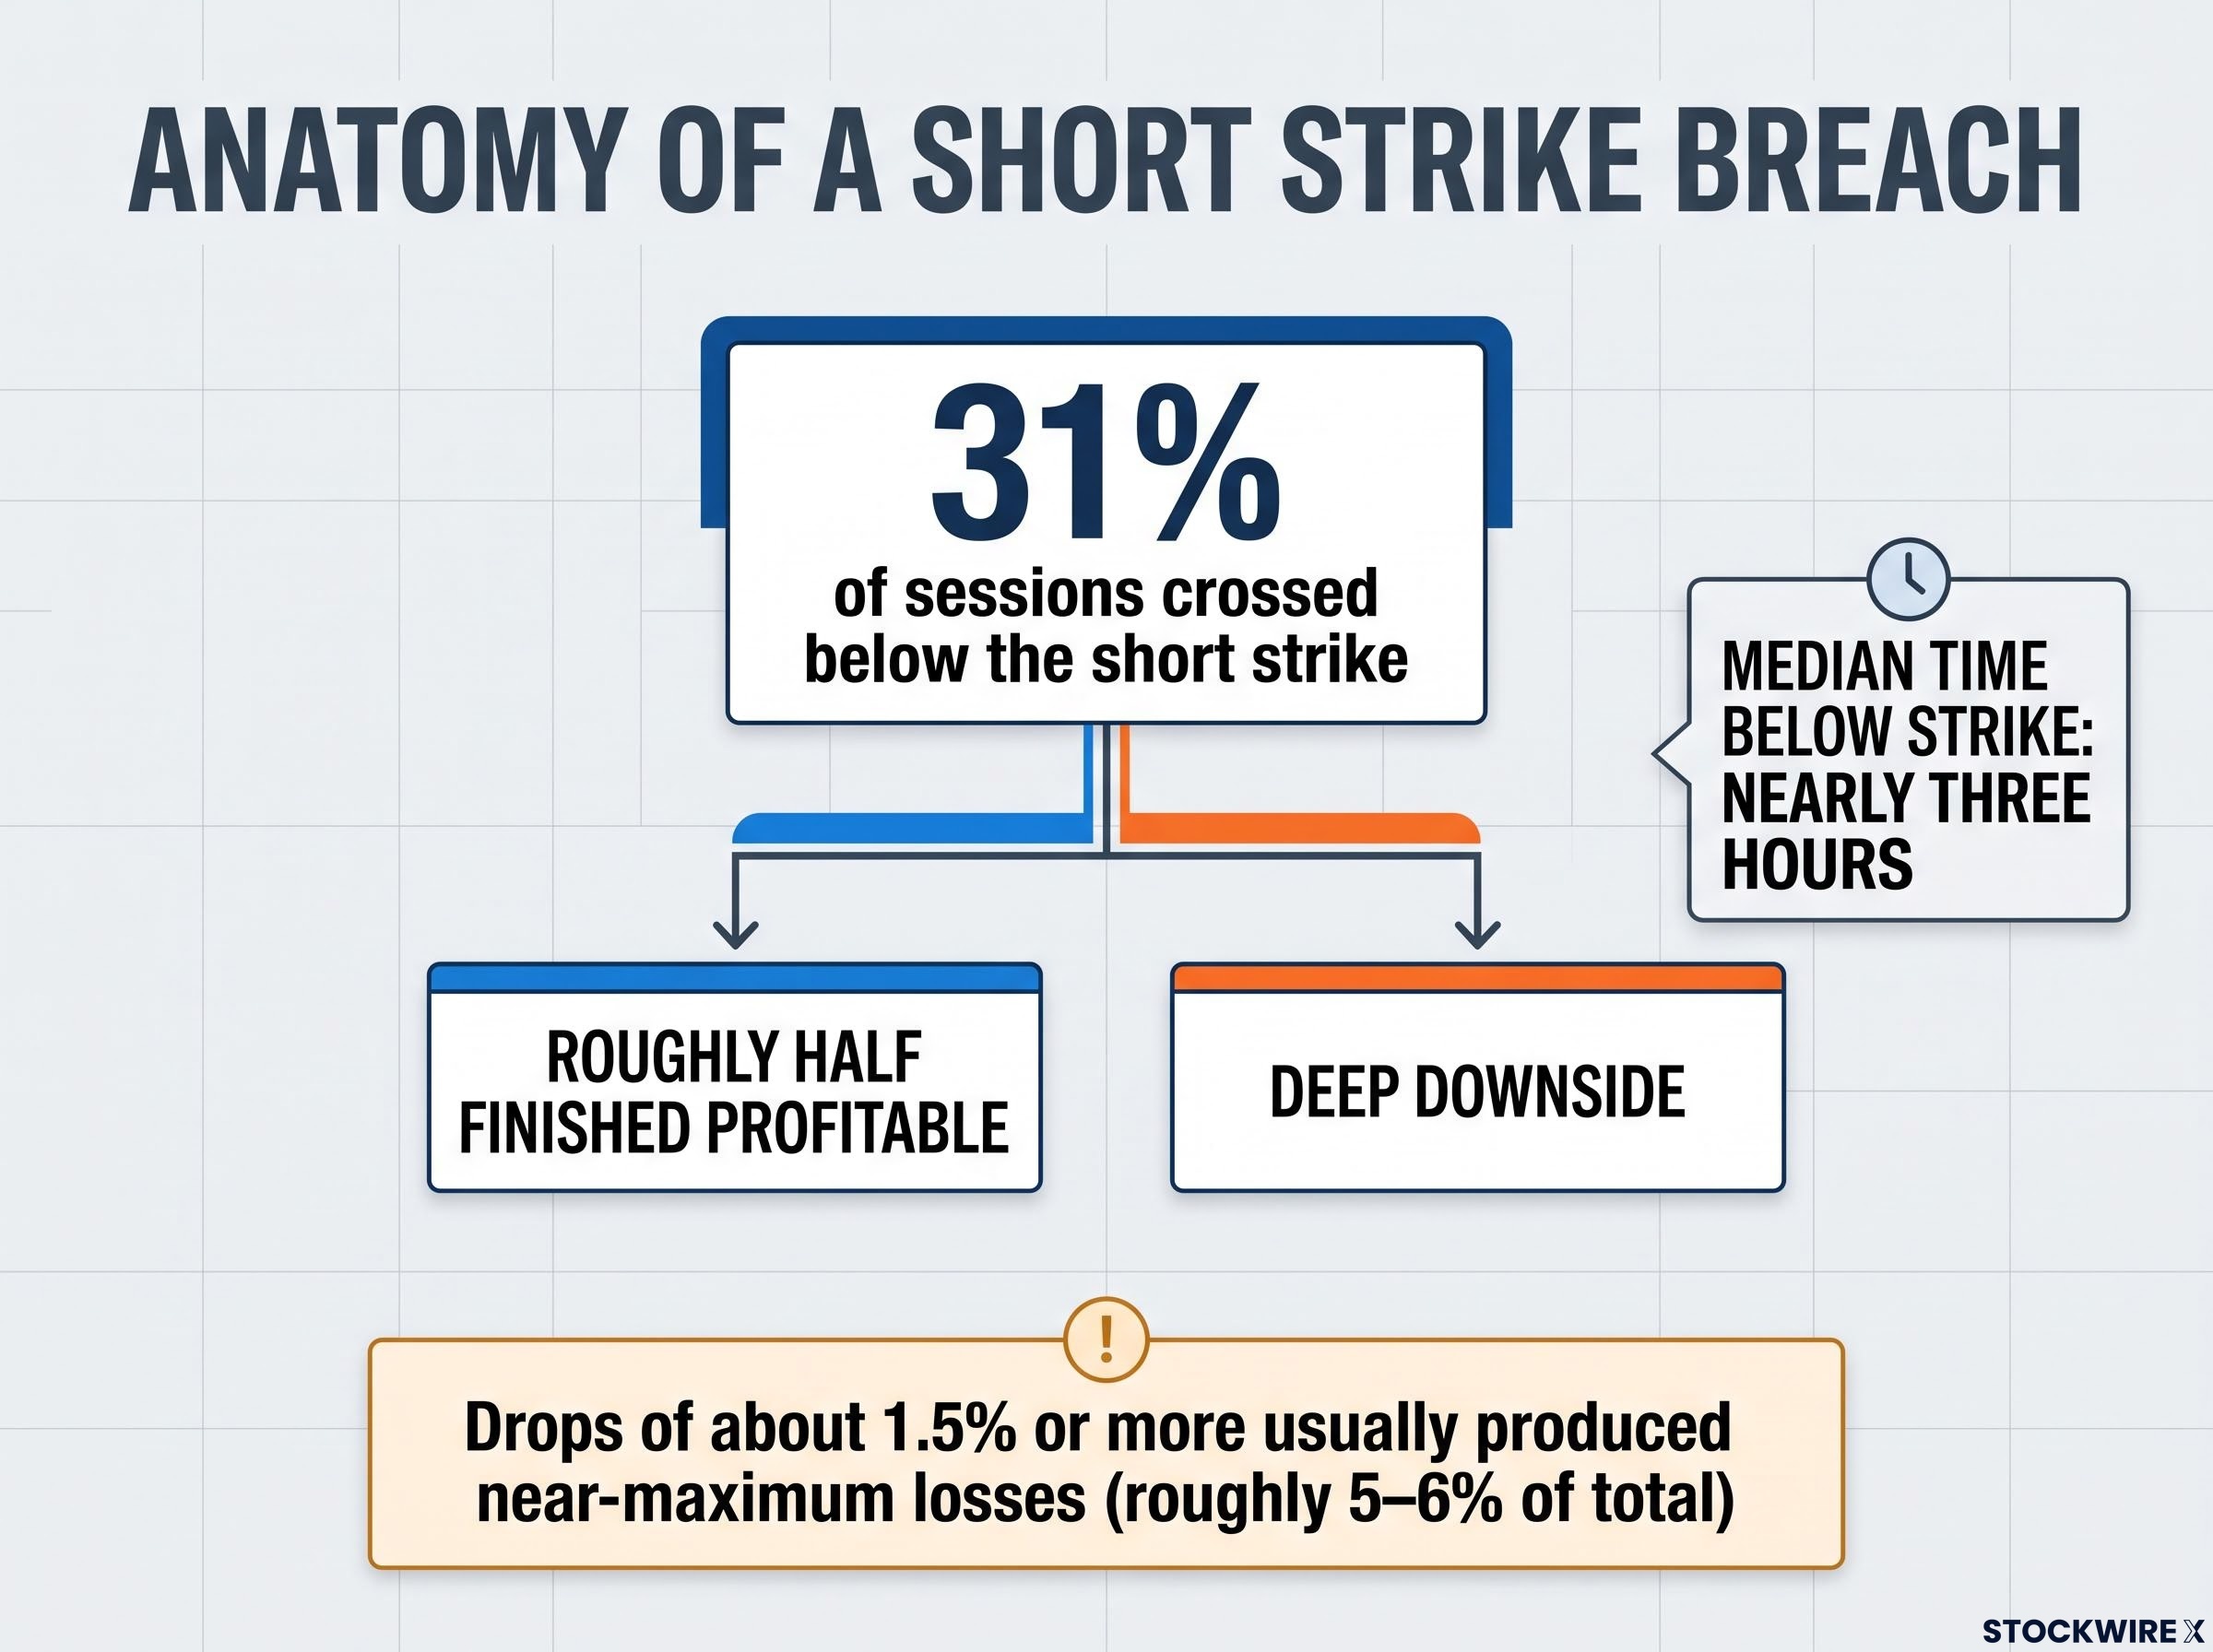
The odds also depend on the size of the move. Drops of about 1.5% or more usually produced near-maximum losses that stayed there until expiry, and those big-move sessions made up roughly 5-6% of the total.
Researchers at Johns Hopkins Carey (Bandi, Fusari and Renò, 22 April 2024) found 0DTE prices highly sensitive to small moves in the index. They also found unexpected announcements, such as a surprise Federal Reserve decision, can cause very large losses.
A breach puts you in a roughly even bet with a deep downside. You need to set your tolerance before the trade, not three hours into it.
Why stops are not a clean fix
Stops sound like the answer, but on spreads they do not guarantee a price. Fills can gap through and bids can vanish. A 2025 trading account reviewed by Early Retirement Now recorded put-side stops triggering during intraday declines of about 3% in October and November 2025. On 9 April 2025, a 10.39% intraday move triggered that account’s stops. On 4 April 2025, a drawdown of about 4.2% from the open still let it keep the full premium.
A stop can also turn a trade that would have recovered into a realised loss. Backtests that only measure the result at expiry miss that cost.
How do spread width and position size shape the risk?
If breaches are partly luck, structure and size are what you control. Width changes how losses arrive rather than automatically improving expectancy.
| Width | Credit | Max dollar loss | Loss pattern | Friction |
|---|---|---|---|---|
| $5 | Lower | Lower | More often full losses | Commissions and bid/ask weigh more |
| $10 | Intermediate | Intermediate | Tends towards full losses | Intermediate |
| $20 | Higher | Much larger | More variable partial losses | Harder to exit in fast moves |
One host prefers $5 or $10 widths without stops, and the hosts suggested a follow-up comparing $5 and $20 spreads. Cumulative P&L stayed positive but was choppy, with deep drawdowns and recoveries along the way.
Sizing principles drawn from the research:
- Measure risk by realistic liquidation loss, not just maximum loss at expiry.
- Risk a small percentage of account equity per trade or per day.
- Cap correlated positions open at the same time.
- Consider XSP, at one-tenth the notional, for smaller exposure.
No public 2024-2026 case of an SPX 0DTE put spread trader blown up by oversizing was verified. That does not make the risk theoretical. Your position size, not your win rate, decides whether one bad session is an annoyance or an account-level event.
For readers weighing the smaller-notional route, our dedicated guide to building an XSP put credit spread walks through strike selection, the one-third credit rule and exit triggers set at order entry.
What the short data history cannot tell you
Liquid daily expirations only began in 2022, so the sample covers few independent volatility regimes. Mid-price fills and perfect exits overstate returns, and event days call for stress testing. The 2024 profitability study found results depended heavily on execution, sample period, exits and the treatment of tail losses. Past performance does not guarantee future results.
Weighing a high win rate against the tail: what to take from the data
The picture holds together. The strategy produced many small credits, an 85% win rate and rare outsized losses. Its win rate stayed stable across VIX regimes, and recovery after a breach was roughly a coin flip. The $238 average credit shrank to $15.88 of profit against a break-even win rate of about 88.1%.
This is one hosted backtest, not Cboe or OCC validation, and not proof of a durable edge. The Bank for International Settlements (BIS) warned in March 2024 that 0DTE options carry extreme leverage and lottery-like payoffs. The short side sits on the other end of that bet. Treat the average profit and the worst day as equally important numbers.
The same pattern shows up beyond 0DTE: selling options tail risk has repeatedly erased years of small gains in one session, as the August 2024 VIX spike to an intraday 65.73 showed for short-volatility products.
Before you trust any 0DTE backtest, ask:
- Was slippage modelled? Mid-price fills flatter results.
- Are path and stop effects included? Results measured only at expiry hide interim losses.
- How were clustered losses handled? Selloffs rarely arrive one day at a time.
- Does it span multiple regimes? A short history can mislead.
- What are the account-level limits? Sizing determines survival.
This article is for informational purposes only and should not be considered financial advice. Investors should conduct their own research and consult with financial professionals before making investment decisions.