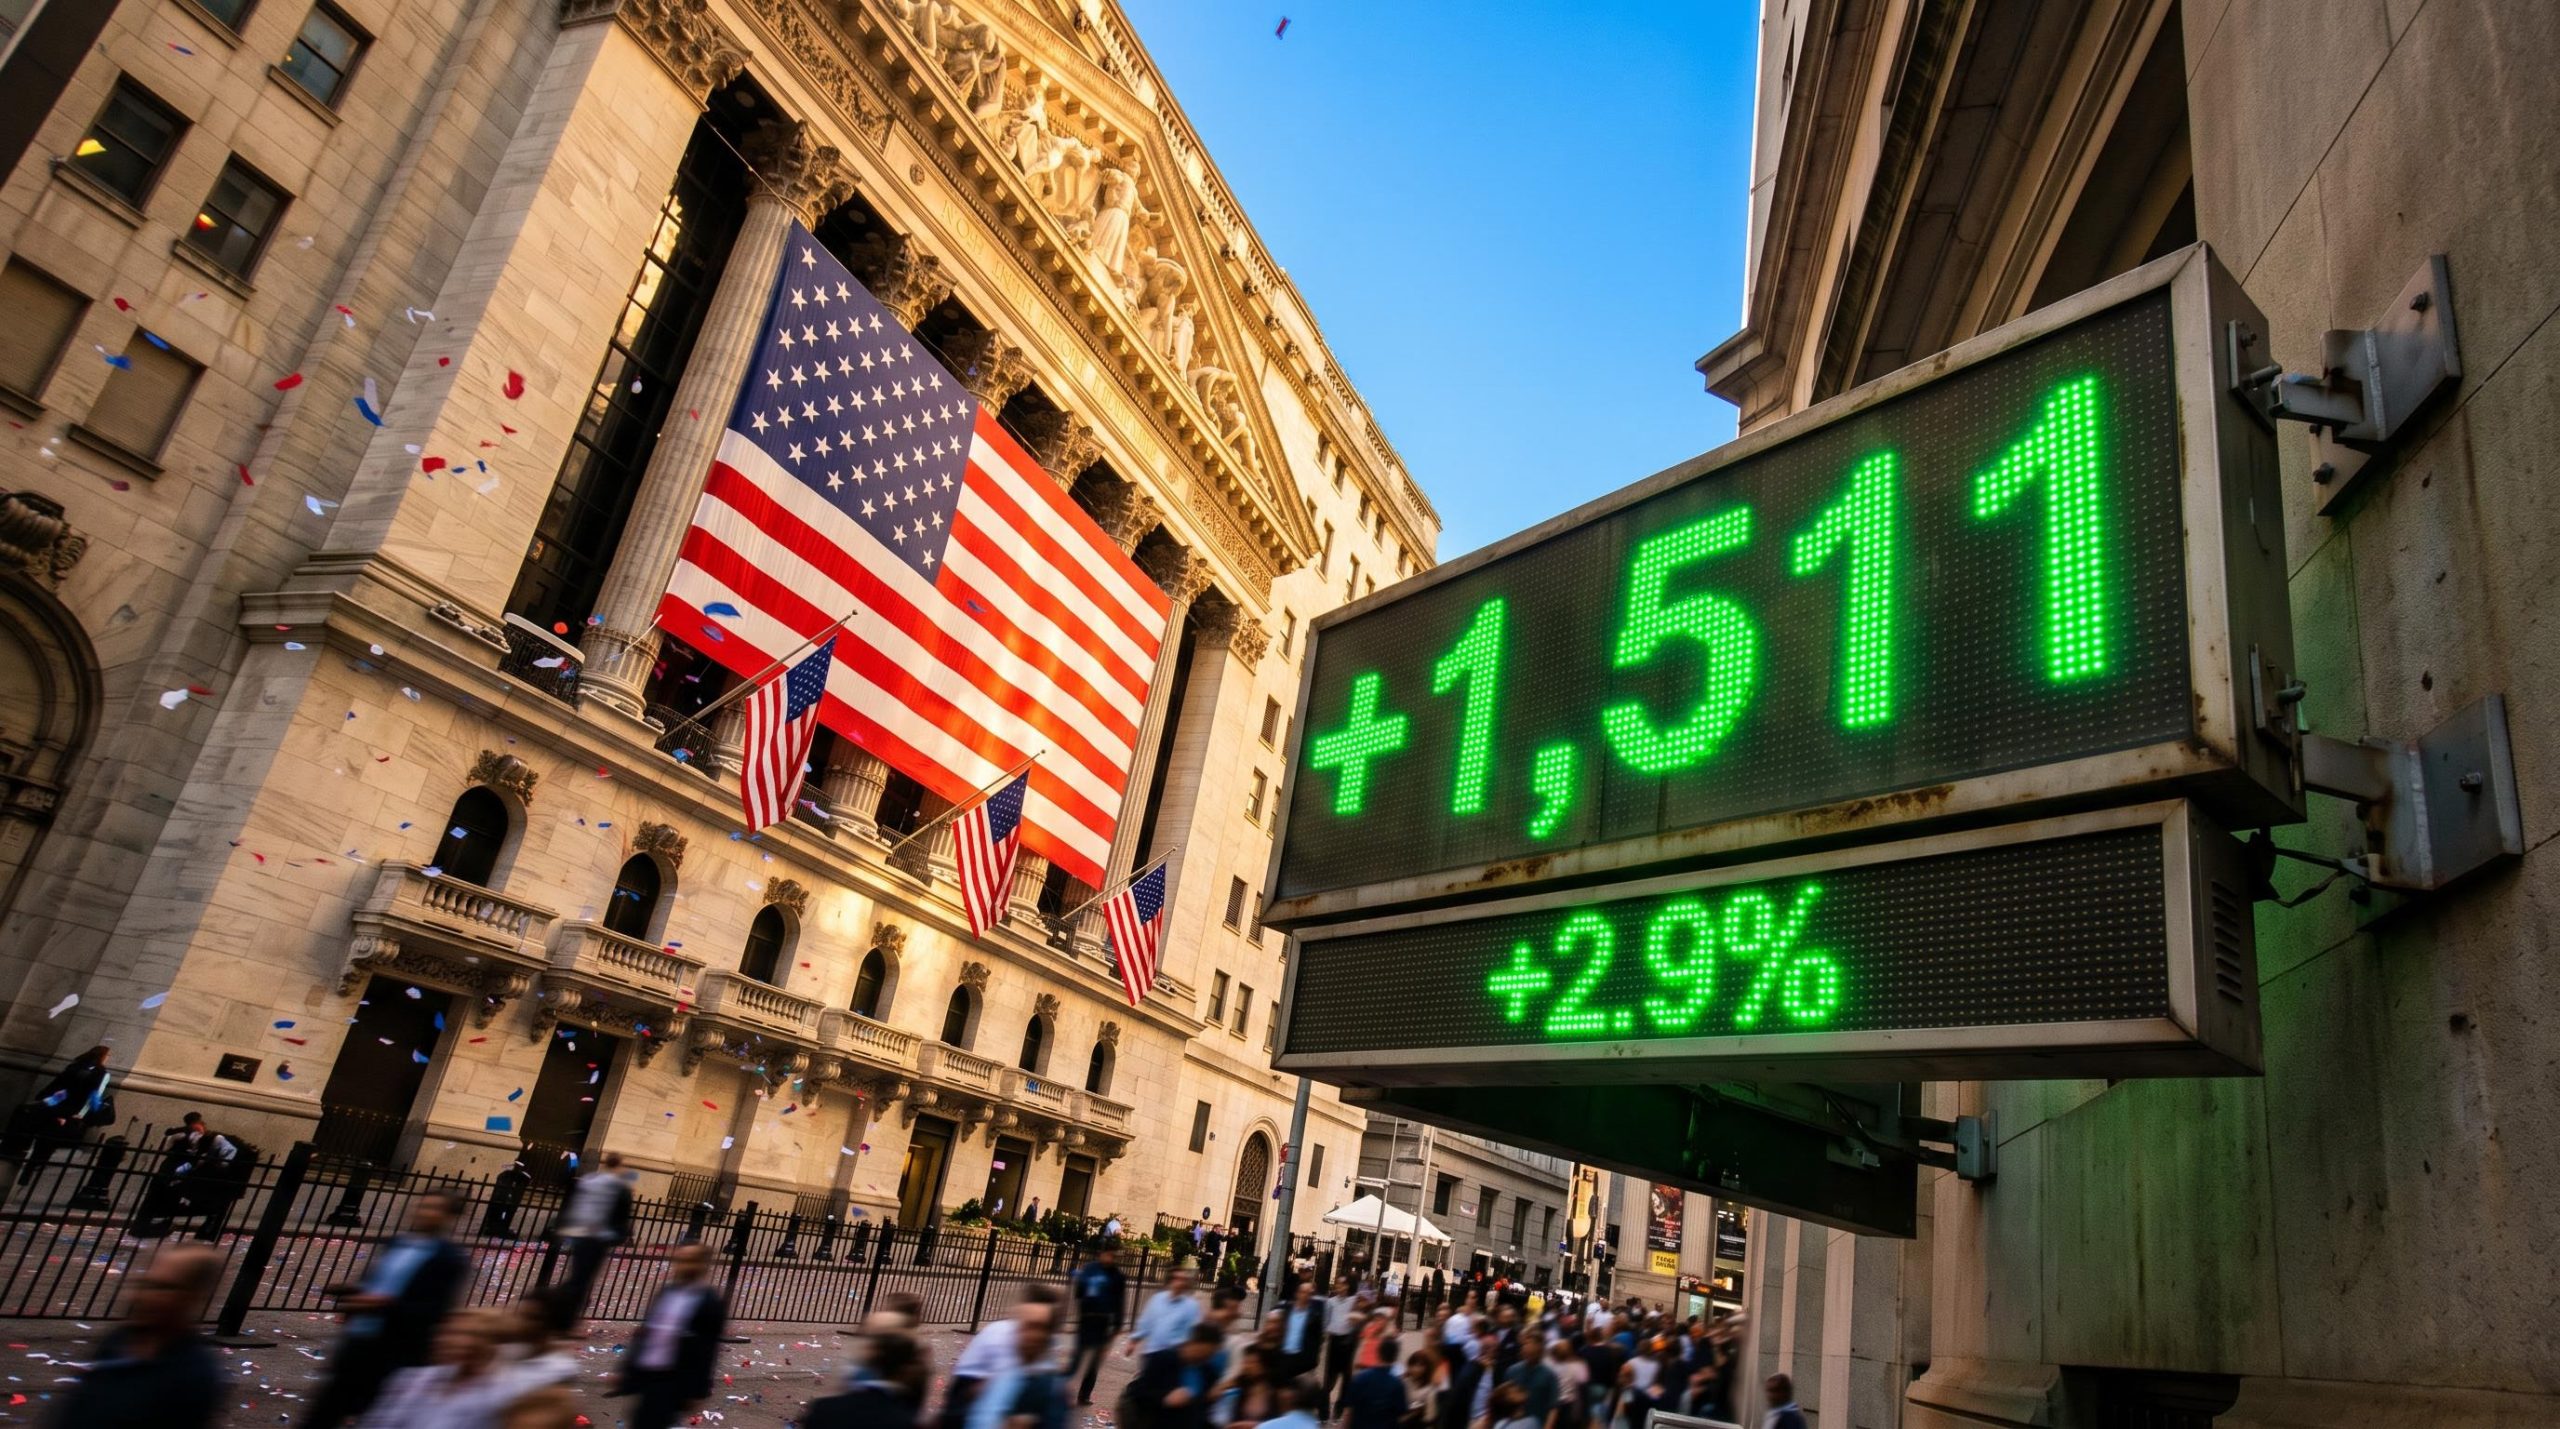
The Dow Jones Industrial Average closed 1,511 points higher on Wednesday, 4 November 2026, a 2.9% jump that turned the post-midterm market rally into one of the year’s largest single-day moves. Beneath that number, data centre, defence, energy and Musk-linked stocks fell, and veteran short seller Tim Knight was stopped out within hours.
The surge followed Democratic wins in both the House and the Senate. President Donald Trump accepted the result quickly and said Democrats had done a “good job”, according to Reuters. That concession removed the recount and litigation risk that had kept markets on edge overnight.
The session answers three questions: where the money actually moved, what one experienced trader got wrong, and which dates over the next fortnight could test the gains.
Why did stocks surge after the midterm result?
The move was large, and it was broad. ABC News reported the Dow up 2.9%, the S&P 500 up 1.8% and the Nasdaq Composite up 2.1%. CNBC put the Dow’s intraday peak at 1,646 points before it settled at the close.
| Index | 3 November 2026 | 4 November 2026 |
|---|---|---|
| Dow Jones Industrial Average | -0.3% | +2.9% (+1,511 points) |
| S&P 500 | Not reported | +1.8% |
| Nasdaq Composite | +0.9% | +2.1% |
The tape turned abruptly. A day earlier the Dow had slipped 0.3%. On Wednesday, Apple, Amazon and Microsoft reportedly gained at least 6% each.
The explanation was not that Democrats are good for stocks.
The gridlock trade Reuters linked the rally to a lower political-risk premium, a Democratic Congress constraining Trump’s fiscal and defence agenda, and cheaper oil lifting airlines and leisure.
The 10-year Treasury yield eased to about 4.89% from about 4.933%, while West Texas Intermediate (WTI) crude fell about 8%. History offered a tailwind: BlackRock data show a 14.1% average six-month S&P 500 gain after midterms since 1970, and J.P. Morgan puts the fourth-quarter average at 6.4%. Yet Morgan Stanley said a Democratic sweep was already partly priced in.
What investors paid for on Wednesday was fewer policy surprises, not a party. Treat the move as a repricing of risk rather than a signal that the trend will run on its own.
Strategists had flagged before the vote that a Democratic Congress would matter most through sector channels such as healthcare funding and Treasury issuance, while the AI trade looked less election-sensitive because data centre approvals sit with states.
When big ASX news breaks, our subscribers know first
Who won and who lost beneath the index gains?
That repricing did not lift everything. Nearly every corner of the market rose except energy, but the losers clustered in specific themes.
Where the money went
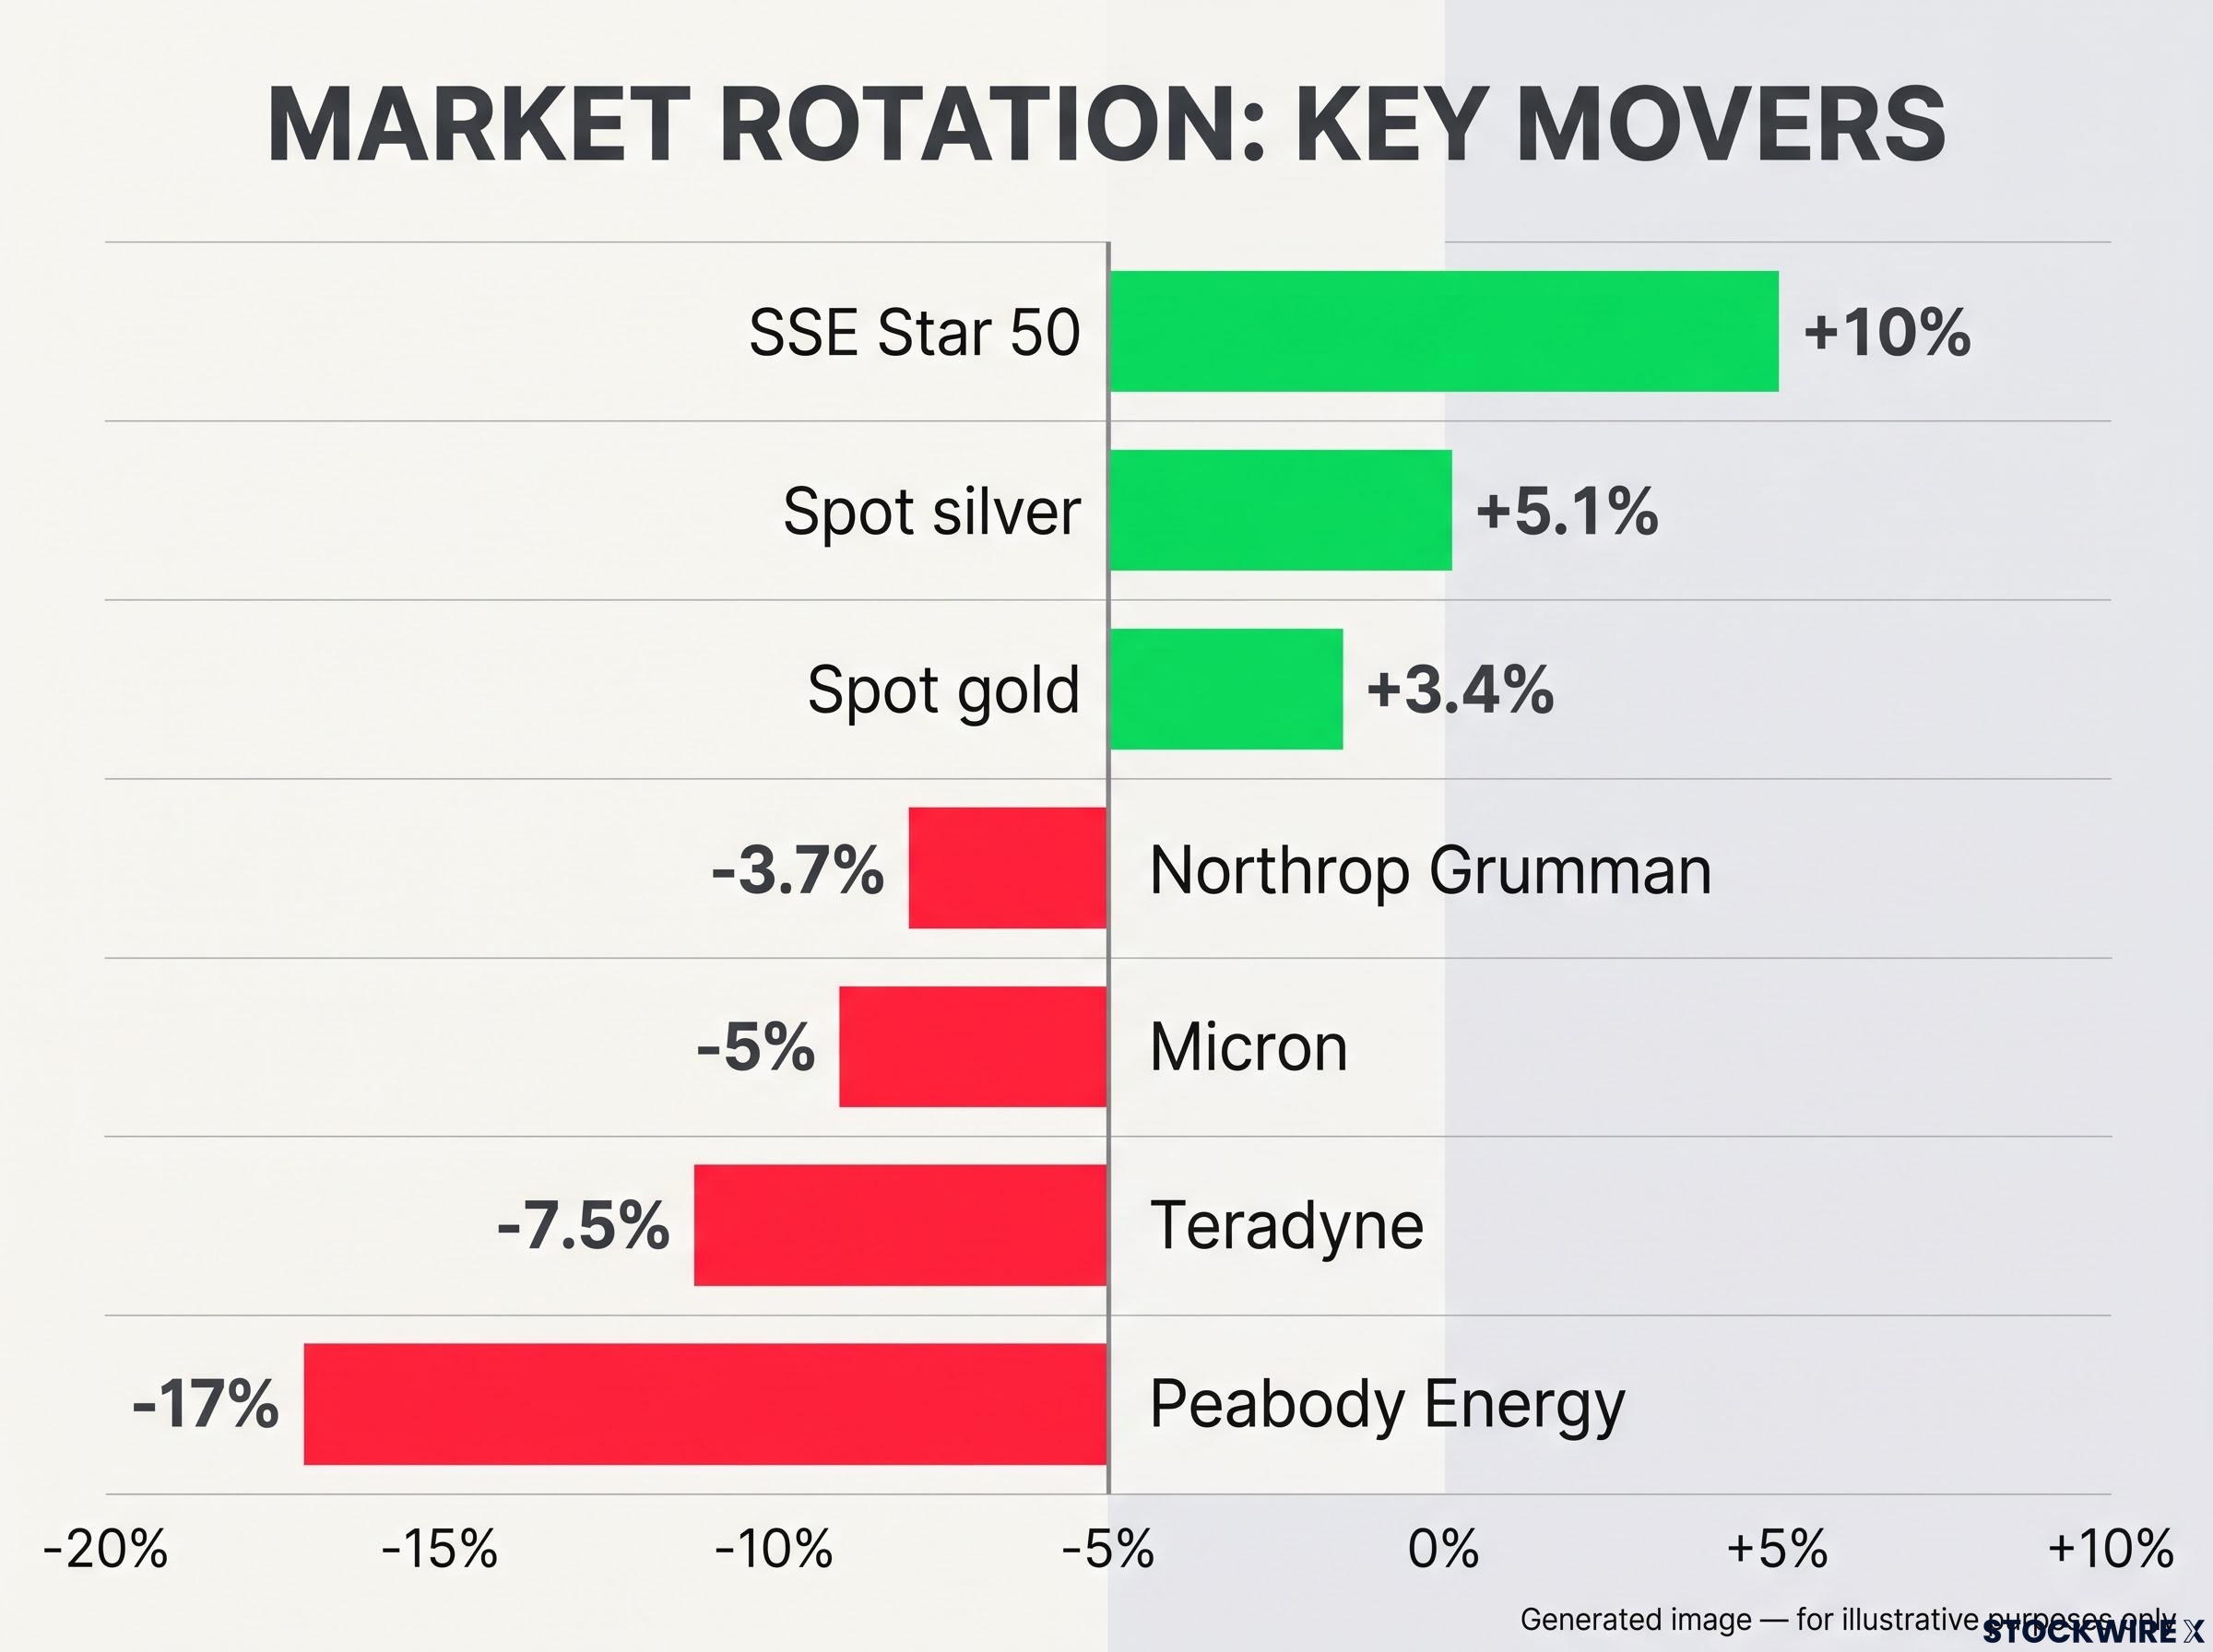
Solar and renewables, healthcare, airlines, cruise lines and leisure led, according to Investopedia. Precious metals ran harder. CNBC reported spot gold up 3.4% to $4,061.30 and spot silver up 5.1% to $52.29, driven by a weaker dollar, lower yields and softer expectations of fiscal expansion.
China joined in. Reuters reported the CSI New Energy Index up 3.5% and the SSE Star 50 up 10%, on expectations that US priorities may shift away from defence and fossil fuels.
Where it left
Data centres sold off on the prospect of tougher scrutiny and local moratoriums, with Texas and Georgia flagged as key markets. Goldman Sachs said Democratic state-level wins could make moratoriums more likely, potentially affecting about 45% of planned US data-centre capacity. Chipmakers followed: Micron fell about 5% and Teradyne about 7.5%.
State-level moratoriums are already law in places, with New York suspending large permits and Texas facing a grid-connection queue freeze, so the Democratic state wins add to an existing constraint rather than creating a new one.
Sources disagree on scale. CNBC reported the SMH semiconductor fund down about 1%, while Knight’s account put it down more than 3%, likely reflecting different points in the session.
| Asset or sector | Move | Driver |
|---|---|---|
| Spot gold | +3.4% | Weaker dollar, lower yields |
| Spot silver | +5.1% | Broad precious-metals buying |
| Energy ETFs (XOP, XLE) | About -7% and over -5% | Hopes of an end to the Iran conflict |
| Defence (Northrop, RTX, Lockheed, L3Harris) | Roughly -3% to -6% | $1.5 trillion defence budget harder to pass |
| SpaceX, Tesla | About -3.2%, -3.6% | Souring sentiment towards Elon Musk |
Northrop Grumman fell about 3.7%, Peabody Energy dropped more than 17%, and Trump Media (DJT) hit a new lifetime low. The SpaceX and Tesla figures above are intraday readings from Reuters and AP; Knight’s account had SpaceX down more than 5% and Tesla down 3%.
One reading holds that the split reflects a repricing of funding, regulation and project economics, not a rejection of AI. Either way, a rising index hid heavy losses in specific themes. Check your own exposure to data-centre, defence and energy names rather than trusting the headline close.
What did one short seller learn from being on the wrong side?
Knight’s session shows how that divergence plays out in a real portfolio. The rally negated the head-and-shoulders pattern (a chart formation traders read as a possible top) he had been watching on the S&P 500 fund. The Dow fund proved too strong to short, and his stop triggered quickly.
The housekeeping followed. A short on the FXI China fund, entered the day before without weighing the election’s China implications, was stopped out. He closed gold and December SPY puts at a loss, exited a bond-related short partly because of its size, and later regretted covering AXT and AOI as they kept falling.
His portfolio finished down a little over 2%, with 27 short positions against roughly 35 earlier. Some existing shorts still gained.
The core lesson Knight argued that knowing the election result in advance would not have delivered a profitable trade.
Practitioner guidance points the same way:
- Sizing: Vantage Markets advises fixed risk as a percentage of equity, not sizing by conviction.
- Stops: They cap planned losses but do not guarantee a fill when prices gap.
- Leverage: It magnifies a multi-percentage-point overnight move in both directions.
- Selectivity: Shorting into a relief rally invites a squeeze when index and stock direction diverge.
J.P. Morgan Asset Management adds that historical averages are not timing signals. The takeaway for you is that sizing and stop discipline matter more than predicting the event, especially when a single gap decides the day.
Which dates and risks could test the rally next?
The election is settled; the calendar is not. Three events sit directly ahead:
- Friday, 6 November 2026, 8:30 a.m. ET: October jobs report (Bureau of Labor Statistics).
- Tuesday, 10 November 2026, 8:30 a.m. ET: October consumer price index (CPI), the main US inflation gauge.
- Week of 16 November 2026: a possible Anthropic IPO, with timing subject to change.
| Date | Event | What a surprise could affect |
|---|---|---|
| 6 November | Jobs report | Yields, the dollar, Fed easing hopes |
| 10 November | CPI | Long-duration tech, gold, rate-sensitive stocks |
| Week of 16 November | Anthropic IPO | Sentiment across the AI complex |
Anthropic has reportedly filed confidentially for an offering of $100 billion or more at an indicative valuation of roughly $1.5-$2 trillion. OpenAI’s latest mainstream-reported round is about $20 billion at $1.25 trillion; a lower figure cited in Knight’s account remains unconfirmed. Before the vote, Morgan Stanley’s Mike Wilson warned that AI spending and liquidity constraints could feed a correction.
Pepperstone’s Chris Weston said falling yields and a softer dollar were supporting gold, drivers that hot data could reverse. CFRA’s Sam Stovall cautioned that stocks could still fall if earnings estimates are cut.
September inflation showed how sensitive equities are to price data, with a hot CPI print dragging the Nasdaq down nearly 2% in one session even as Treasury yields faded their jump, a useful precedent for 10 November.
Longer-horizon figures are kinder: Fidelity found the S&P 500 rose in 95% of 12-month periods after midterms since 1938, and Schwab found positive six-month returns in all 13 midterm periods since 1974. Past performance does not guarantee future results, and those averages say nothing about next week. A strong first day is exposed to profit-taking and hot data, so position size going into 6 and 10 November deserves deliberate thought.
What Wednesday settles, and what Friday and Tuesday will test
Wednesday removed the election as a source of uncertainty. It did not remove the rotation it exposed, with money leaving data centres, defence and energy even as the index soared.
The next tests arrive quickly: the jobs report on Friday, CPI on Tuesday and a possible Anthropic listing the week of 16 November. Each could move yields, the dollar and AI sentiment in ways that one relief rally cannot absorb.
Knight’s session is the useful guide. Size positions so that a single gap day cannot decide your outcome, whichever direction the next surprise runs.
This article is for informational purposes only and should not be considered financial advice. Investors should conduct their own research and consult with financial professionals before making investment decisions.