Morningstar gives the BetaShares Nasdaq 100 ETF (ASX: NDQ) five stars and a Negative Medalist Rating. It gives the iShares S&P Small-Cap ETF (IJR) two stars and a Silver Medalist Rating. If you assumed more stars meant a better fund, the NDQ vs IJR comparison suggests otherwise.
Neither result is a mistake. Each rating measures something different, and these two funds happen to sit at opposite ends of both measures.
This matters to a lot of people. Morningstar’s State of the Australian Investor 2026 report, built on Sharesight data from about 100,000 portfolios, lists NDQ among the four securities Australians hold most often. Many readers own it already or are thinking about buying it.
You will come away able to tell what each rating measures, why the two can point in opposite directions, and how to use a disagreement between them when you next compare ETFs.
Looking backward or looking ahead: what each rating tells you
It is natural to read both ratings as scores for “quality”. They are not. One shows you where a fund has been. The other is an analyst’s view of where it is likely to go.
How the Star Rating is built
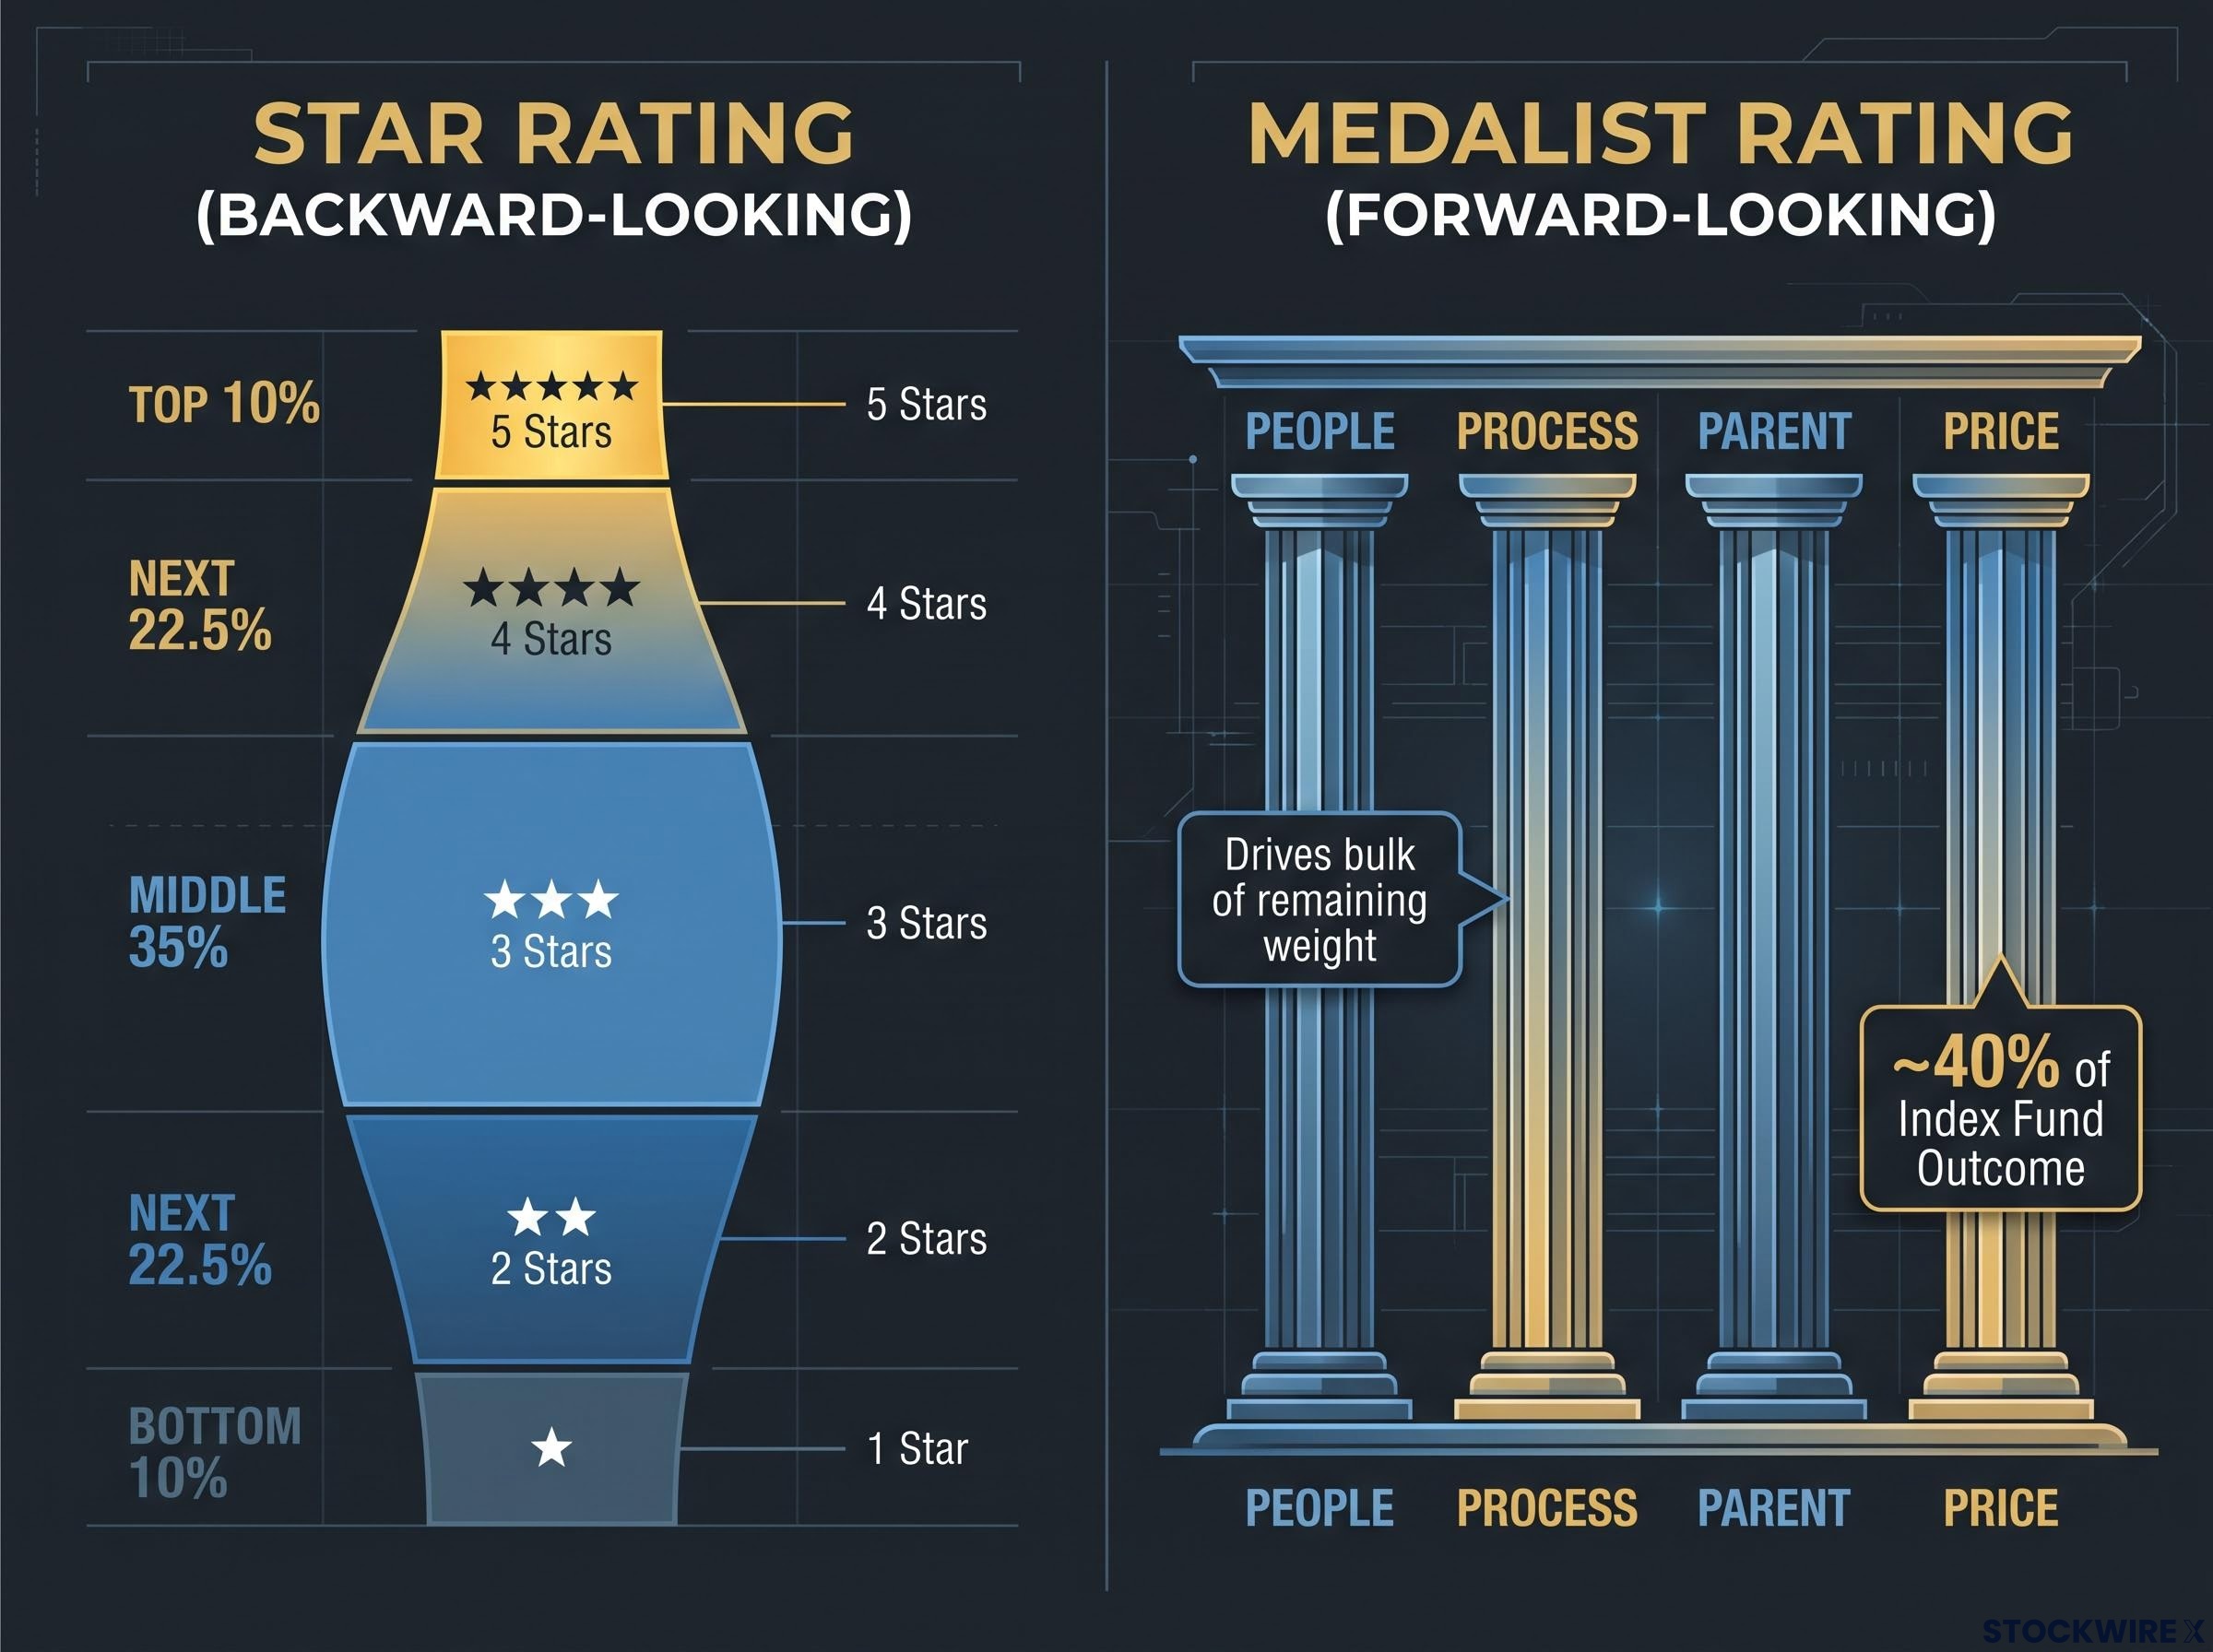
The Star Rating is calculated by formula, and no analyst sets it. It ranks a fund’s after-fee returns against its category peers over three, five and ten years. Funds lose points for volatility, especially sharp falls. The overall rating blends those periods.
Stars are handed out on a fixed curve. The top 10% of a category get five stars, the next 22.5% get four, the middle 35% get three, the next 22.5% get two, and the bottom 10% get one.
Because stars are relative, the comparison group does a lot of the work. Morningstar’s comparison article places both funds in the Equity North America category, but other research classifies them differently. Check the category before you read anything into the stars.
How the Medalist Rating is built
The Medalist Rating runs Gold, Silver, Bronze, Neutral and Negative. It is an analyst’s forward-looking view of whether a fund can beat its category after fees and risk over a full market cycle. It rests on four pillars:
- People: how capable and stable the decision-makers are
- Process: whether the strategy works and can be repeated
- Parent: how well the manager handles stewardship, resources and incentives
- Price: how competitive the fee is
When Morningstar rates index funds, cost accounts for roughly 40% of the outcome, while the way the index is constructed (the Process pillar) drives the bulk of what remains. Morningstar’s reasoning is that the index already sets the process, so cost and design matter most.
Under the April 2026 methodology update, the Price Score ranks a fund’s fee against category peers and carries heavy weight for passive funds, which is why a fee in the costliest fifth of a category can pull an otherwise sound index fund down the medal ladder.
| Feature | Star Rating | Medalist Rating |
|---|---|---|
| Basis | Formula using after-fee returns and volatility | Analyst assessment of four pillars |
| Time orientation | Backward-looking | Forward-looking |
| Who sets it | No analyst input | Morningstar analysts |
| What it rewards | Past ranking against category peers | Expected outperformance after fees and risk |
Treat stars as history and the Medalist Rating as opinion. Medals are not guarantees, and analysts can change them.
When big ASX news breaks, our subscribers know first
What explains NDQ’s top star score alongside a Negative outlook?
What earned the stars
The track record is hard to argue with. NDQ returned 21.5% a year over the ten years to 30 September 2026, one of the highest results in its category.
Ten years, two outcomes According to Morningstar, $10,000 in NDQ grew to about $70,400, while the category average grew the same amount to about $35,800 (distributions reinvested, after fees, before tax).
Shorter periods tell a similar story. In 2024, Australian commentary reported the Nasdaq-100 up about 31.7% and NDQ up about 36.1%.
What drives the Negative rating
Morningstar’s concerns are about how the fund is built and what it costs. Analysts rate its Process pillar Below Average for four reasons:
- Exchange membership decides entry. Only Nasdaq-listed companies qualify, so NYSE-listed giants such as Eli Lilly and ExxonMobil are left out. Morningstar sees no investment rationale in choosing stocks by where they list.
- No financials. Banks and insurers are excluded entirely.
- A 100-stock cap. A small number of holdings concentrates the portfolio.
- Market-cap weighting. The biggest winners grow into ever larger positions.
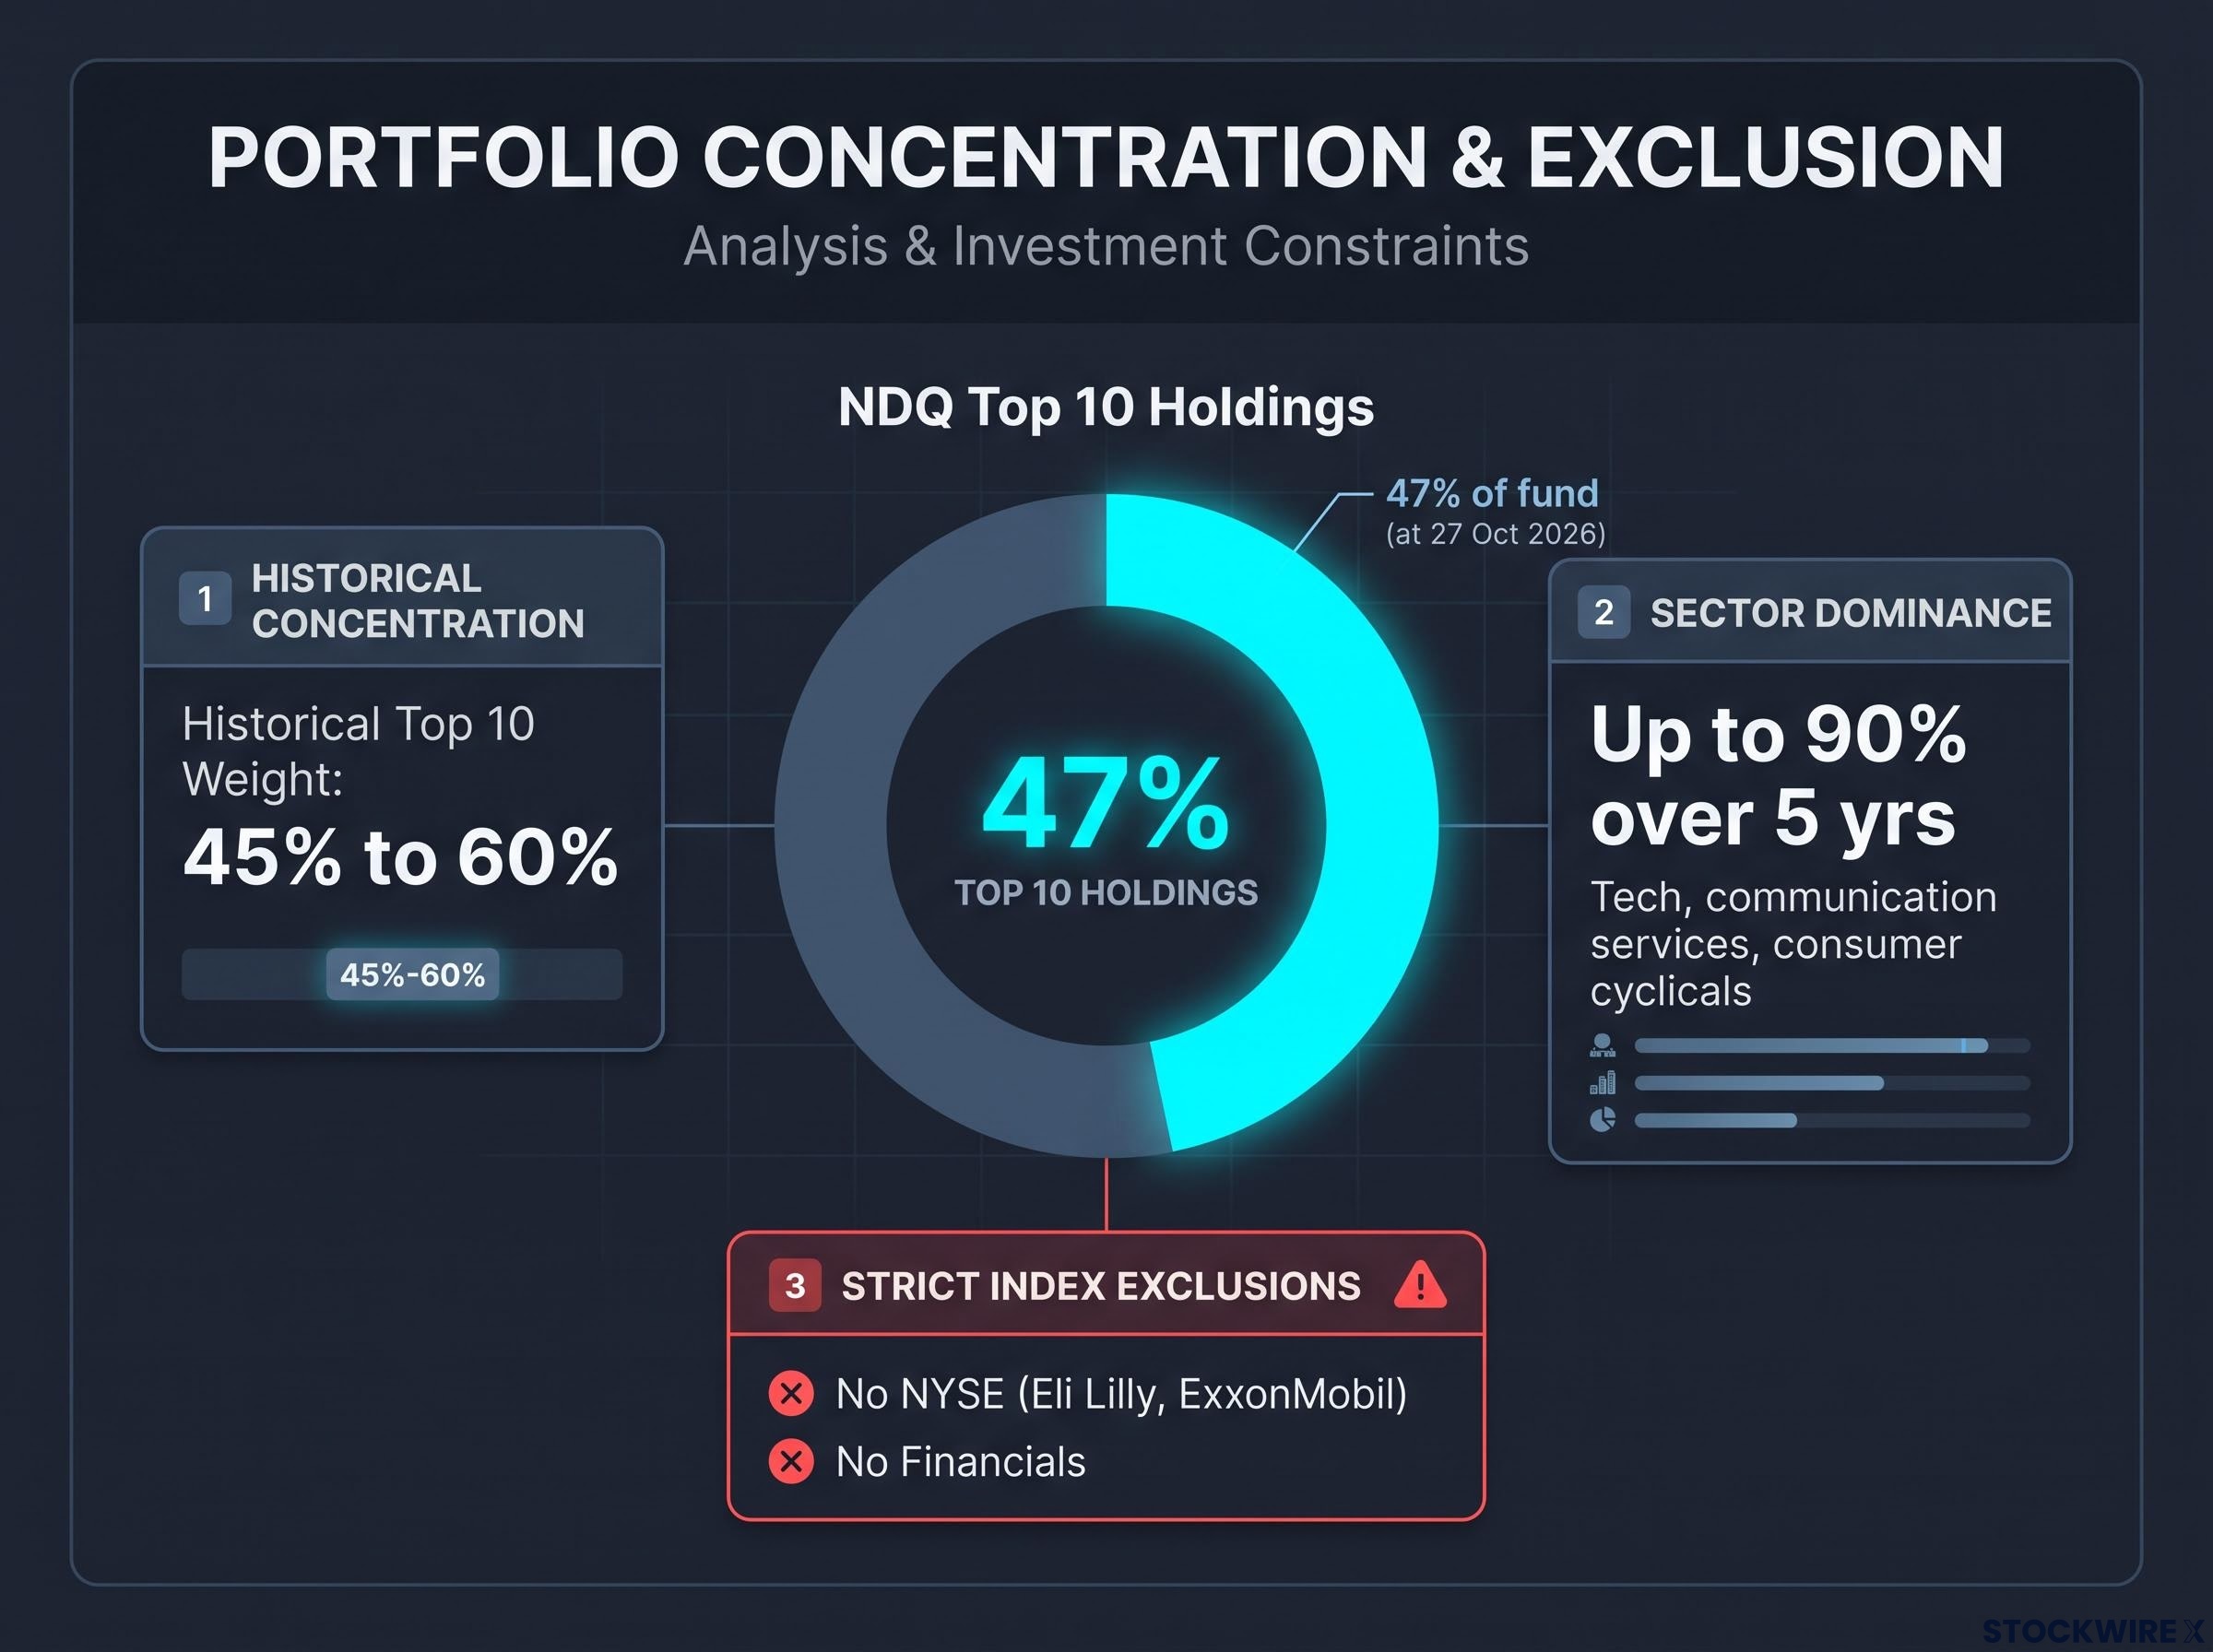
The effect shows up in the holdings. The top 10 made up 47% of the fund at 27 October 2026, and five of them were technology firms. Morningstar Australia says top-ten weight has generally run between 45% and 60%, and that technology, communication services and consumer cyclicals have represented as much as 90% of the index over five years.
A top 10 weight near 47% and a technology tilt of up to 90% of the index are examples of hidden concentration risk, and it grows when an investor also holds other tech-heavy funds alongside NDQ.
Cost matters too. NDQ’s 0.48% fee sits in the costliest fifth of its category, where the median is 0.31%. Invesco QQQ tracks the same index and is rated Neutral, helped by a lower fee.
| Metric | NDQ | IJR | QQQ |
|---|---|---|---|
| Star Rating | 5 stars | 2 stars | 5 stars (US Large Growth) |
| Medalist Rating | Negative | Silver | Neutral |
| Fee | 0.48% | 0.08% | 0.18% |
| Ten-year annual return to 30 Sep 2026 | 21.5% | 10.6% | Not reported |
Fee figures vary between sources: one puts IJR at 0.06%, and Invesco data puts QQQ at 0.20%.
There is a fair counterargument. Concentration in profitable technology leaders is exactly what has paid off. The weakness is conditional, so the structure works while mega-cap growth leads and becomes a liability if that leadership fades. If you hold NDQ, the five stars confirm the past was rewarding. The Negative rating tells you analysts doubt you will get the same payoff for the price and concentration you now carry.
How can IJR carry a Silver Medalist Rating with only two stars?
Two stars looks like a poor score for a fund Morningstar has called one of the best small-cap ETFs available. The explanation lies in who IJR is being compared against, not in how the fund is designed.
Why the stars look weak
IJR holds small US companies, but in Morningstar’s comparison it is ranked against a category dominated by funds that hold the largest US firms. Several things worked against it:
- Large-cap technology and mega-cap growth stocks substantially outperformed
- Smaller companies faced higher financing costs and greater sensitivity to the economy
- Small-cap earnings and valuations were more volatile
- The index’s profitability screen can exclude early-stage companies that later become big winners
The figures reflect this. IJR returned 10.6% a year over ten years, turning $10,000 into about $27,400 by 30 September 2026. Both funds scored High on risk because both fell heavily in poor months, and IJR’s return score was Low.
Why analysts still back the design
IJR tracks the S&P SmallCap 600. To join, companies generally need positive earnings in the latest quarter and positive combined earnings over the previous four quarters. That screen removes many persistently loss-making businesses, and analysts expect it to help the fund beat its category over a full market cycle.
Analysts rate the index construction and the team Above Average. The fund holds more than 600 stocks, with the top 10 at about 5% at 26 October 2026. Among its category peers, only the cheapest 20% charge fees as low as this fund’s.
There are trade-offs. Smaller businesses have tended to swing more in price, and because the index removes a company once it grows too large, the fund may not capture all the upside from its strongest performers. IJR’s two stars tell you its recent ranking was poor against its peer group, not that its index is flawed, so do not dismiss it on the star count alone.
How should you read both ratings together?
Once you can see why the ratings clash, you can use that clash to make a decision. Work through it in this order:
- Check the category. Stars only mean something relative to the peers a fund is ranked against.
- Check the Medalist review date. Sources give different dates for NDQ’s review (6 May 2026 and 24 June 2026), so confirm the latest date on Morningstar.
- Inspect the fee. NDQ’s 0.48% is roughly six times IJR’s 0.08%.
- Read the index rules. Find out what gets a company in and what keeps it out.
- Look at holdings and sector weights. Concentration is easy to miss if you only look at the fund’s name.
- Decide the fund’s role. A core holding and a satellite bet should be judged differently.
Treat a disagreement as information, not an error.
Applied to these two funds, the ratings combine into two clear messages:
- NDQ: an excellent history, but concentrated exposure and a high fee make it a weaker forward-looking proposition than broader alternatives.
- IJR: weak recent results relative to its category, but a credible low-cost, profitability-screened process.
Morningstar’s own research supports reading both ratings rather than one. Higher-star funds have, on average, gone on to better outcomes, but this is not guaranteed. A 4 April 2024 Morningstar analysis showed that low-star funds can recover when process and management stay sound. Style leadership can also keep the purest large-growth funds looking better than broader ones for years.
Use stars to see how a fund performed among real peers, and the Medalist Rating to see what analysts expect. The call on fit, cost and risk is yours to make. The $10,000 figures above are illustrative, after fees, with distributions reinvested and before tax. Past performance is not a reliable guide to the future.
For readers wanting a repeatable process, our dedicated guide to evaluating any ETF before you commit capital runs mandate, holdings, costs and liquidity checks side by side.
What a rating clash should change about your next ETF decision
Stars record how a fund ranked in the past. Medalist Ratings give an analyst’s opinion about the future. NDQ and IJR show that both can be accurate at the same time.
Before you next weigh a fund by its star count, check four things: the category it is ranked in, its fee, its index rules and how concentrated its holdings are. A fund with a glowing record may be costly and narrow. A fund with a modest record may have sound design that has been out of favour.
This is general information only and does not take your personal circumstances into account. Consider your own objectives, or speak with a licensed financial adviser, before acting.
This article is for informational purposes only and should not be considered financial advice. Investors should conduct their own research and consult with financial professionals before making investment decisions. Past performance does not guarantee future results. Financial projections are subject to market conditions and various risk factors.