Blue-sweep odds climbed for most of 2026, and Democrats then won both chambers of Congress. Yet on Election Day, Nvidia, Micron and the Nasdaq all rose.
If rising Democratic odds really meant falling AI stocks, that is not how 3 November should have played out. The gap raises a fair question about prediction markets and the midterms: was the “blue odds up, AI stocks down” link ever as tight as its backers claimed?
The case for it came most clearly from Chris Brecher of tastylive’s Trading Trends. He argued that the slope of blue-sweep odds tracked weakness in Micron and the Nasdaq because traders expected tighter regulation under a Democratic Congress. The stakes were not small. Reuters reported more than $1.48 billion wagered on the midterms by Election Day.
Now that the result is known, you can test the thesis instead of guessing at it. This piece sets out which parts the evidence supports and which it does not. It also shows how you can use election odds as a trading input without trusting them more than they deserve.
What did the prediction markets midterms odds actually show in 2026?
The headline story is neat. In Brecher’s telling, blue-sweep odds rose from about 61% to about 78%, with roughly $173 million invested in prediction markets. A Democratic sweep went from plausible to probable, and AI stocks sagged as it did.
The verified numbers tell a messier version of that story. On 3 November, Fortune, Cointelegraph, DeFi Rate and others reported the following pre-result odds:
| Measure | Kalshi | Polymarket |
|---|---|---|
| Democratic House | ~93%-94% | ~94%-94.5% |
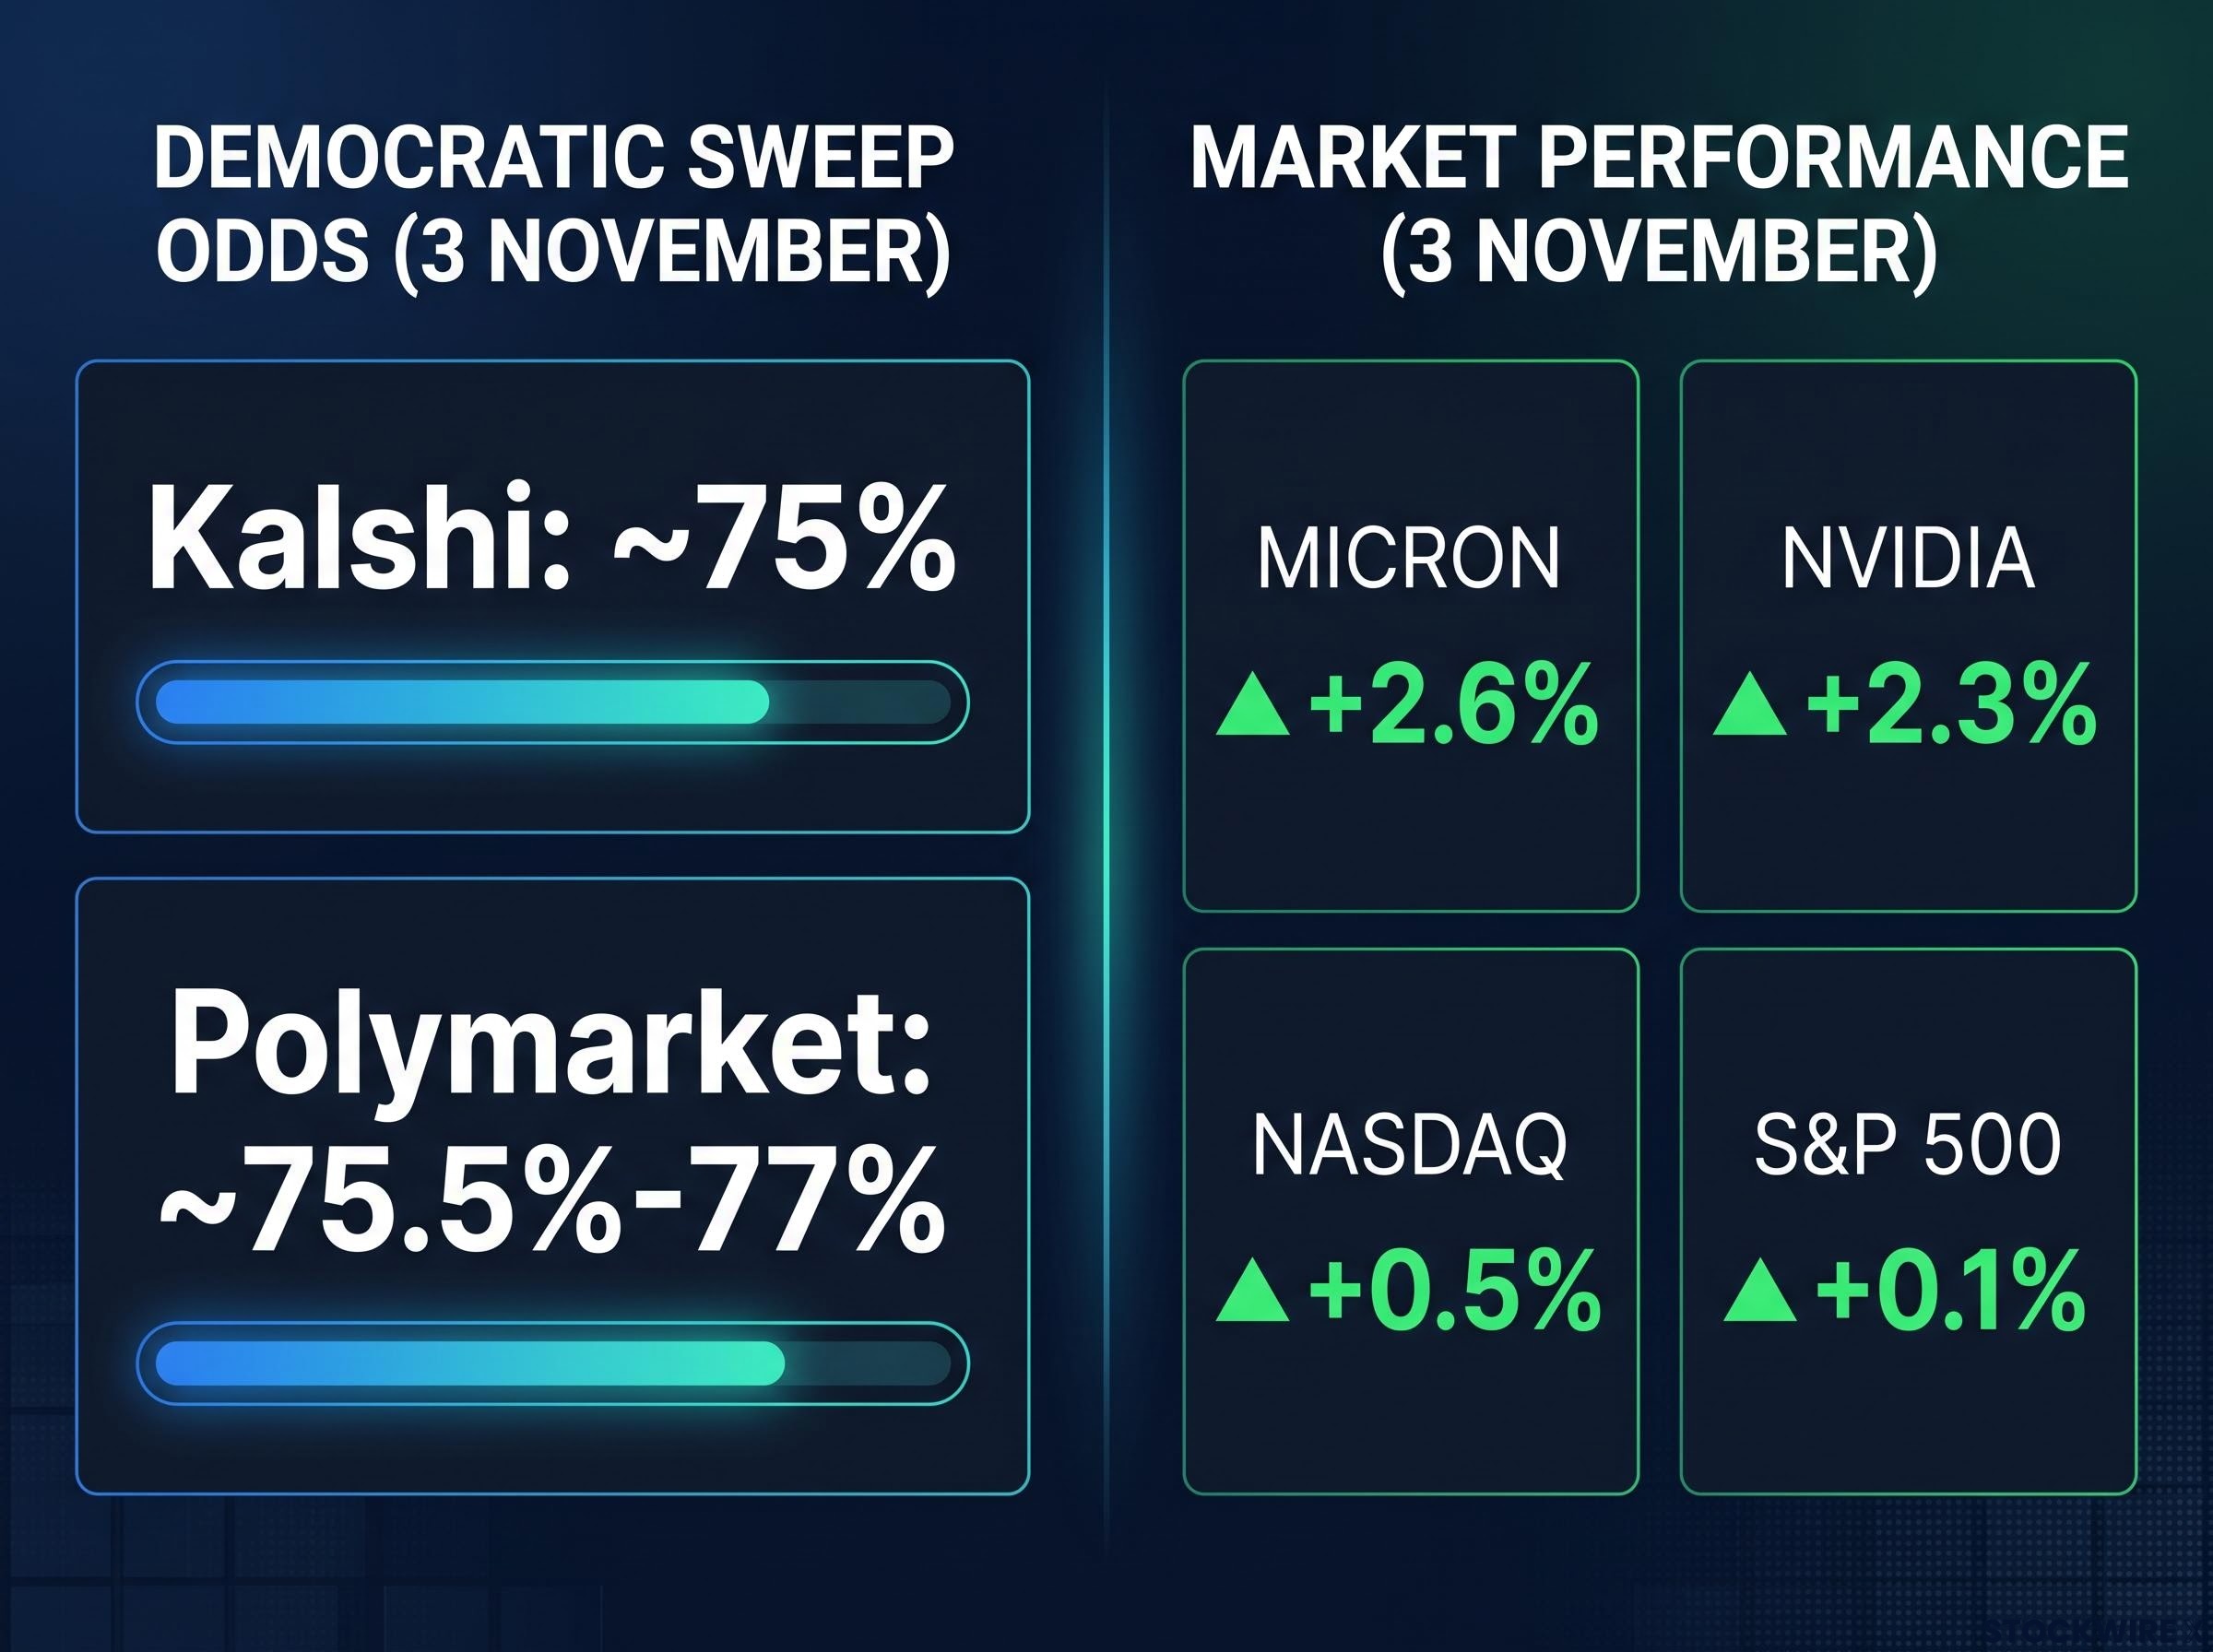
| Democratic Senate | ~73%-75% | ~75.5%-77% |
| Democratic sweep | ~75% | ~75.5%-77% |
The path to those levels also varied by source. Kalshi showed the sweep at 30% at the start of 2026 and 68% on 30 October. Polymarket sat near 70% on 30 October and about 72% on 2 November, while JPMorgan-related coverage cited 62% on 1 November.
None of those series runs cleanly from 61% to 78%. That is most likely a measurement difference: different platforms, contracts and timestamps produce different endpoints.
The money figures diverge for a similar reason. Fortune reported $251 million traded on congressional control at Kalshi, $181 million on House control and $112 million on the balance-of-power market.
Volume is not open interest Trading volume counts every contract bought and sold over time, so the same dollar can be counted many times. Open interest is the value of contracts still outstanding at one moment. The $1.48 billion is volume. Brecher’s $173 million may describe a narrower measure, such as one market’s open interest.
The result itself is clear. Reuters and AP reported on 4 November that Democrats won both chambers, and AP said at least seven Senate seats flipped.
For you, the direction of travel is solid enough to treat as a real shift in expectations. You should not quote the 61% and $173 million figures as established facts.
When big ASX news breaks, our subscribers know first
Why would a Democratic Congress hit AI stocks, and what did strategists say?
The proposed causal chain has four links. First, Democratic majorities step up investigations into AI safety, data collection and market concentration. Second, Congress and the states scrutinise data-centre power use, tax incentives and permitting.
Third, fewer subsidies or slower construction lower expected demand for chips, memory and networking gear. Fourth, softer AI earnings growth compresses valuations built on capital spending expectations. Capital spending (capex) means money a company invests in long-term assets like data centres.
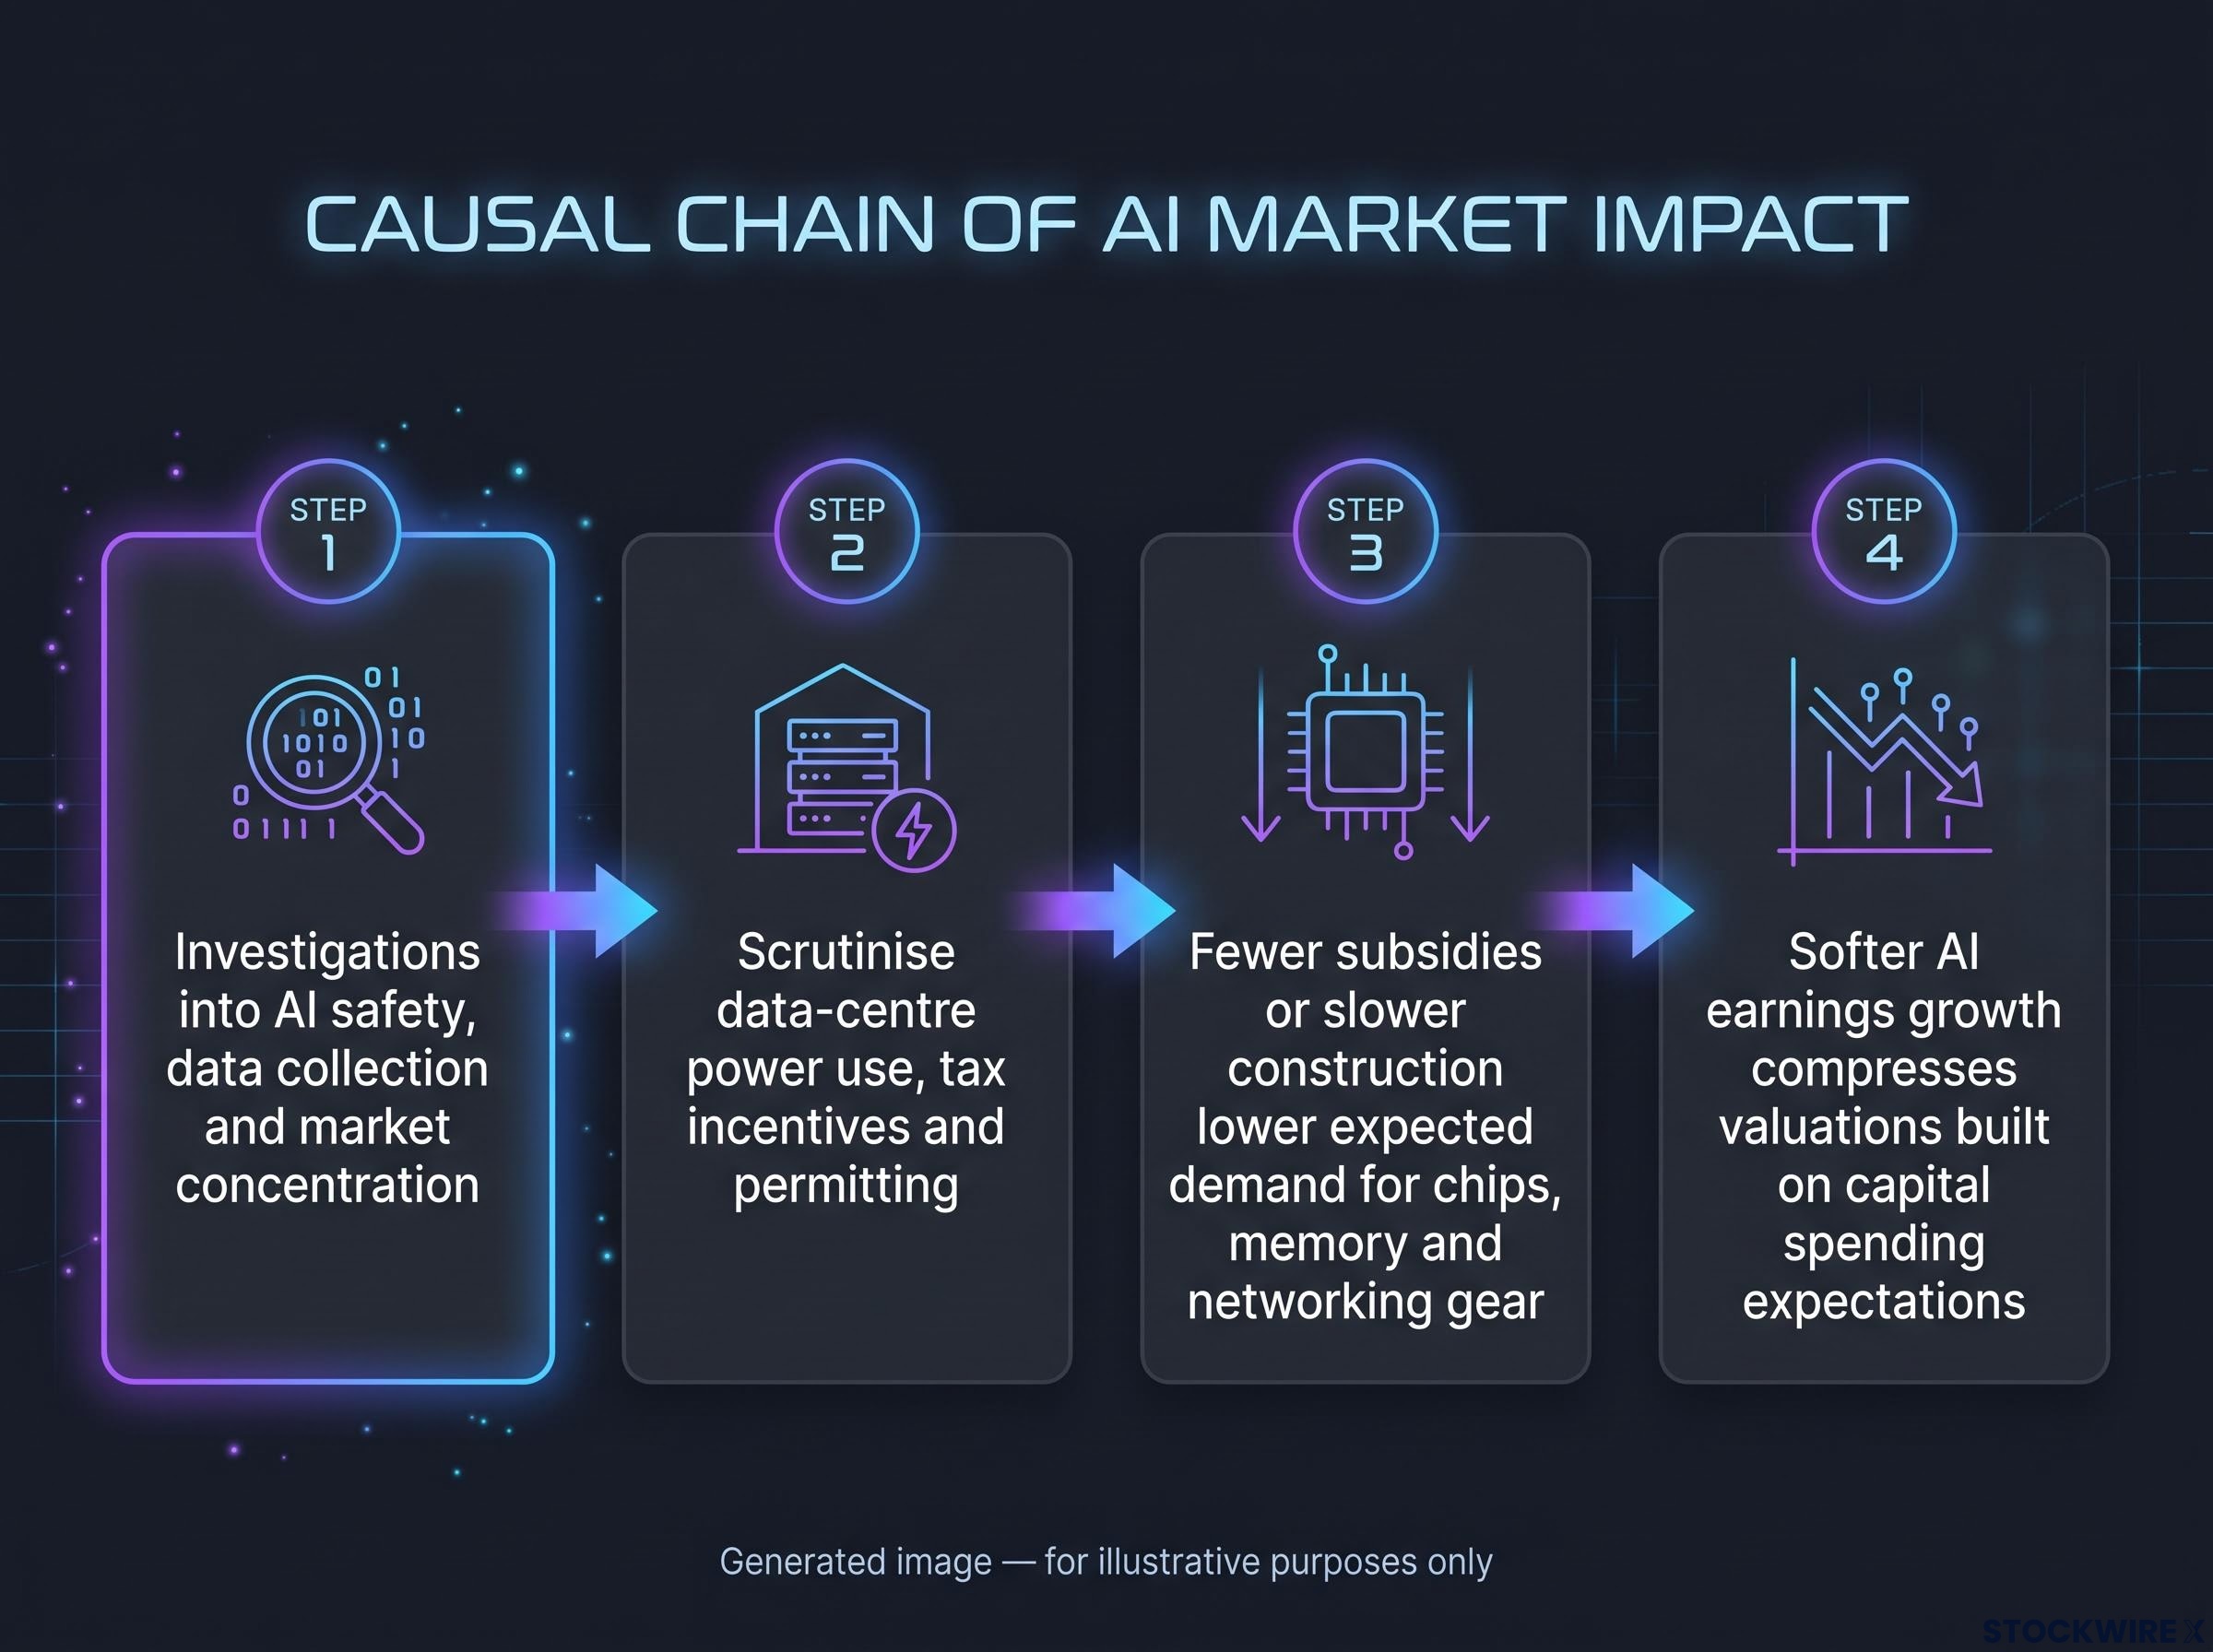
Each step is plausible. The strategists, though, trimmed the chain considerably.
| Institution | Reported view |
|---|---|
| JPMorgan | A blue wave could cut the S&P 500 by roughly 0.5% on the Wednesday after the election. |
| Goldman Sachs | Some data-centre tax incentives could be limited, but a nationwide moratorium is unlikely given bipartisan and veto constraints. |
| Goldman economists | State and local moratoria could affect about 45% of planned US data-centre capacity expansion. |
| Morgan Stanley | More oversight could slow regulatory easing; described as “incrementally negative” for AI sentiment. |
| Politico source | Democrats could scrutinise private-credit financing of AI expansion. |
Goldman and Morgan Stanley both saw sweeping federal limits as unlikely. Any major federal restriction would need bipartisan support and could face a presidential veto.
That shifts the pressure points. The regulatory risk to AI is more likely to show up at the state level and in data-centre economics than in sweeping federal law, which tells you where to look for evidence.
Structural versus cyclical explanations
AI weakness can come from lasting policy changes or from ordinary market cycles, and the two call for different responses:
- Structural: AI safety and antitrust investigations, limits on data-centre incentives, electricity and permitting constraints, and stricter disclosure or liability standards.
- Cyclical: stretched AI valuations, crowded positioning, interest-rate expectations, earnings disappointments and profit-taking after a strong rally.
Reuters reported semiconductors rebounding on Election Day after a several-session decline. That weighs against treating the election as the sole explanation for AI weakness.
Truist’s work on the semiconductor cycle peak points to a valuation correction rather than a fundamental top, with chip indexes falling sharply while industry revenue forecasts kept rising, a cyclical explanation that competes with the political one.
Did the wealth-effect link to consumer and financial stocks hold up?
Brecher’s second argument deserves a fair hearing. The wealth effect is the tendency for people to spend more when their assets rise in value. If AI gains made equity owners feel richer, an AI sell-off could cool spending on travel, hotels and cards.
The names in his thesis included Marriott, Visa, JPMorgan, Goldman Sachs, Capital One, American Express, Home Depot and Royal Caribbean. He noted that the big banks and card issuers traded near lows on the day he discussed, even as S&P futures rose.
A separate regulatory channel also runs through consumer finance. A Democratic Congress could scrutinise card fees, interest rates and banking practices. The precedent is Dodd-Frank in 2010, which tightened capital rules and created the Consumer Financial Protection Bureau (CFPB).
The logic holds together. The evidence is thinner. The research found no complete same-period price series for these stocks and no quantified link between an AI decline and discretionary spending.
There are at least three competing explanations for financial-sector softness:
- Wealth effect: AI losses dent consumer confidence and spending.
- Regulation: expected scrutiny of fees and lending weighs on banks and card issuers.
- Slowing dealmaking: Reuters-related coverage said bank earnings suggested the trading and deal boom that lifted first-half results might be fading.
Brecher also said the S&P sat about 280 points above its 200-day moving average, with the Nasdaq right at its own. The 200-day moving average is the average closing price over the past 200 trading days. That positioning could not be independently verified.
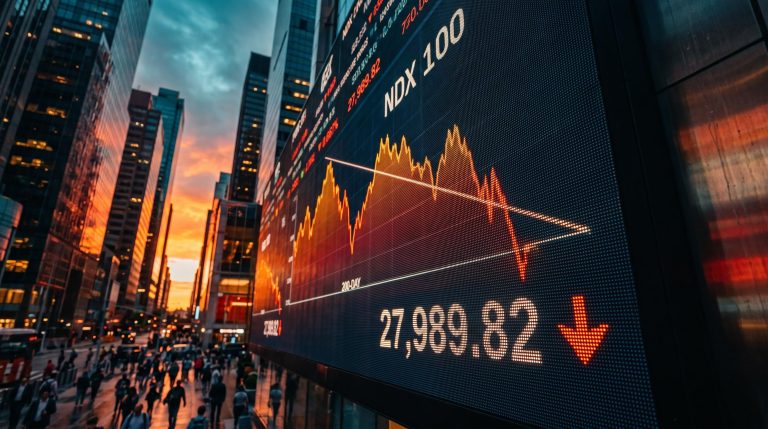
The Election Day contradiction On 3 November, Micron rose 2.6% and Nvidia 2.3% (Reuters reported 2.7%). The Nasdaq gained about 0.5% and the S&P 500 about 0.1%, even as a blue sweep looked near-certain.
If you hold the financials and consumer names that rallied this year, ask whether their weakness reflects AI exposure or simply slowing deal revenue and rates. Only then should you attribute it to the election.
How can traders use prediction markets as a cross-asset signal?
There is precedent for odds moving real money. As a Trump win grew more likely in 2024, Reuters reported that investors bought dollars, stocks and bitcoin and sold bonds. That “Trump trade” priced expected tax cuts, tariffs and deregulation.
Odds also reacted to news quickly. In September 2024, after a debate, PredictIt’s Harris contract rose to 55 cents from 53 cents, while Trump’s fell to 47 cents from 52 cents.
The lesson from 2024 is that traders used election markets as a directional input, not a pricing model. A workable checklist follows that principle:
- Check the platform and liquidity. Confirm how much is actually traded in the specific contract, not the headline total.
- Compare Kalshi and Polymarket. Agreement on direction matters more than any single level.
- Map your exposures to policy channels. Identify which holdings depend on data-centre incentives, permitting or consumer-finance rules.
- Test against rates and earnings. Ask whether bond yields or results explain the move better than politics.
- Size positions modestly. Treat any election-driven view as one input with a wide margin for error.
Where election odds mislead
The first trap is confusing volume with commitment, as the $1.48 billion versus $173 million gap shows. The second is shallow markets. An Anti-Corruption Data Collective analysis said a few thousand dollars could move some midterm forecasts; Kalshi called that baseless and said manipulation would cost more.
Thin liquidity and uneven participation help explain the divergence, since prediction market profit concentration means a small share of algorithmic and institutional accounts drives much of the activity that retail traders read as consensus.
Wired reported more than $600 million in Polymarket election trades after races had ended and discussed wash trading. Wash trading means buying and selling with yourself to create the look of activity. Reuters called this election a test of prediction-market reliability, and no reliable quantified midterm seasonality pattern exists to fall back on.
Rates and earnings can also simply overpower politics. Treat blue-sweep odds as a prompt to check specific exposures, not as a trigger to trade, because the evidence shows they inform direction but do not set prices.
What the midterm result changes for the AI trade, and what it does not
The result confirmed the political outcome. It did not confirm a mechanical market link.
- Supported: odds rose sharply, reaching about 75%-77% before the vote; Democrats won both chambers; more than $1.4 billion traded.
- Partly supported: JPMorgan’s modest expected S&P dip and slowing financial-sector earnings momentum.
- Not established: a clean 61%-78% series, $173 million as total market size, the 200-day positioning, complete same-period declines and a quantified wealth effect.
From here, the signals worth watching are state-level data-centre actions, the new Democratic oversight agenda, upcoming bank earnings and the rate path. Carry forward the mechanism worth monitoring, data-centre policy and its financing, rather than the correlation that failed to hold on Election Day.
Historical research on post-midterm equity returns suggests full opposition control of Congress has often coincided with strong 12-month performance, which is another reason a blue sweep need not translate into a lasting market drag.
This article is for informational purposes only and should not be considered financial advice. Investors should conduct their own research and consult with financial professionals before making investment decisions.