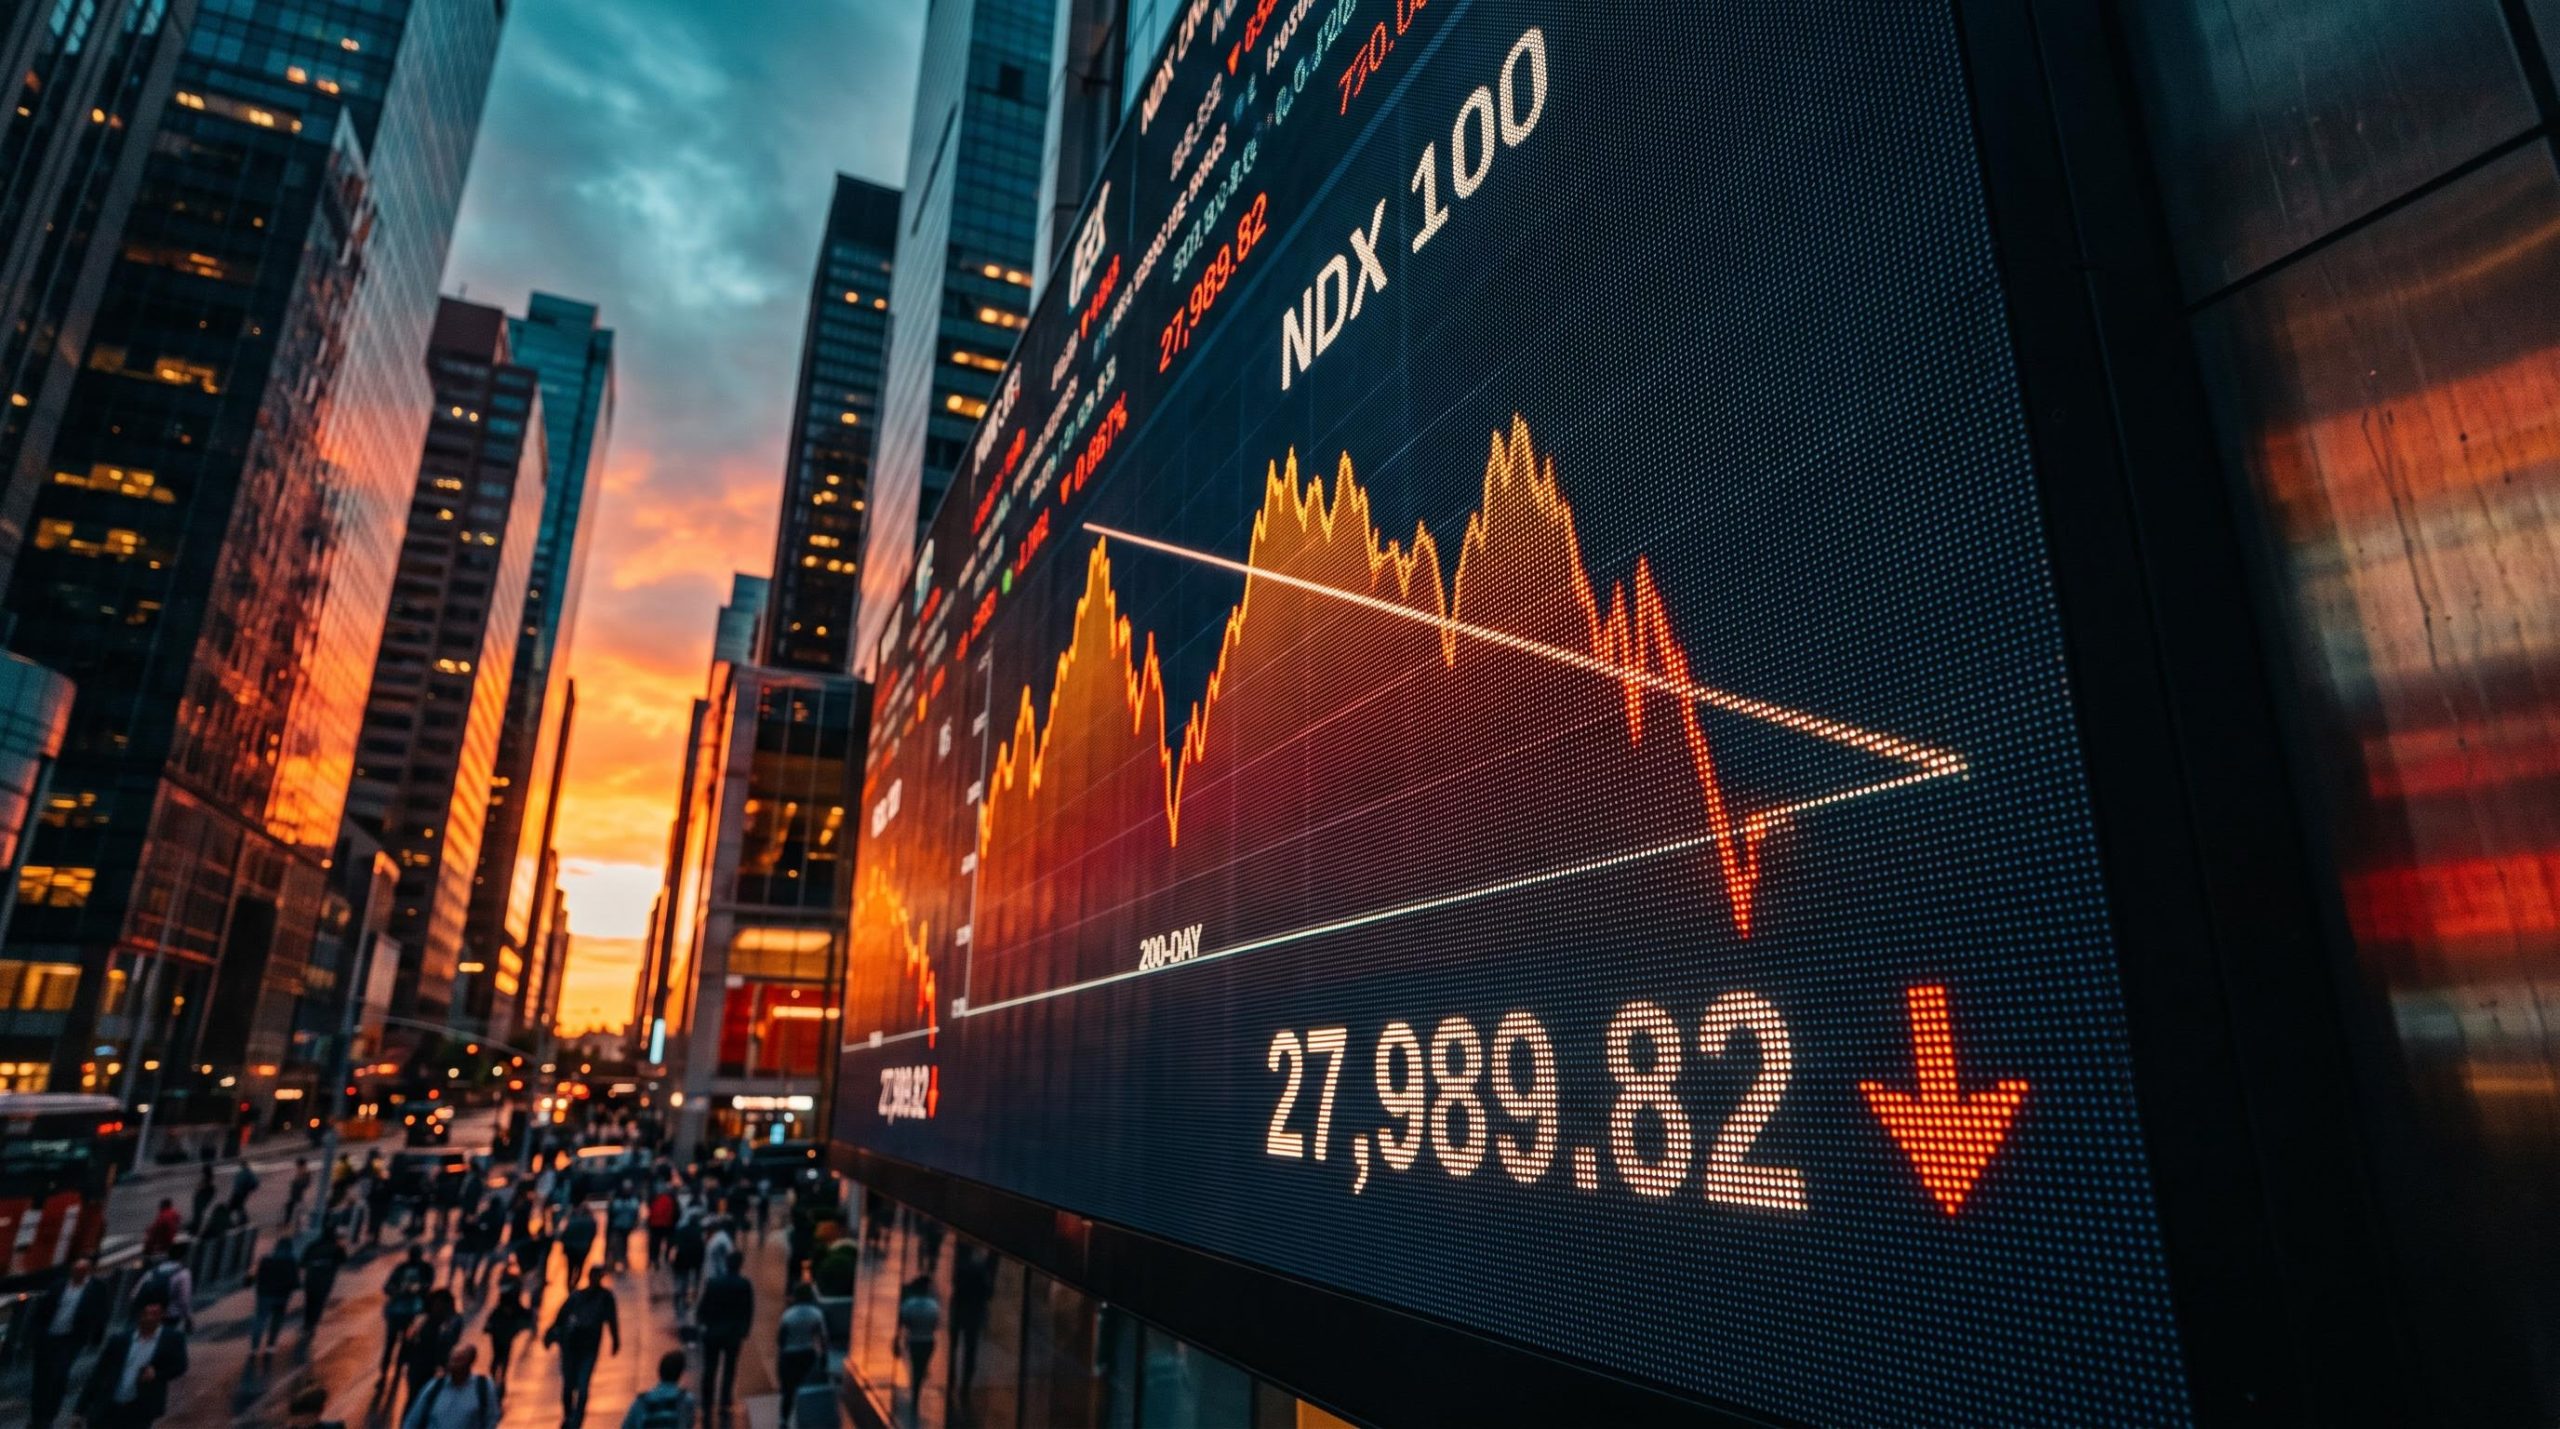
The Nasdaq-100 closed at 27,989.82 on 2 November 2026, 10.4% below its 6 October high of 31,224.47. That is a textbook-sized correction on paper, yet the broader Nasdaq Composite still sat about 1.2% above its 200-day average when it closed the next day. If you think the first trend line break means the pullback is over, the evidence suggests otherwise.
The labels themselves are simple. A drop of 10% from a peak is a correction, and a drop of 20% is a bear market.
The trouble is that those thresholds only describe what has already happened. They tell you nothing about whether the current Nasdaq correction will stop here or grow into a bear market, so you need tools that look at structure, support and time as well as depth.
Here is a three-tool framework for making that call: trend line behaviour, the weekly ATR trailing stop and extension compared with 2000. Each one is tested against real episodes from 2008 to 2024.
Why does a 10% drop so often fail to answer the question?
It is tempting to treat the percentage as the verdict. Ten percent means correction, twenty means bear, and the matter is settled.
The history does not support that. The 13.6% slide in 2024 and the 35.3% bear market of 2022 both passed through the same 10% mark on the way down. Katie Stockton of Fairlead Strategies argues that duration matters as much as depth. In her view, a fast 20% fall can reverse, while a drawn-out pattern of lower highs and lower lows is what marks a true bear market.
Here is where the two main indexes stood in the latest reports.
| Index | Latest close | All-time closing high | High date | Decline from high |
|---|---|---|---|---|
| Nasdaq Composite | 25,372.01 (3 Nov 2026) | 27,599.79 | 6 Oct 2026 | 8.1% |
| Nasdaq-100 | 27,989.82 (2 Nov 2026) | 31,224.47 | 6 Oct 2026 | 10.4% |
The Composite’s 200-day average stood near 25,073.21. Charles Schwab said the Nasdaq-100 was hovering just above its own 200-day line and had not closed below it since early April, although it briefly slipped underneath before bouncing. More than $2 trillion of Nasdaq-100 market value was reportedly wiped out in October.
The reported drivers behind the selling include:
- AI spending doubts: investors are questioning whether heavy infrastructure outlays will produce cash flow quickly enough.
- Iran and oil: Middle East tensions lifted oil prices and raised the risk of inflation.
- Treasury yields: the 10-year yield sat near 4.9%, which weighs on the valuations of long-duration tech stocks.
- Tariffs: trade costs are a threat to both margins and inflation.
Fidelity International sees two plausible readings. The selling could be a healthy rotation within a broadening bull market, or it could be the start of a wider equity correction. For you, the lesson is that a percentage figure is a label, not a forecast. You need a method for judging what comes next.
When big ASX news breaks, our subscribers know first
Why do trend line breaks tend to run to the 200-day average?
On a chart, the signal looks straightforward. Price slips through a rising line that held for months, and many traders conclude the damage is done. Chris Brecher argues they have it backwards.
Trend lines and moving averages only make sense once you are comfortable reading a stock chart across weekly and monthly timeframes, since every overlay is an interpretation of the same price and volume history, not a forecast.
The core claim According to Brecher, significant trend line breaks usually continue at least to the 200-day average (roughly the weekly 50) rather than ending at the break itself.
He points to the midterm years 2014 and 2018. He also cites the trend line from June 2025 to February 2026, which broke and led price to undercut the 200-day average as worries about Iran, oil and tariffs built.
The five forces behind the run
- Stop orders: traders who bought near the line often set stops just below it, and once those trigger they add selling pressure.
- Role reversal: the broken support line can turn into resistance, so rebounds stall beneath it.
- Institutional filters: many systematic and discretionary funds use the 200-day average as a risk gauge, so they keep selling until price reaches it.
- Profit-taking and reassessment: after a strong run, investors use the 200-day area as a common level at which to rethink valuation.
- Order clustering: buy and sell orders gather around moving averages and prior support, so price tends to travel quickly toward the next cluster.
Weekly 50 vs. 200-day: close, not identical
A year contains about 52 trading weeks, so a 50-week average covers roughly the same window as a 200-trading-day average. They are not exactly the same. Holidays, the sampling interval, how weekly closes are constructed, and whether an average is simple or exponential all create small gaps between the two. A simple average weights every period equally, while an exponential average gives more weight to recent prices.
The Composite still sits above its 200-day line. A close below it followed by failed retests would be far more bearish than a single close below. For you, the 200-day area is the real decision zone, not the trend line.
How does the weekly ATR trailing stop (9, 2.9) work, and what has it flagged before?
The second tool measures volatility rather than direction. Average True Range (ATR) is a measure of how far a price typically moves over a set number of periods. A trailing stop is an exit level that follows price as it rises but does not move back down.
With the default settings of 9 and 2.9, you take the nine-week ATR and multiply it by 2.9. The stop then sits that distance from price or from the recent extreme. StockCharts describes these as volatility-based overlays for entries and exits. In calm markets the stop sits close to price, and in wild markets it gives price more room.
Volatility-based exits work best inside a wider stop loss strategy that sizes each position from the stop backwards, so the planned loss is capped before the trade is placed and a gap through the level does less damage.
Brecher reports that the weekly Nasdaq stop has not been crossed. That means a longer-term bear market is not confirmed, although he says a topping formation is visible. Past signals show both what the tool can do and where it falls short:
- 2008: a monthly cross came before the financial crisis decline.
- 2022: an early-year cross, combined with a break of the weekly 50, came before a substantial fall.
- 2024: a temporary cross occurred and then reversed.
The 2024 counterexample The Nasdaq-100 fell 13.6% in 28 days (10 July to 7 August 2024) and never became a lasting bear market.
| Strengths | Limitations |
|---|---|
| Adapts to volatility instead of using a fixed percentage | Reactive, so it cannot predict reversals |
| Gives an objective, rules-based exit | Price gaps can jump straight past the stop |
| Keeps you in trends longer than short moving-average crossovers | Whipsaws in range-bound markets |
| Lets a volatile index fluctuate without forcing an early exit | A multiplier that suits one volatility regime may not suit another, and results shift with daily vs. weekly data and closes vs. highs/lows |
An uncrossed stop tells you there is no bear confirmation yet. Treat it as a filter, not a guarantee.
How do history and the 2000 comparison separate corrections from bear markets?
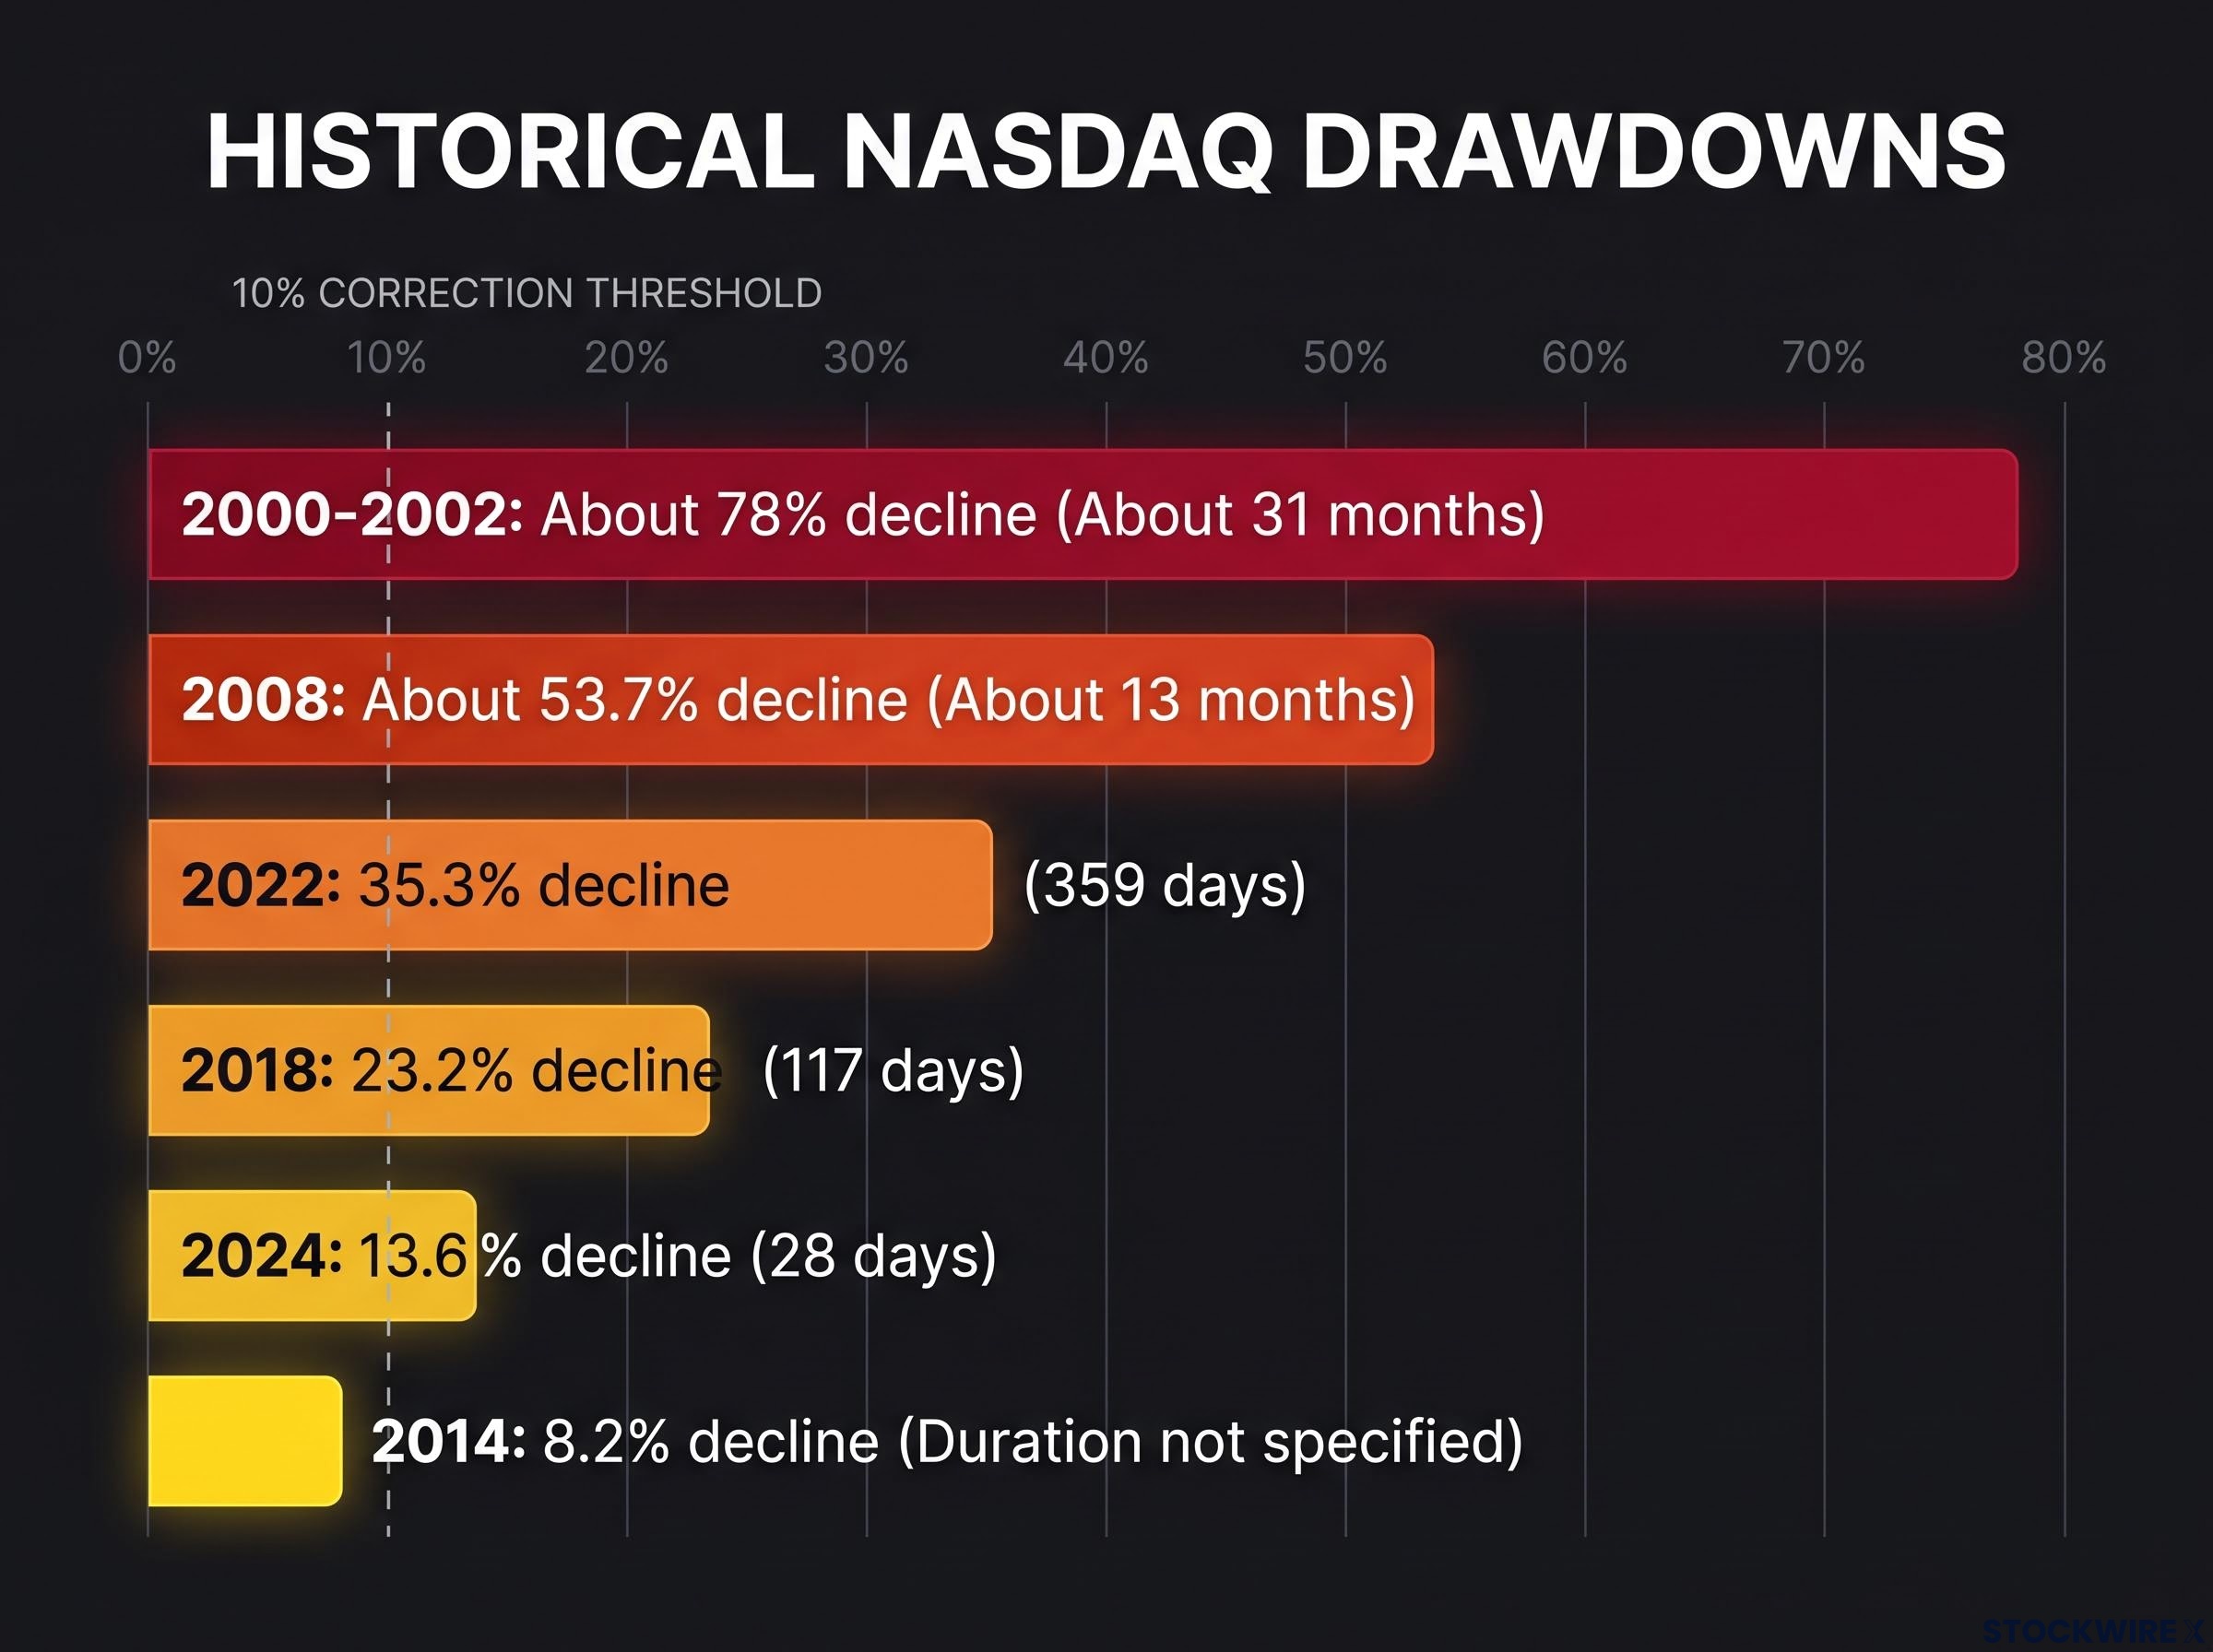
Put the six episodes side by side and the pattern shows itself. Most use the Nasdaq-100, while 2000-2002 refers mainly to the Composite. These are peak-to-trough drawdowns, which differ from calendar-year returns.
| Episode | Decline | Duration | Outcome | Series |
|---|---|---|---|---|
| 2008 | About 53.7% | About 13 months | Crisis bear market | Nasdaq-100 |
| 2014 | 8.2% | Not specified | Limited pullback | Nasdaq-100 |
| 2018 | 23.2% | 117 days (29 Aug to 24 Dec) | Bear-sized, then recovery | Nasdaq-100 |
| 2022 | 35.3% | 359 days (3 Jan to 28 Dec) | Bear market | Nasdaq-100 |
| 2024 | 13.6% | 28 days | Correction only | Nasdaq-100 |
| 2000-2002 | About 78% (about 82-83% Nasdaq-100) | About 31 months | Secular bear | Composite |
Bespoke Investment Group’s research, cited by CNBC in March 2022, found that typical Nasdaq bear markets lasted about 225 calendar days and fell roughly 30-35%. Every row in the table began with the same first 10%, and the outcomes ranged from a mild dip to a collapse.
Why 2000 was different
At its 2000 peak, the Nasdaq was reported to be about 156% above its 200-week average. A 2017 comparison put it at only about 29% above. No verified current 200-week figure was available as of 4 November 2026, so a precise comparison with today is not possible.
The warning signs in 2000 were:
- a parabolic price advance
- valuations stretched far beyond near-term earnings
- heavy concentration in a speculative tech theme
- a decisive loss of long-term support
- repeated failed rebounds
Brecher argues that the parabolic rise left little support below the market, and that today’s Nasdaq is less extended. The current episode shares some surface traits, including tech concentration and enthusiasm for AI. What separated the secular bear was extension and missing support, not the decline alone.
The comparison with 2000 also raises the issue of AI stock concentration, where the largest names now carry roughly a third of S&P 500 weight even though forward multiples sit well below dot-com peak levels.
What repeatable framework can you use to read the Nasdaq now?
Combine the tools into a routine you can run this week:
- Note the trend line break. Expect a run toward the 200-day average or weekly 50, not an immediate recovery.
- Watch behaviour at that zone. Sustained closes below it and failed rebounds would move the diagnosis toward a bear market.
- Check the weekly ATR stop (9, 2.9). A cross adds weight to the bear case, and no cross keeps the correction reading intact.
- Compare extension and support with 2000. A stretched market with thin support underneath is far more fragile.
- Check breadth. If weakness spreads beyond AI and high-valuation tech, the risk of a bear market rises.
| Signal | Correction reading | Bear reading |
|---|---|---|
| 200-day / weekly 50 | Holds or is reclaimed | Sustained closes below, failed retests |
| Weekly ATR stop | Not crossed | Crossed |
| Breadth | Weakness confined to AI and tech | Weakness spreads more widely |
Applied to the 3-4 November readings, the framework points to a serious correction that is testing major support, with no confirmed bear market. Schwab warns that losing July’s lows could expose the 2026 low near 22,840. Interactive Brokers’ Steve Sosnick traces the decline mainly to a reassessment of AI assumptions, and E-Trade’s Chris Larkin sees the longer-term bullish story as intact even though short-term momentum has been disrupted. Bespoke frames a fall of more than 10% in QQQ as correction status, not a bear market in itself.
Positioning adds another layer to the bear case, because forced selling risk rises when crowded long positions turn loss-making and margin calls, risk limits and redemptions begin to compel sales.
Brecher doubts a 20-30% decline is coming and expects any deeper bear move to unfold slowly. Keep the caveats in view. Moving averages lag, trend lines depend on which highs or lows you choose, and midterm seasonality (often a 5-8% drawdown between May and October) is a caveat, not a timing rule.
What the evidence supports today, and what would change the call
As of 4 November 2026, the evidence points to a technically serious correction, not a confirmed bear market. The Composite remains above its 200-day average, and the weekly ATR stop is intact.
The diagnosis would change on a few specific signals:
- a sustained close below the 200-day / weekly 50 area
- failed retests of that zone
- a cross of the weekly ATR stop
- a break below July’s lows
- earnings or credit stress spreading beyond AI
The next scheduled tests, according to Fidelity, are earnings season and whether geopolitics pushes oil inflation higher again. Keep running the full framework as each test arrives. No single indicator will make the call for you.
Past performance does not guarantee future results. Financial projections are subject to market conditions and various risk factors. These statements are speculative and subject to change based on market developments.
This article is for informational purposes only and should not be considered financial advice. Investors should conduct their own research and consult with financial professionals before making investment decisions.