Jess bought a $200 slice of Eli Lilly not long after she started investing in 2026. Within weeks she sold it and walked away with no profit. The share price did not scare her off. She sold because she had no way to decide whether to add, hold or sell.
That gap is common among people who are comfortable with ETFs. US exchanges now list more than 5,000 ETFs against roughly 4,200 individual stocks, so a fund can do most of the work for you. Picking individual stocks still has a place, though, as a small satellite around that diversified core.
Learning how to analyse stocks with a repeatable process gives you something guessing never will: a reason for every decision, written down before the market tests your nerve.
This guide gives you a seven-step checklist that tells you what to check before you buy, add or sell. It is drawn from a walkthrough by former portfolio manager Vic Harris of The Curve. Lilly runs through every step as an illustration, not a recommendation.
Where do you start when analysing a stock? Find the trend, then test the business
You do not start with a ticker. You start with the world and narrow it down until only one business is left in front of you.
Step 1: Spot the global trend
Harris begins with broad shifts such as AI, ageing populations and the push for longer, healthier lives. A company in a growing industry has a tailwind, which means demand rises around it even before it does anything clever.
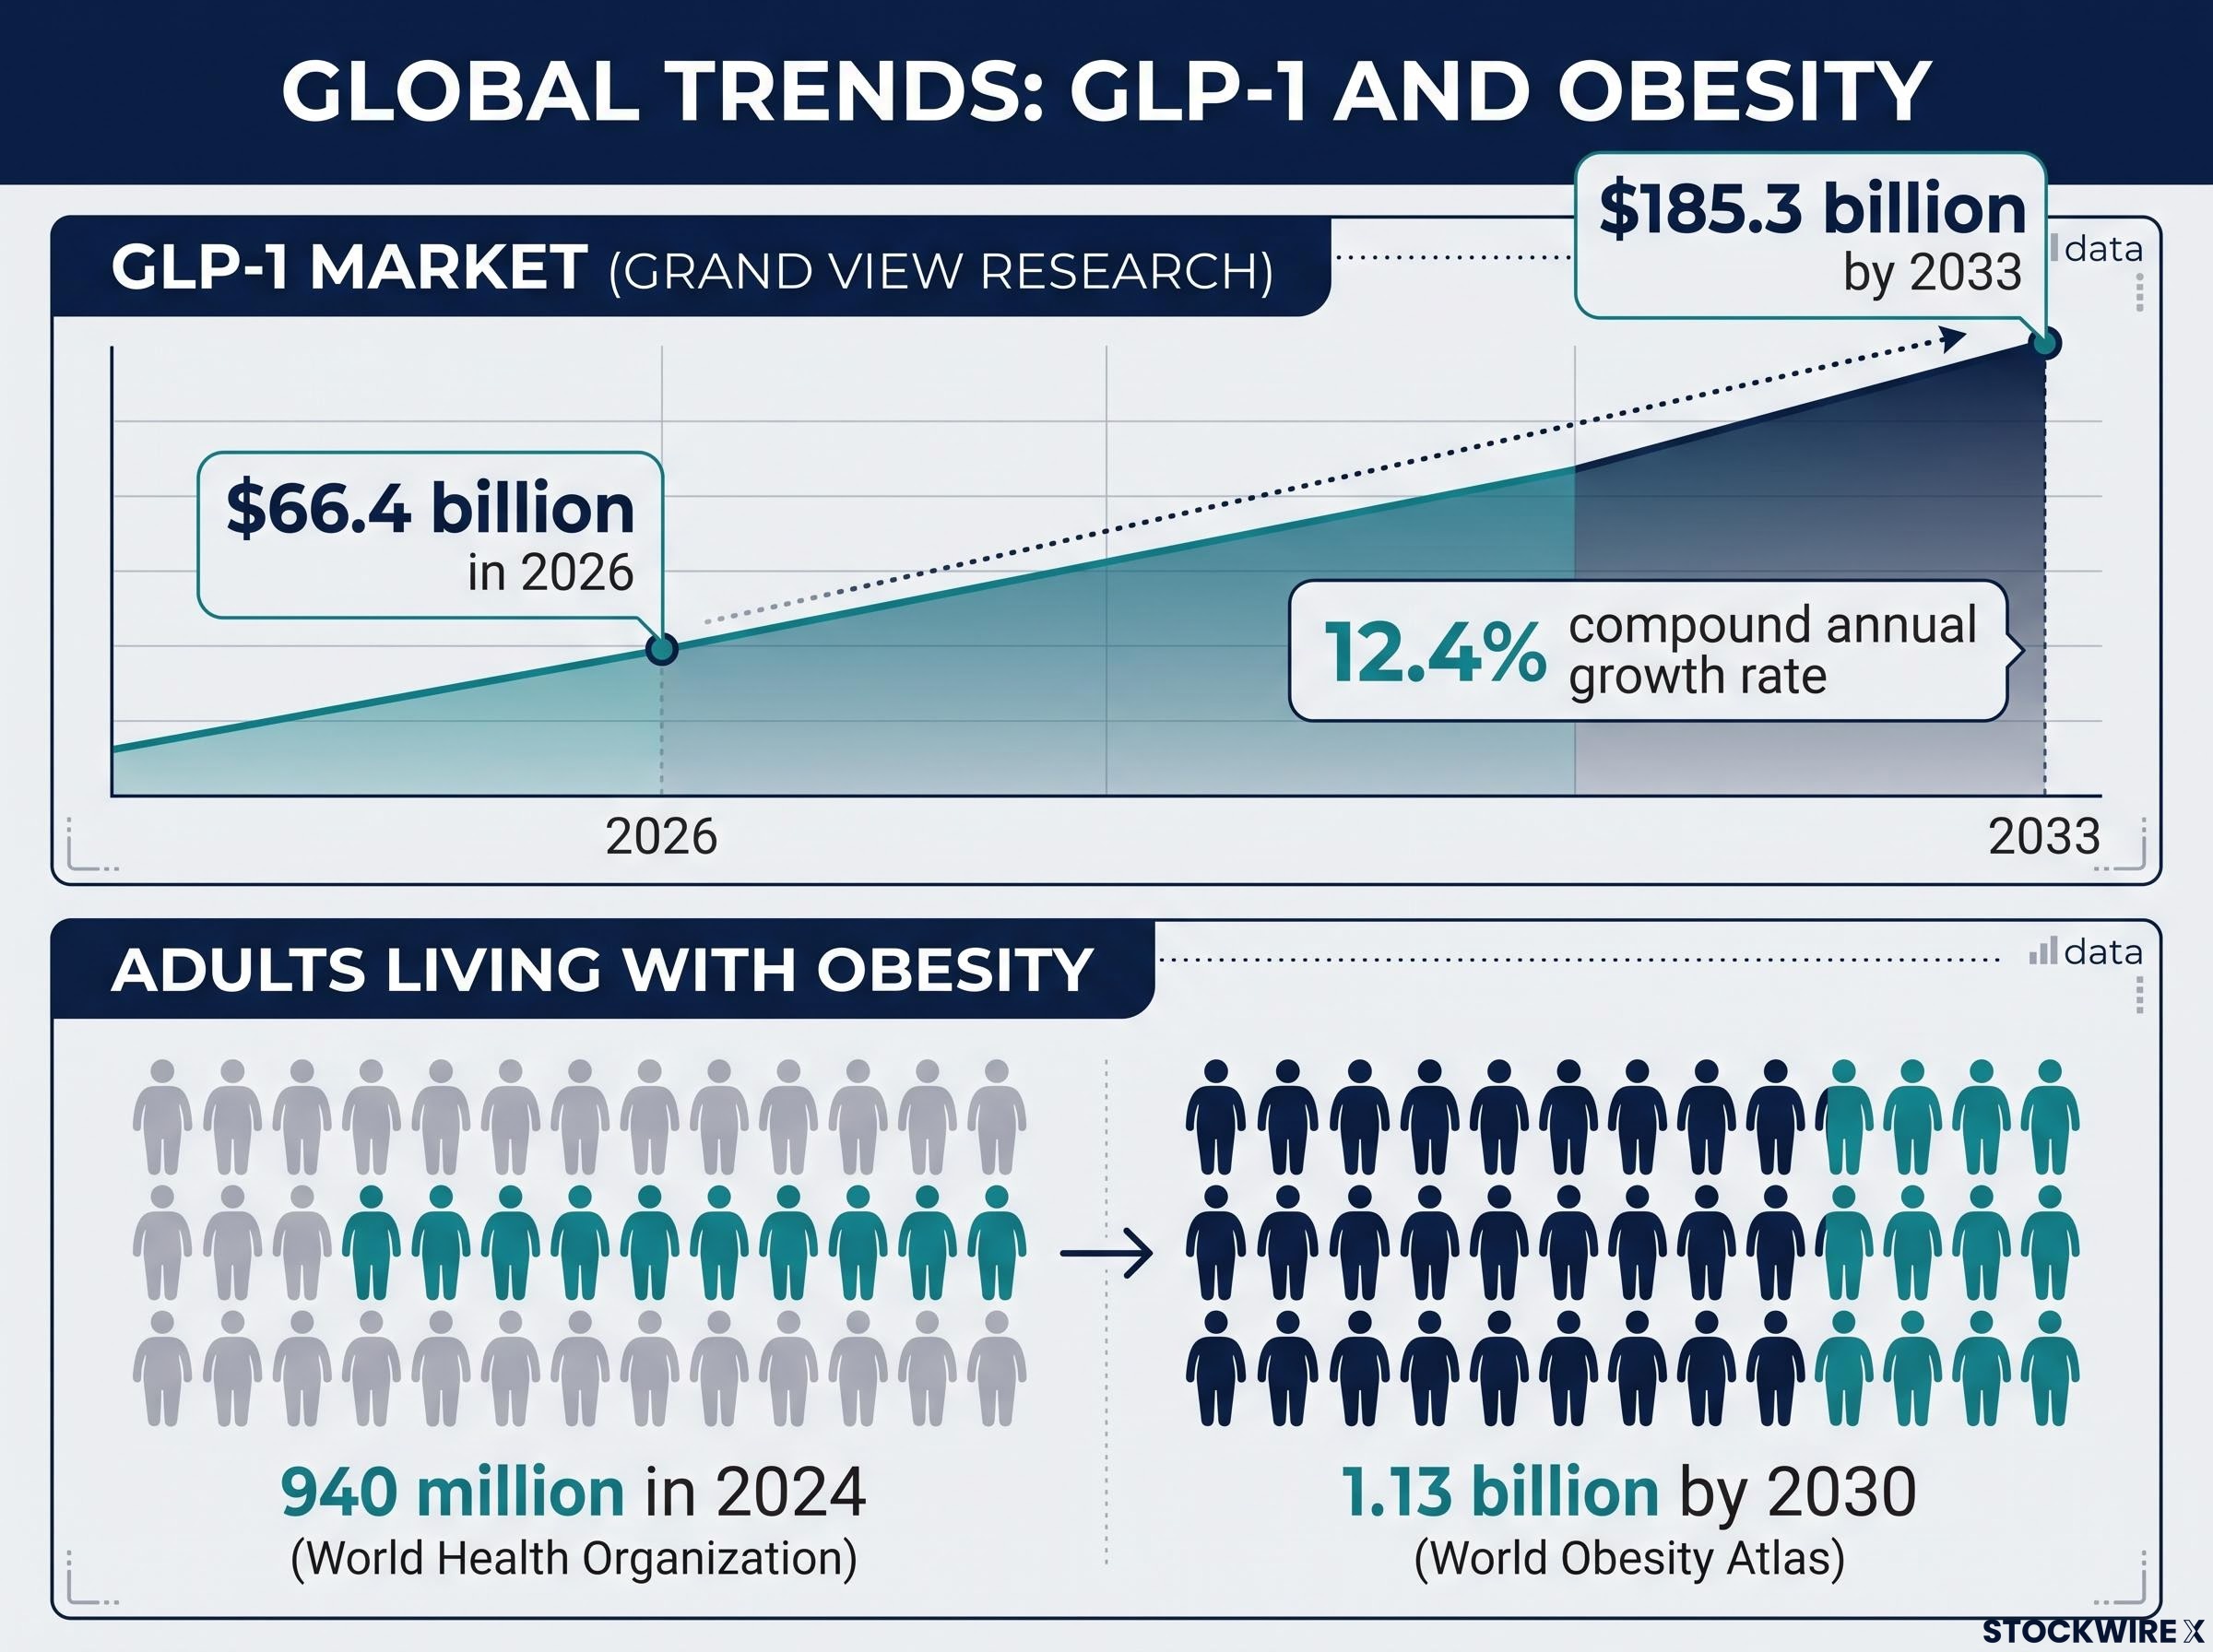
For Lilly, the trend is GLP-1 obesity drugs. These are medicines that mimic a gut hormone to regulate appetite and blood sugar. Grand View Research estimates the GLP-1 market at $66.4 billion in 2026, rising to $185.3 billion by 2033, a compound annual growth rate (the average yearly growth rate over the period) of 12.4%.
The patient numbers are large. The World Health Organization estimates about 940 million adults were living with obesity in 2024, and the World Obesity Atlas projects 1.13 billion by 2030. Harris recalled a figure closer to 2 billion. That number probably mixes up obesity with high body mass index, which also includes people who are overweight.
A large patient pool does not guarantee a large pool of buyers. Access, reimbursement, side effects and competing drugs all decide how much of that potential turns into revenue for any one company.
Step 2: Run the elevator test
Harris’s rule is blunt: if you cannot explain what a company does and how it earns money in an elevator ride, do not own it. Then ask whether it sells to businesses (B2B) or consumers (B2C), how concentrated its customers are, how regulated it is and how widely spread it is across regions.
Customer concentration can hurt. Harris once held a company whose main customer, Google, built a rival product in-house.
| Question | Lilly application |
|---|---|
| What problem does it solve? | Diabetes, obesity and other serious conditions |
| What drives revenue? | Volume, price, reimbursement, geography and new approvals |
| Is growth broad or concentrated? | Concentrated: Mounjaro and Zepbound brought in about $16.1 billion in Q3 2026, roughly two-thirds of sales |
| Does it have an advantage? | Scale, clinical data, manufacturing, distribution and pipeline |
A strong trend only gets a company through the first filter. Being able to say in one breath how it makes money is what separates owning a business from owning a ticker.
When big ASX news breaks, our subscribers know first
What do the financials and the P/E ratio tell a beginner?
Financial statements look intimidating. Three questions cut them down to size: is the company growing, is it getting more profitable, and how much are you paying for that?
Step 3: Read the financials
Look at revenue, earnings and margins over as many years as you can find. Margin is profit divided by revenue. When earnings grow faster than revenue, margins are expanding, which usually means the company is gaining from scale and efficiency.
Harris uses a rough benchmark of about 10% average revenue or earnings growth over 10-15 years. She prefers long track records to recent listings (IPOs), because a company that has survived recessions has shown it can take a hit. Strong cash works like a personal emergency fund, giving a business room to invest, buy competitors or ride out a shock.
Lilly’s third-quarter results, released on 29 October 2026, show why headlines are not enough:
- Revenue of $24.4 billion, up 39% year on year
- Mounjaro revenue of $10.72 billion, up 65%
- US Zepbound revenue of $5.35 billion, up 48%
- 2026 revenue guidance raised to $91-92 billion from $85-87 billion
- Adjusted earnings per share (EPS) guidance cut to $35.00-36.00 from $35.50-36.50
Sales up, profit guidance down Lilly lifted its revenue outlook and trimmed its profit outlook at the same time. The cut came from about $4.57 per share in charges tied to acquired research projects. That is exactly why you read past the revenue headline.
Step 4: Put the P/E in context
Share price on its own tells you nothing. The price-to-earnings (P/E) ratio is the share price divided by earnings per share, or the price you pay for one dollar of profit. A $200 share can be cheaper than a $3 share if it earns far more.
There is no universal “good” P/E. Compare it with peers, the broader market and the company’s own history. A free tool such as Yahoo Finance shows it for most US companies.
| Company | Trailing P/E | Forward P/E | Market cap |
|---|---|---|---|
| Eli Lilly | ~45-46x | ~30-32x | ~$1.2-1.33 trillion |
| Novo Nordisk | ~10x | ~12x | ~$172.6-179 billion |
| Merck | n/a | ~15x | ~$350 billion |
Figures are from late October 2026, via Simply Wall St, 247WallSt and Reuters. Big pharma typically trades around 15-20x. Lilly was up about 30% year to date through late October while Novo was down about 20%, and Netflix’s P/E has fallen as its expected growth slowed.
Fidelity points out that a high P/E can reflect expectations of faster growth or simple overvaluation. Treat it as a bar the company has to clear with exceptional growth, not a verdict on whether it is good.
Because the P/E ignores debt and cash generation, you can pair it with complementary valuation metrics such as the PEG ratio, price to free cash flow and EV/EBITDA, each of which covers a blind spot the P/E leaves open.
Is the valuation justified, and what could break the thesis?
Here is where the experts split, and that split is useful to you.
| Source | View |
|---|---|
| Morningstar | Fair value of $980, roughly 30% overvalued in its October analysis; fair value held after Q3 while its 2026 revenue forecast rose to $92.7 billion |
| Brokerages | JPMorgan, RBC, Goldman Sachs, UBS and others raised price targets after the results |
| Simply Wall St | Fair value about $1,477.03 versus a last close of $1,417.54 |
| Motley Fool | About 40x trailing earnings leaves little room for slower growth |
Nobody in that table is calling Lilly a bad company. The disagreement is about how much future growth is already priced in.
When experts split, write down the assumptions that must stay true. For Lilly, these are the things that could break the case:
- Pricing pressure: volume gains in Q2 and Q3 2026 were partly offset by lower realised prices.
- Medicare and policy: negotiated prices can widen access but cut revenue per prescription.
- Compounded medicines: cheaper alternatives mean not every patient buys the branded drug.
- Competition: Novo and newer treatments, including pills, could take market share.
- Side effects and adherence: patients who stop treatment stop paying for it.
- Concentration: two drugs carry roughly two-thirds of sales.
- Pipeline: a failed trial or manufacturing delay could prompt a sharp revaluation.
- Multiple compression: investors can decide a lower P/E is fair, sending shares down even as profits rise.
That list becomes your personal early-warning system.
Oral GLP-1 competition is a specific example of the Novo risk, since Lilly’s dual-receptor edge does not carry into pills, where both drugs target only the GLP-1 receptor and convenience may matter more.
Lessons from Netflix on losing a growth driver
In April 2022, Netflix reported its first subscriber loss in more than a decade. Its shares fell 37% in a single day.
The business did not collapse overnight. Investors had been paying for growth, and when growth stalled, the premium went with it.
How do you judge management, and when should you trim or sell?
So far you have acted as an analyst. Now you need to decide what to do, and that starts with whether you trust the people in charge.
Step 5: Judge management
Check leaders’ track records, whether they own shares and whether their past includes controversy. Watching CEO interviews helps you judge how clearly they explain their strategy.
The most practical test is to compare what management said with what happened. Track guidance against actual revenue, margins, cash flow and product launches. Harris points to The Warehouse, a New Zealand retailer that repeatedly promised results it did not deliver, until its word stopped carrying weight.
Sizing, trimming and selling
Fidelity recommends deciding your acceptable risk, capital and position size before you trade, with an exit plan and a way to monitor the holding afterwards.
Reasons to sell
- The global trend behind the investment fades
- The company stops doing what it said it would
- The thesis is broken, for example because competitive advantages wear away
Reasons to trim
- Strong gains have made the position too large for your plan
- The valuation assumes outcomes that look implausible
A new competitor usually calls for reassessing your position size, not an automatic sale. A rising share price alone is not a sell signal either. Harris says a 7% position in a single theme would feel quite risky to her.
Setting these rules before you buy is what stops the “I don’t know what to do now” freeze that cost Jess her $200 position.
How can you build stock-picking confidence without risking your plan?
You do not need to get everything right. You need a structure where being wrong is cheap.
The core-satellite approach does that:
- Core: diversified global or broad-market ETFs, which carry most of your money
- Satellite: a small group of individual stocks, added gradually and trimmed when one grows too large
Jess puts about $1,700 a month into her core portfolio, so a small satellite cannot derail her plan. Harris suggests that with $200 a month, you spread it across about 10 stocks rather than one.
Position size is your real risk control. A holding small enough to be wrong about is one you can afford to learn from.
A core-satellite portfolio framework typically puts 70-90% of your money in a low-cost diversified core, and each satellite position should state its thesis, why the core does not already capture it, and its time horizon.
Make learning a habit. Spend about half an hour each month studying one metric across your holdings, such as P/E, margins, cash or management. Harris stresses there is no perfect time to start, and the learning never really ends.
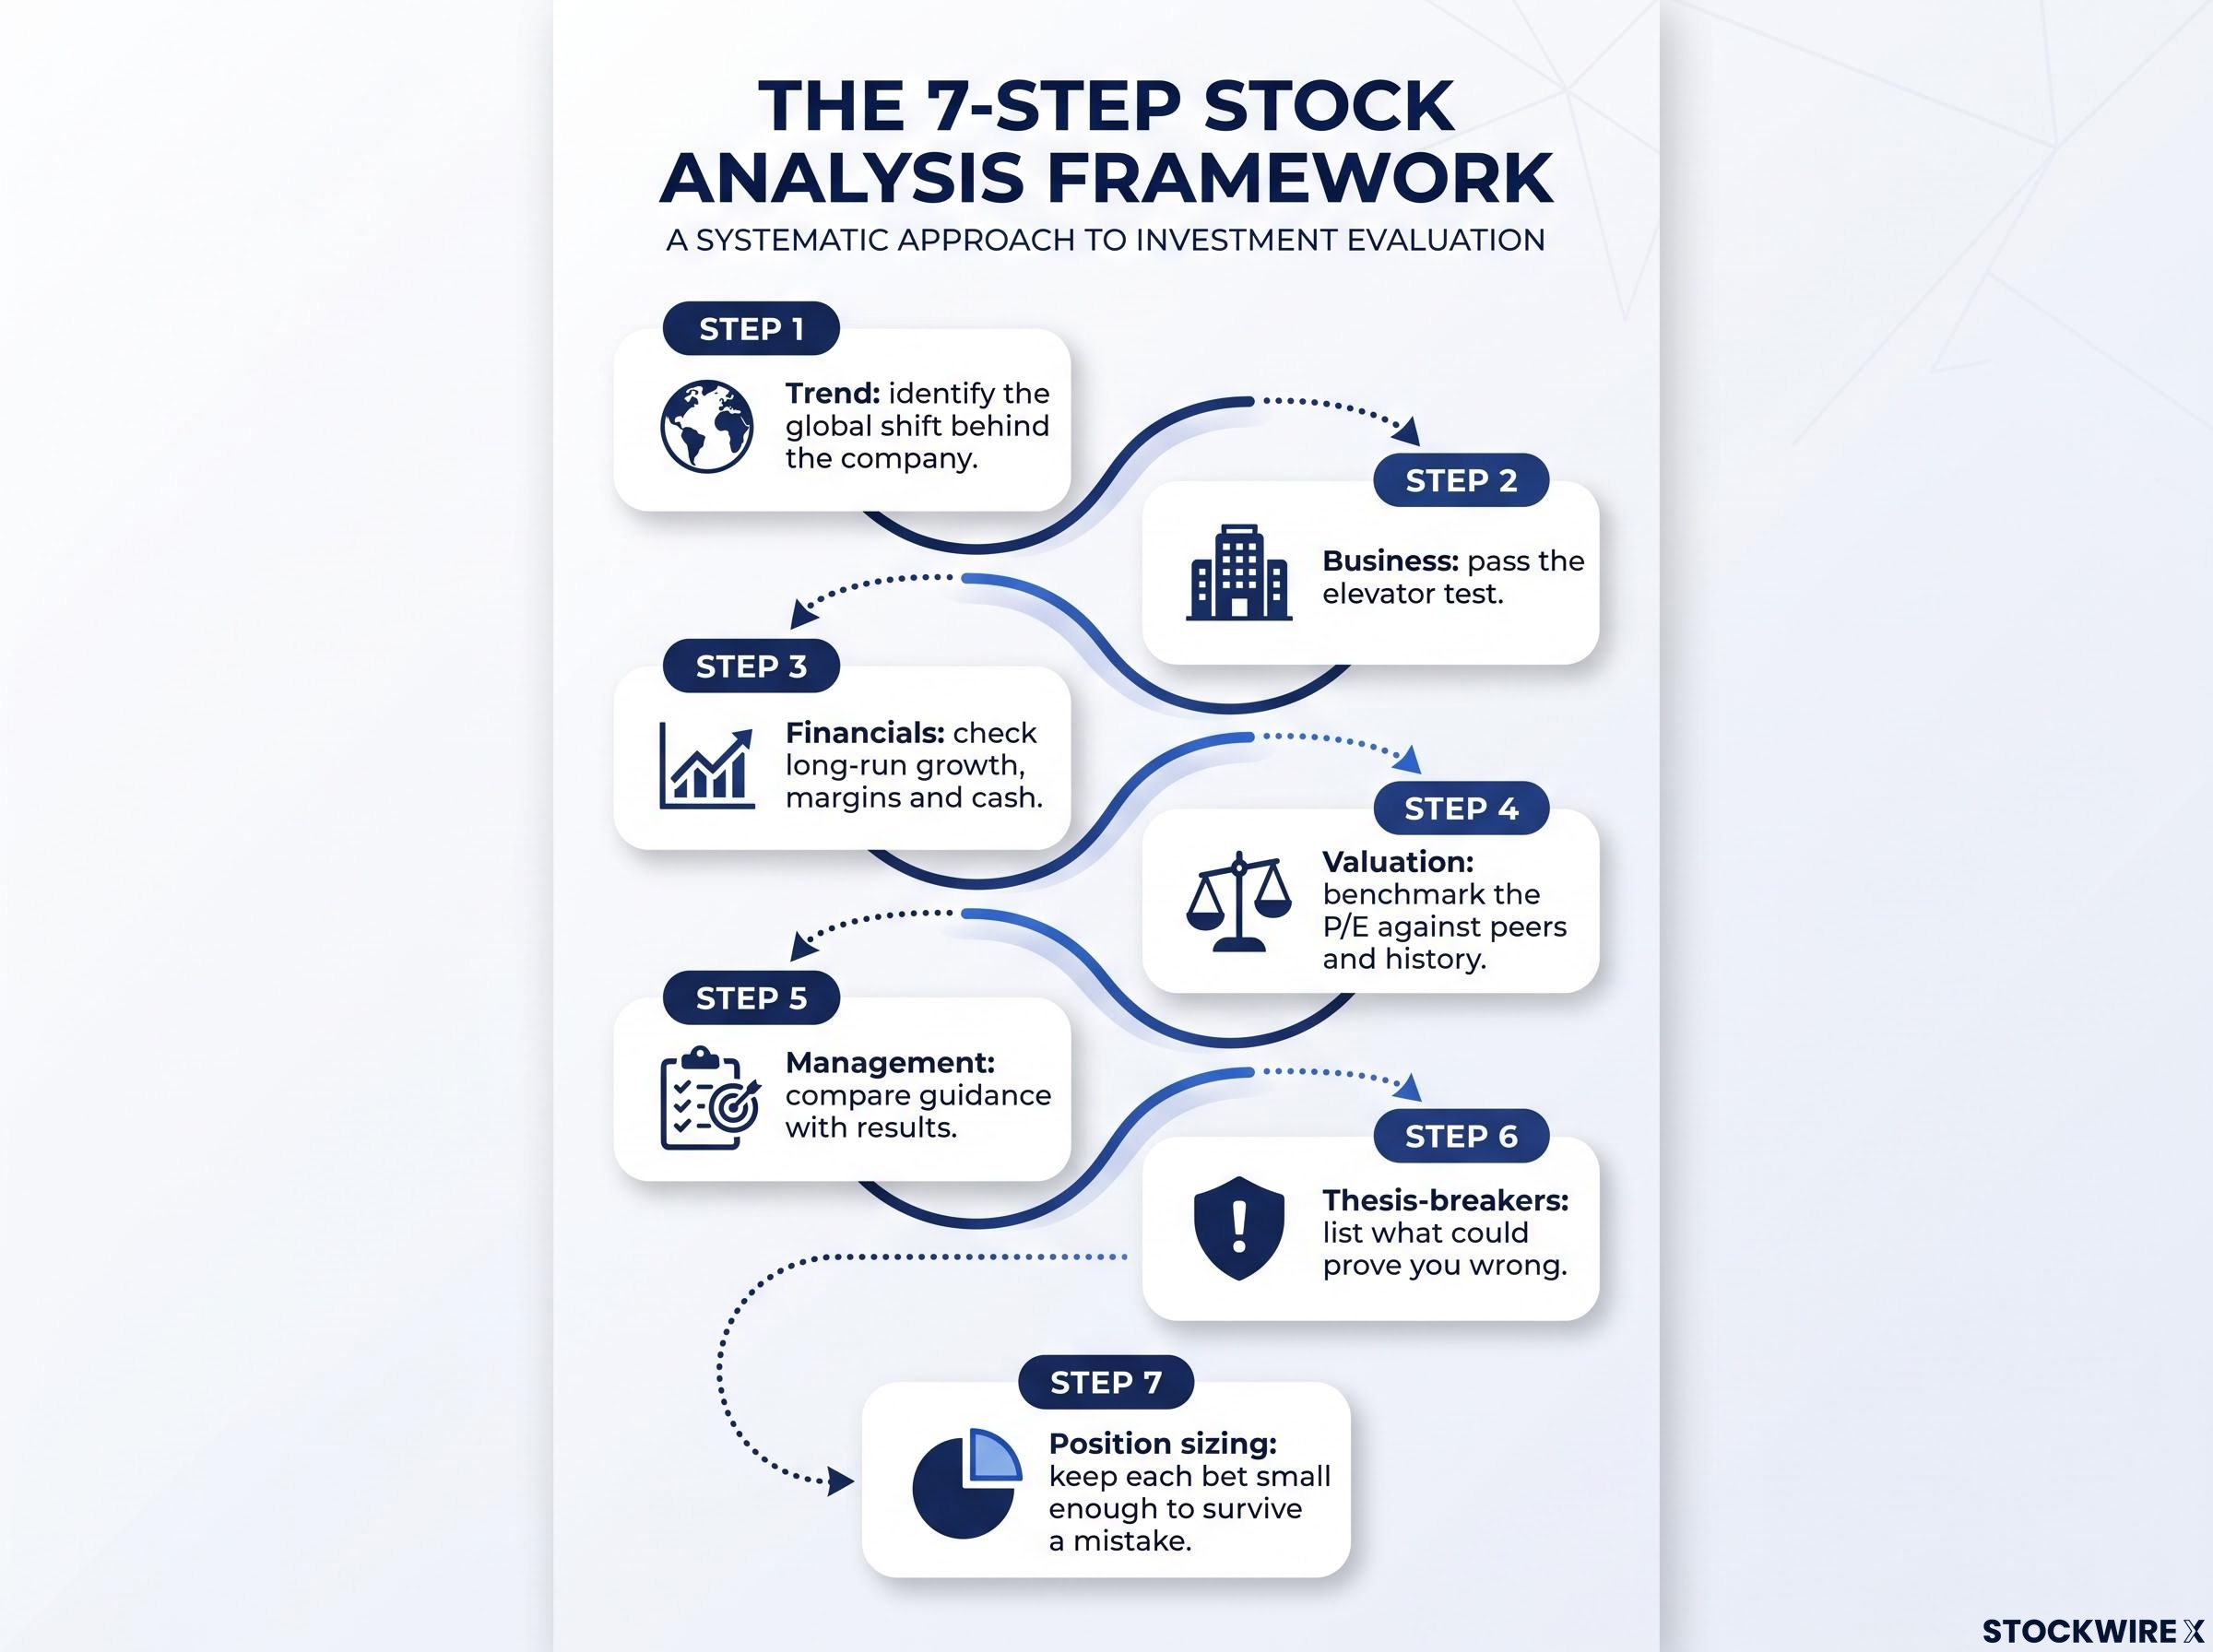
Here is the full framework:
- Trend: identify the global shift behind the company.
- Business: pass the elevator test.
- Financials: check long-run growth, margins and cash.
- Valuation: benchmark the P/E against peers and history.
- Management: compare guidance with results.
- Thesis-breakers: list what could prove you wrong.
- Position sizing: keep each bet small enough to survive a mistake.
The one question for every stock How much future growth is already in the price, and is my position small enough that I can tolerate being wrong?
Your next stock decision starts with one question, not a forecast
Lilly shows a business delivering exceptional growth with a valuation that leaves little room for error. That combination is exactly why it makes such a useful teaching example: every step of the framework has something to say about it.
You do not need to forecast the next quarter. You need to know what you are paying for and what would change your mind.
This month, pick one holding. Check its P/E against two peers and its own history, then write down three assumptions that must stay true for you to keep owning it.
Lilly appears here as a case study, not a recommendation. This article is for informational purposes only and should not be considered financial advice. Investors should conduct their own research and consult with financial professionals before making investment decisions.