November is supposed to be a good month for shares. Over the long run, though, the S&P/ASX 200 has averaged a November price gain of just +0.31%, and it has finished the month higher in only 54% of years.
That is a thin edge, and this year it arrives with company. The Reserve Bank of Australia (RBA) is due to announce its rate decision on 3 November, the same day Americans vote in the US midterm elections.
The calendar is mildly on your side. Nearly everything else is pulling the other way: a cash rate of 4.60%, annual inflation of 4.3%, oil above US$100 a barrel, and a sharp sell-off in materials and small caps.
This guide gives you a clear way to weigh November ASX 200 seasonality against those conditions, plus a short, dated list of catalysts worth watching over the coming weeks.
What has November actually delivered for the ASX 200?
Start with the numbers most often quoted, and November looks friendly. Every measure below is positive. Look closer, though, and each one is answering a slightly different question.
| Measure | Result | Sample period | Return type | Source |
|---|---|---|---|---|
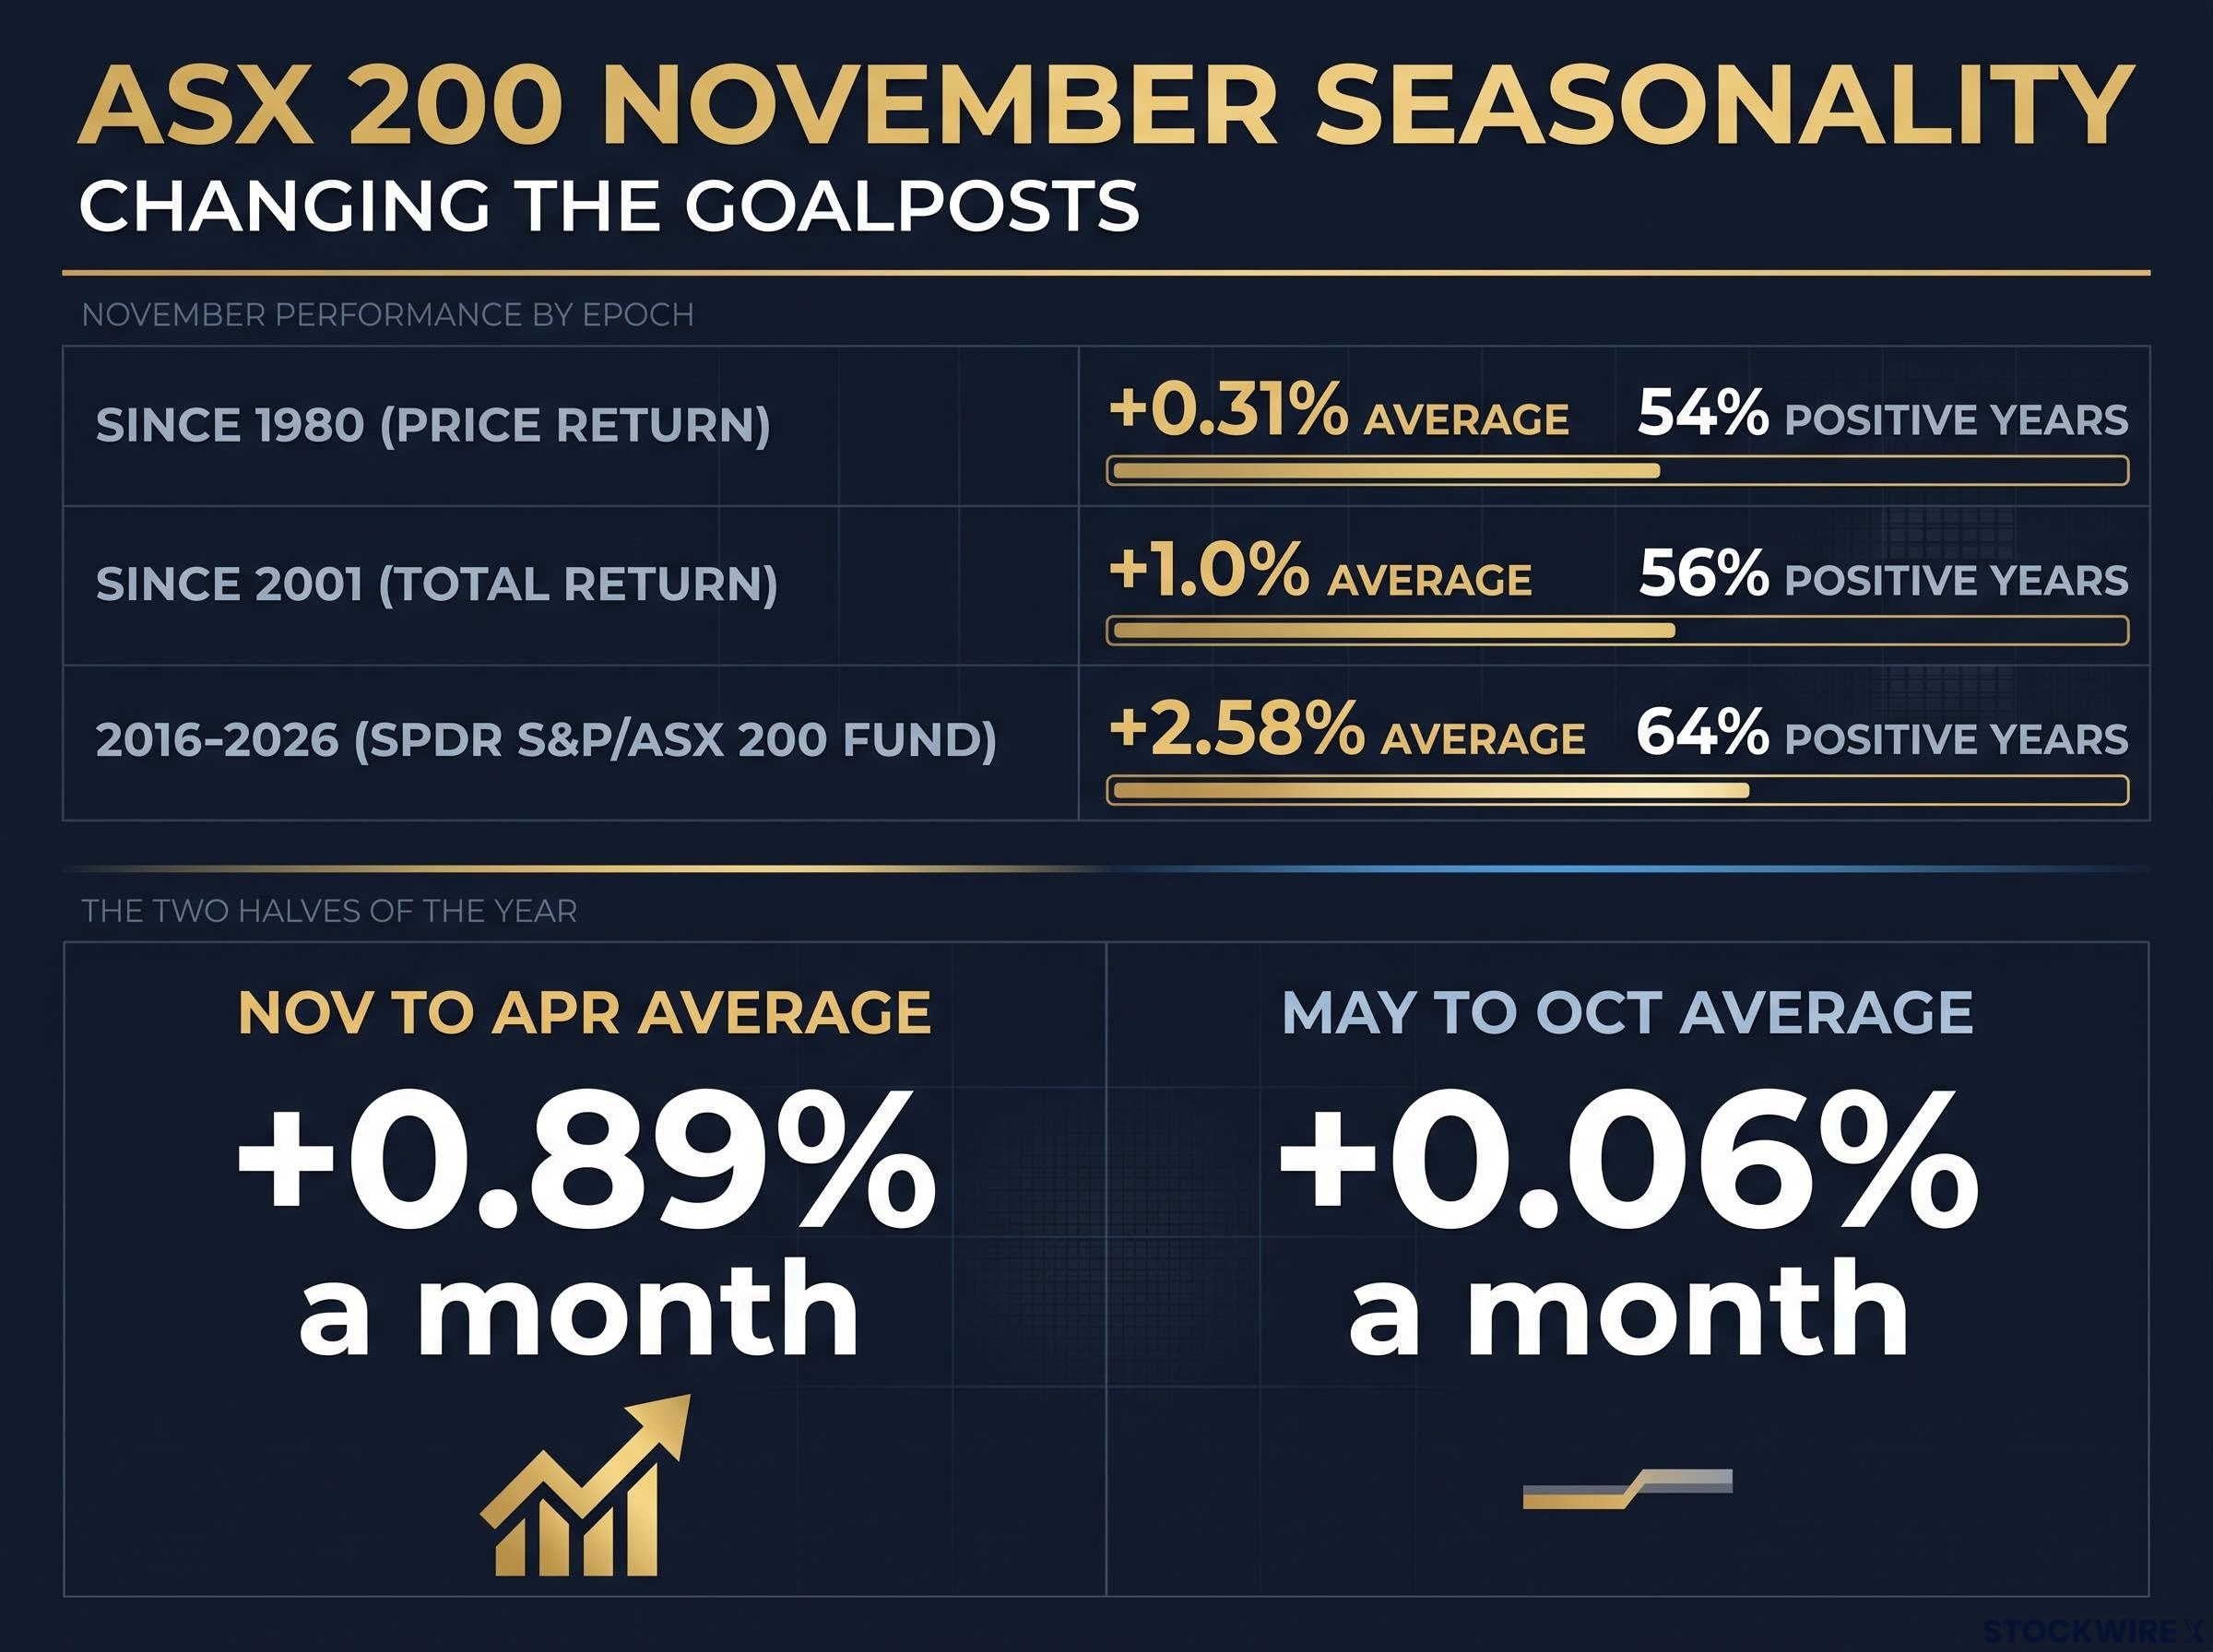
| November average return | +0.31%, 54% of years positive | Since 1980 | Price return | Market Index, 2 Nov 2026 |
| November average return | +1.0%, 56% of years positive | Since 2001 | Total return | Market Index, 2 Nov 2026 |
| Recent-decade November average | +2.58%, 64% hit rate | 2016-2026 | Price return (SPDR S&P/ASX 200 Fund) | Yahoo Finance, updated 2 Nov 2026 |
A price return counts only the change in the index level. A total return also adds back dividends, which is why it looks better. The recent-decade figure uses a different start date and a fund rather than the index itself.
So the jump from +0.31% to +2.58% is not a contradiction. It is what happens when you change the sample and the definition, and it shows how sensitive seasonal statistics are to where you start counting.
The figure to remember Since 1980, the ASX 200 has risen in November in just 54% of years.
The wider seasonal story is the six months ahead. According to eToro commentary reported by InvestorDaily on 25 March 2025, the ASX 200 averaged +0.89% a month from November to April, against +0.06% a month from May to October.
What you should take from all this: the calendar gives you a small tilt, not a tailwind. Treat the strong last decade as a good run, not the normal state of affairs. No sourced data exists on how the ASX performed in previous US midterm years, so be wary of anyone quoting one.
When big ASX news breaks, our subscribers know first
What can seasonality tell you, and what can it not?
If the edge is that small, why does it exist at all? The answer helps you decide how much to trust it.
Why the pattern might exist
November opens the stronger half of the year, the Australian mirror of the “Sell in May and go away” saying. Several flows plausibly line up in this window: fund managers repositioning before year end, investors reinvesting dividends and distributions, and risk appetite tending to improve into January.
Those explanations are reasonable. The sources do not prove that any single one is the cause.
Why it still fails
A 54% hit rate means November rises a little more often than a coin lands heads. That is a lean, not a pattern you can lean on.
The gap between the long-run 54% and the recent 64% tells you the result depends on which years you pick. TradingView’s own seasonality material cautions that historical seasonal performance is not a guaranteed forecast. And when a rate shock, a commodity slump or a geopolitical event arrives, the calendar offers no protection.
The same sample sensitivity shows up in other months: the ASX 200’s July seasonal data jumps from a 72% long-run hit rate to about 92% over the last 12 years.
Here is where seasonality sits in your thinking:
- What seasonality can inform: the timing of planned purchases, how much risk you are comfortable carrying, and a mild reason not to panic-sell in a soft patch.
- What it cannot override: valuations, monetary policy, earnings revisions, commodity prices and geopolitical shocks.
Use it as one input among several. Never use it as a reason to look past the macro backdrop, which is exactly what has been driving the market lately.
Why are defensives leading while materials and small caps slide?
If you only watched the headline index, October looked calm. S&P Dow Jones Indices reported the ASX 200 up about 1% for the month. Underneath, the market split in two.
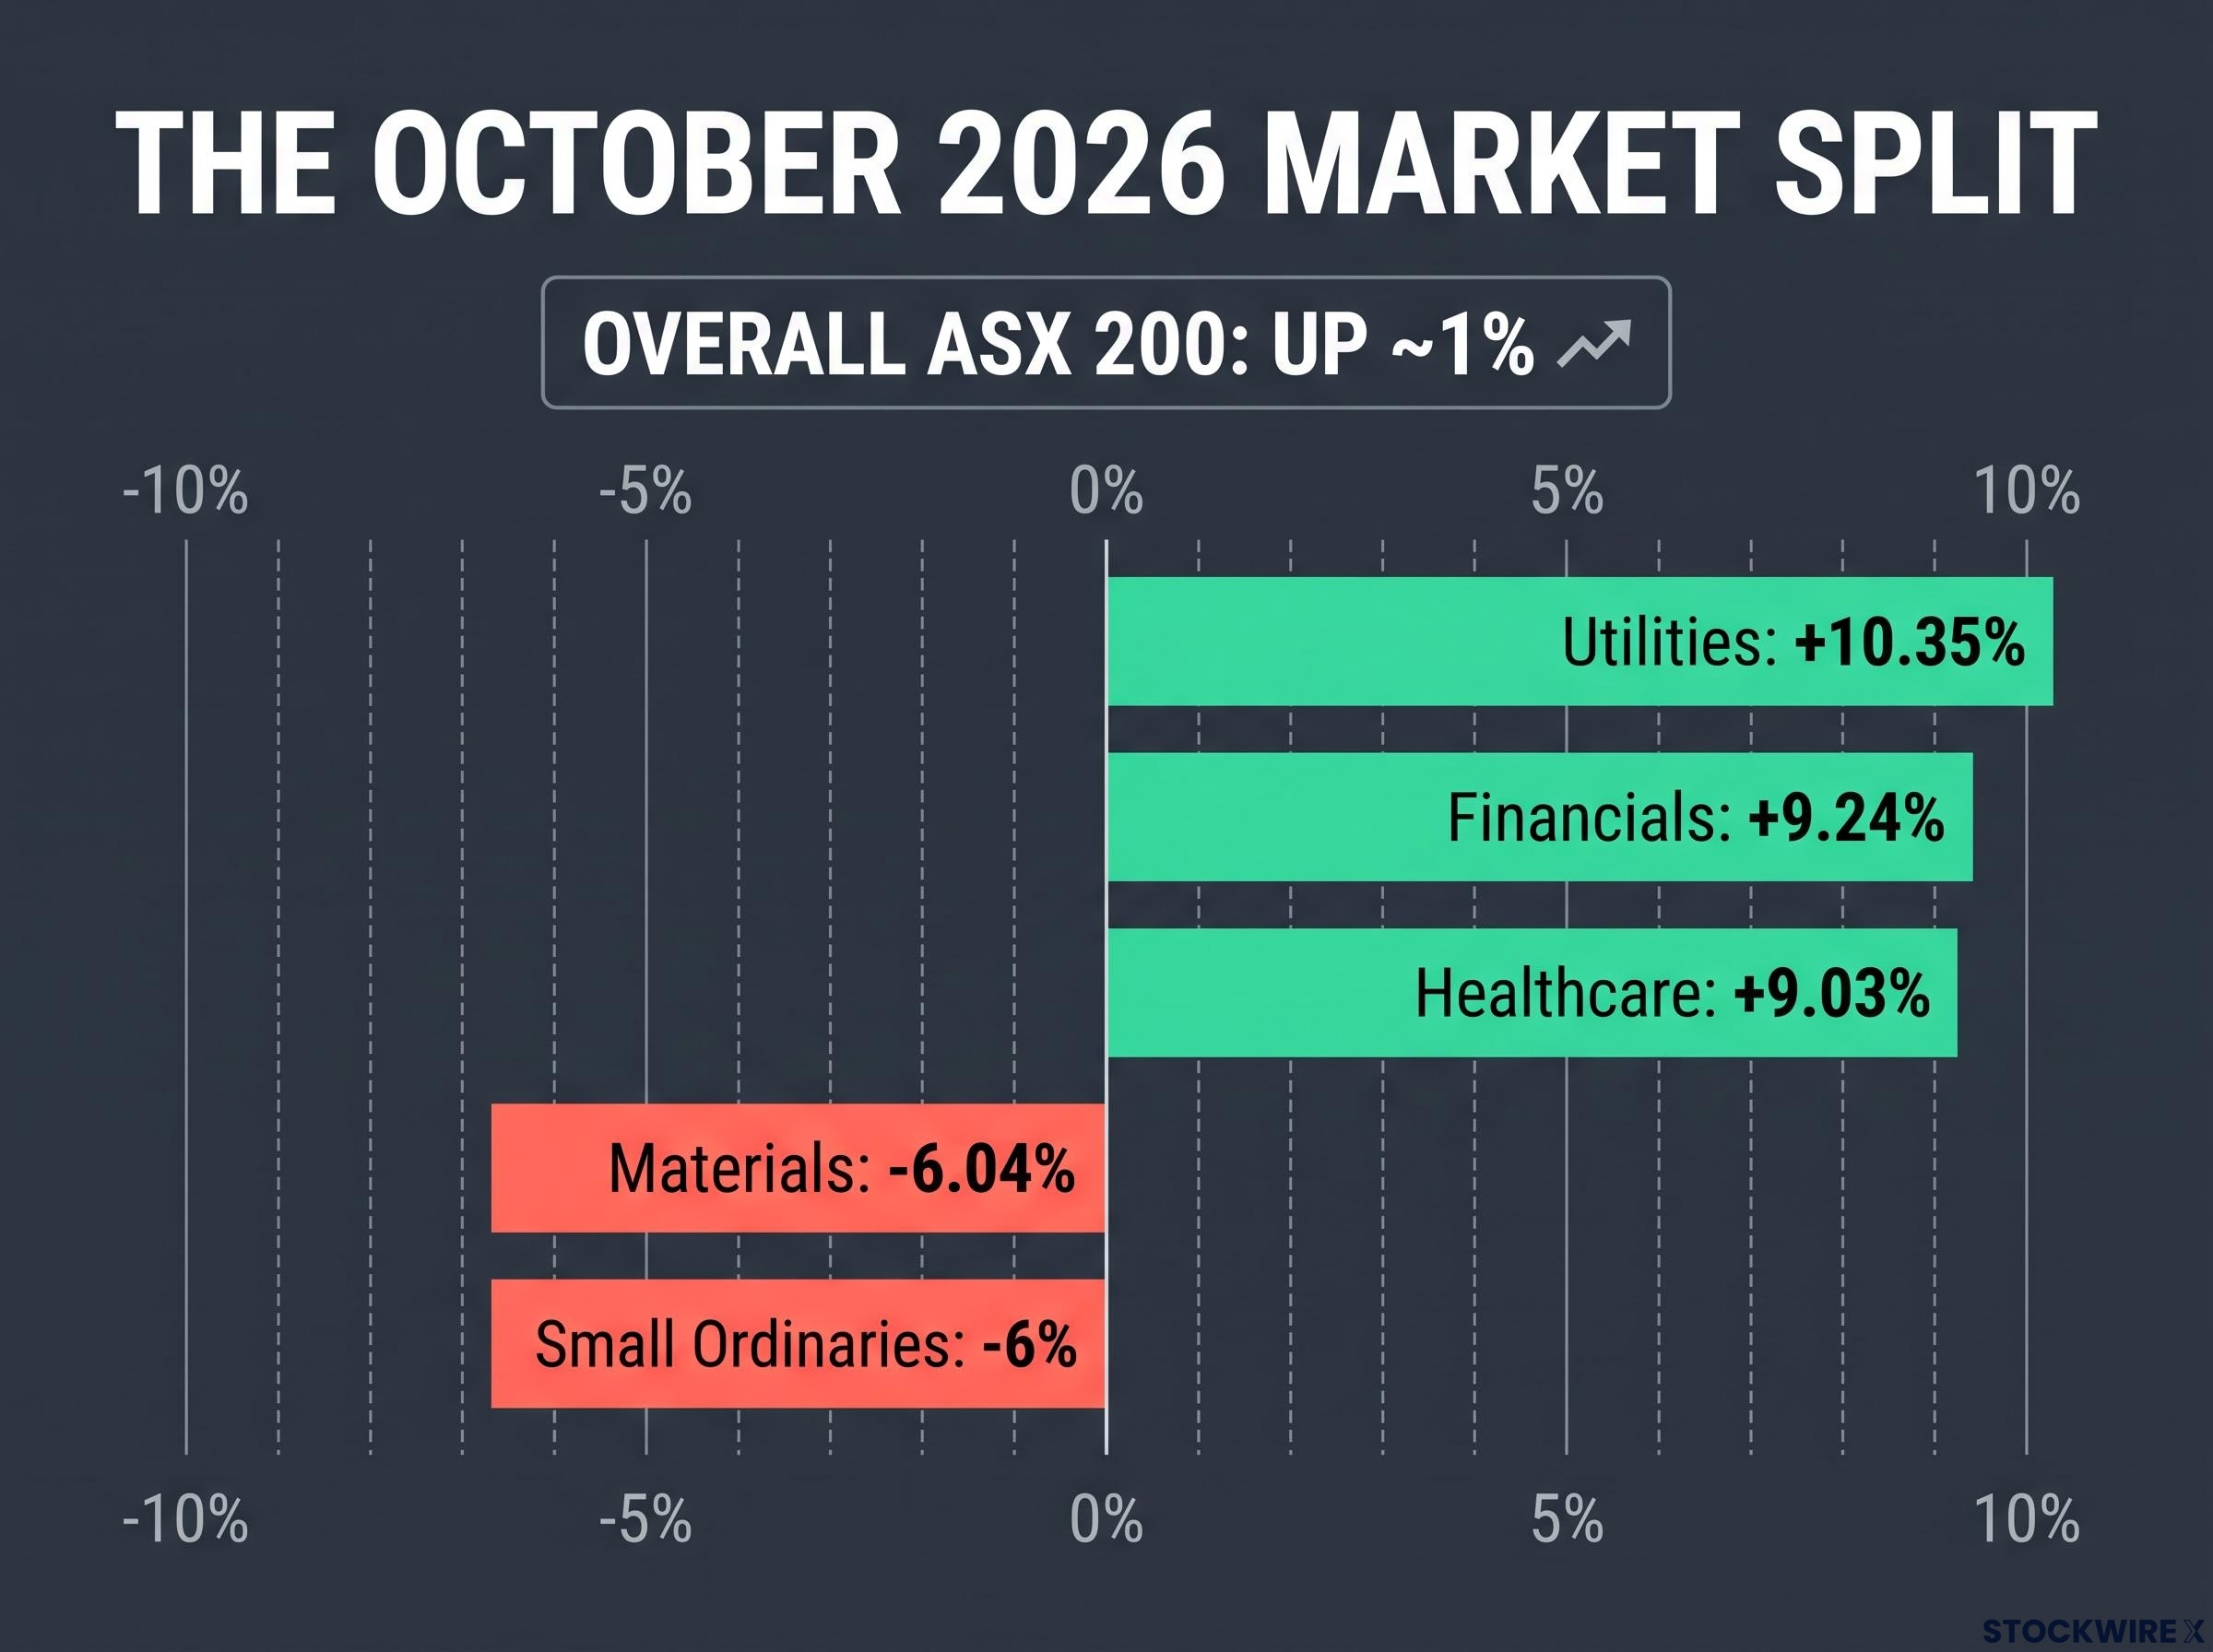
| Segment | October 2026 move | Likely driver |
|---|---|---|
| Utilities | +10.35% | Defensive positioning |
| Financials | +9.24% | Higher interest income, large-cap liquidity |
| Healthcare | +9.03% | Defensive positioning |
| Materials | -6.04% | China demand worries, higher rates |
| Small Ordinaries | -6% | Rates, thinner liquidity |
These calendar-month figures come from TheBull (30 October). Market Index used a rolling “past month” window and reported slightly different numbers, such as Materials down 7.3%. Same story, different measuring stick.
The damage runs deeper than one month. Market Index reported Materials down as much as 19.6% from their 26 August record, while the Small Ordinaries fell as much as 15% and Emerging Companies as much as 18.5% since mid-August. S&P Dow Jones Indices had Emerging Companies down 9% in October alone.
Five forces explain the split:
- Rates: The RBA lifted the cash rate to 4.60% on 29 September. September CPI then rose to 4.3% from 4.0%, with trimmed mean inflation (a measure that strips out the most extreme price moves) at 3.6%. Both sit above the RBA’s 2-3% target, which raises the rate used to value future profits and hurts smaller, growth-style companies most.
- Liquidity and size: Small caps tend to have thinner trading, weaker balance sheets and more need for outside funding.
- China demand: Materials depend on China’s construction and manufacturing cycle, and the sell-off suggests investors expect softer demand.
- Oil: Brent traded around US$110-111 and WTI around US$101-102 on 2 November, down 2-3% on reports of Iran talks. High oil helps energy producers but feeds inflation and rate risk.
- AI spending worries: Anthropic’s IPO filing highlighted heavy costs, losses and infrastructure commitments, prompting fresh questions about returns on AI investment.
The leaders were not defensive in the same way. Utilities and healthcare offered shelter, while financials gained from higher prospective interest income and the comfort of large, liquid stocks.
The bank earnings season shows how net interest margins and bad-debt guidance, rather than headline profit beats, drive share price reactions across the big lenders.
The takeaway for you is direct. Your portfolio’s size and sector tilt, not the month on the calendar, has driven your recent returns. If you hold a heavy slice of small caps or miners, that explains why you may have lagged the index.
Which catalysts could move the market this month?
The fortnight ahead is crowded, and the first two events land on the same day.
| Catalyst | Date or status | Supportive outcome | Adverse outcome |
|---|---|---|---|
| RBA decision | 3 Nov, 2:30 p.m. AEDT | Signs the hiking cycle is near its end | Hike plus hawkish tone, final hike pushed out |
| US midterms | 3 Nov (US time) | Orderly result, limited policy surprise | Prolonged uncertainty over trade and tech policy |
| US-Iran conflict and oil | Unresolved, oil above US$100 | Talks remove part of the oil premium | Disruption lifts oil and inflation risk |
| Anthropic IPO | Filed 26 Oct, first trading date unconfirmed | Strong debut revives tech appetite | Weak or delayed listing deepens AI capex caution |
| US earnings season | Continuing | Results ease AI-spending concerns | Results reinforce them |
Rates and inflation
The RBA meeting was under way on 2 November, and all four major banks expected a 25 basis point rise to 4.85%. A basis point is one hundredth of a percentage point.
A hike that keeps defensives in charge is the base case. The bigger swing factor is the message. If inflation looks stubborn, the final hike could be delayed, which would extend pressure on small caps and property-linked stocks. If the end looks close, Market Index flagged retailers and REITs (real estate investment trusts, which own income-producing property) as likely beneficiaries.
For readers wanting to read the RBA’s wording closely, our detailed coverage of RBA forward guidance shows how specific phrases can shift terminal rate pricing by up to 25 basis points.
Geopolitics and oil
Monday’s fall in crude showed how quickly a war premium can drain away. A lasting deal would ease inflation pressure and could help rate-sensitive sectors. Renewed disruption would favour energy producers and keep the RBA wary.
US politics and the AI trade
All 435 House seats and 35 Senate seats are up for election. Reuters reported Democrats widely expected to win the House, with the Senate too close to call; a change in control could shift US fiscal, trade and technology policy.
Anthropic’s listing, under the proposed Nasdaq ticker ANT, has no confirmed date, though reports point to the week of 16 November. Think of it as a public vote on whether investors will keep funding expensive AI build-outs.
Across all of these, the pattern is consistent. High rates and lingering uncertainty favour utilities, healthcare and selected financials. Better China demand, easing rate expectations or a commodity rebound could spark a sharp catch-up in beaten-down materials and small caps.
Treat 3 November as a double event risk. What happens over these weeks will set November’s tone far more than any seasonal average.
Building a November plan that weighs the calendar against the cycle
Put the pieces together and the seasonal backdrop is modestly constructive, but the rate cycle carries more weight. The evidence favours a selective, large-cap and defensive lean over an across-the-board bet on risk.
Before acting, ask yourself:
- How much of your portfolio sits in small caps and materials? Those segments drove most of the recent divergence from the index.
- How sensitive are your holdings to higher rates? A move to 4.85% would hit leveraged and long-duration names hardest.
- Will you need cash in the next few months? Liquidity needs should decide your risk level, not the calendar.
- Is your rebalancing rule written down? A plan set in advance beats a reaction to one volatile day.
Once the RBA statement and midterm results are in, watch the inflation commentary, oil and Anthropic’s listing date. Seasonality is a tie-breaker; your risk tolerance and time horizon should make the call.
This article is for informational purposes only and should not be considered financial advice. Investors should conduct their own research and consult with financial professionals before making investment decisions. Past performance does not guarantee future results. Financial projections are subject to market conditions and various risk factors.