Bond markets rarely hand out clean signals, and October 2026 was no exception. Treasury yields dropped hard from their early-October highs, a move that looked like the end of a brutal sell-off. Then long-end selling came back after the October Federal Reserve meeting.
Both facts are true at once, and that tension sits at the centre of the question of whether treasury yields peaked last month.
The stakes extend well beyond bond desks. The 10-year yield reached a multi-decade high of roughly 5.3%-5.4% in early October, capping the worst quarter for Treasuries since 1994. That level feeds directly into mortgage rates, sector valuations, gold and the US dollar.
This piece gives you a way to judge whether October marked a durable top or an interim high, and what each outcome would mean for sectors, gold and the dollar. The focus is on reading signals across markets, not on picking individual stocks.
What the October reversal actually tells us about a treasury yields peak
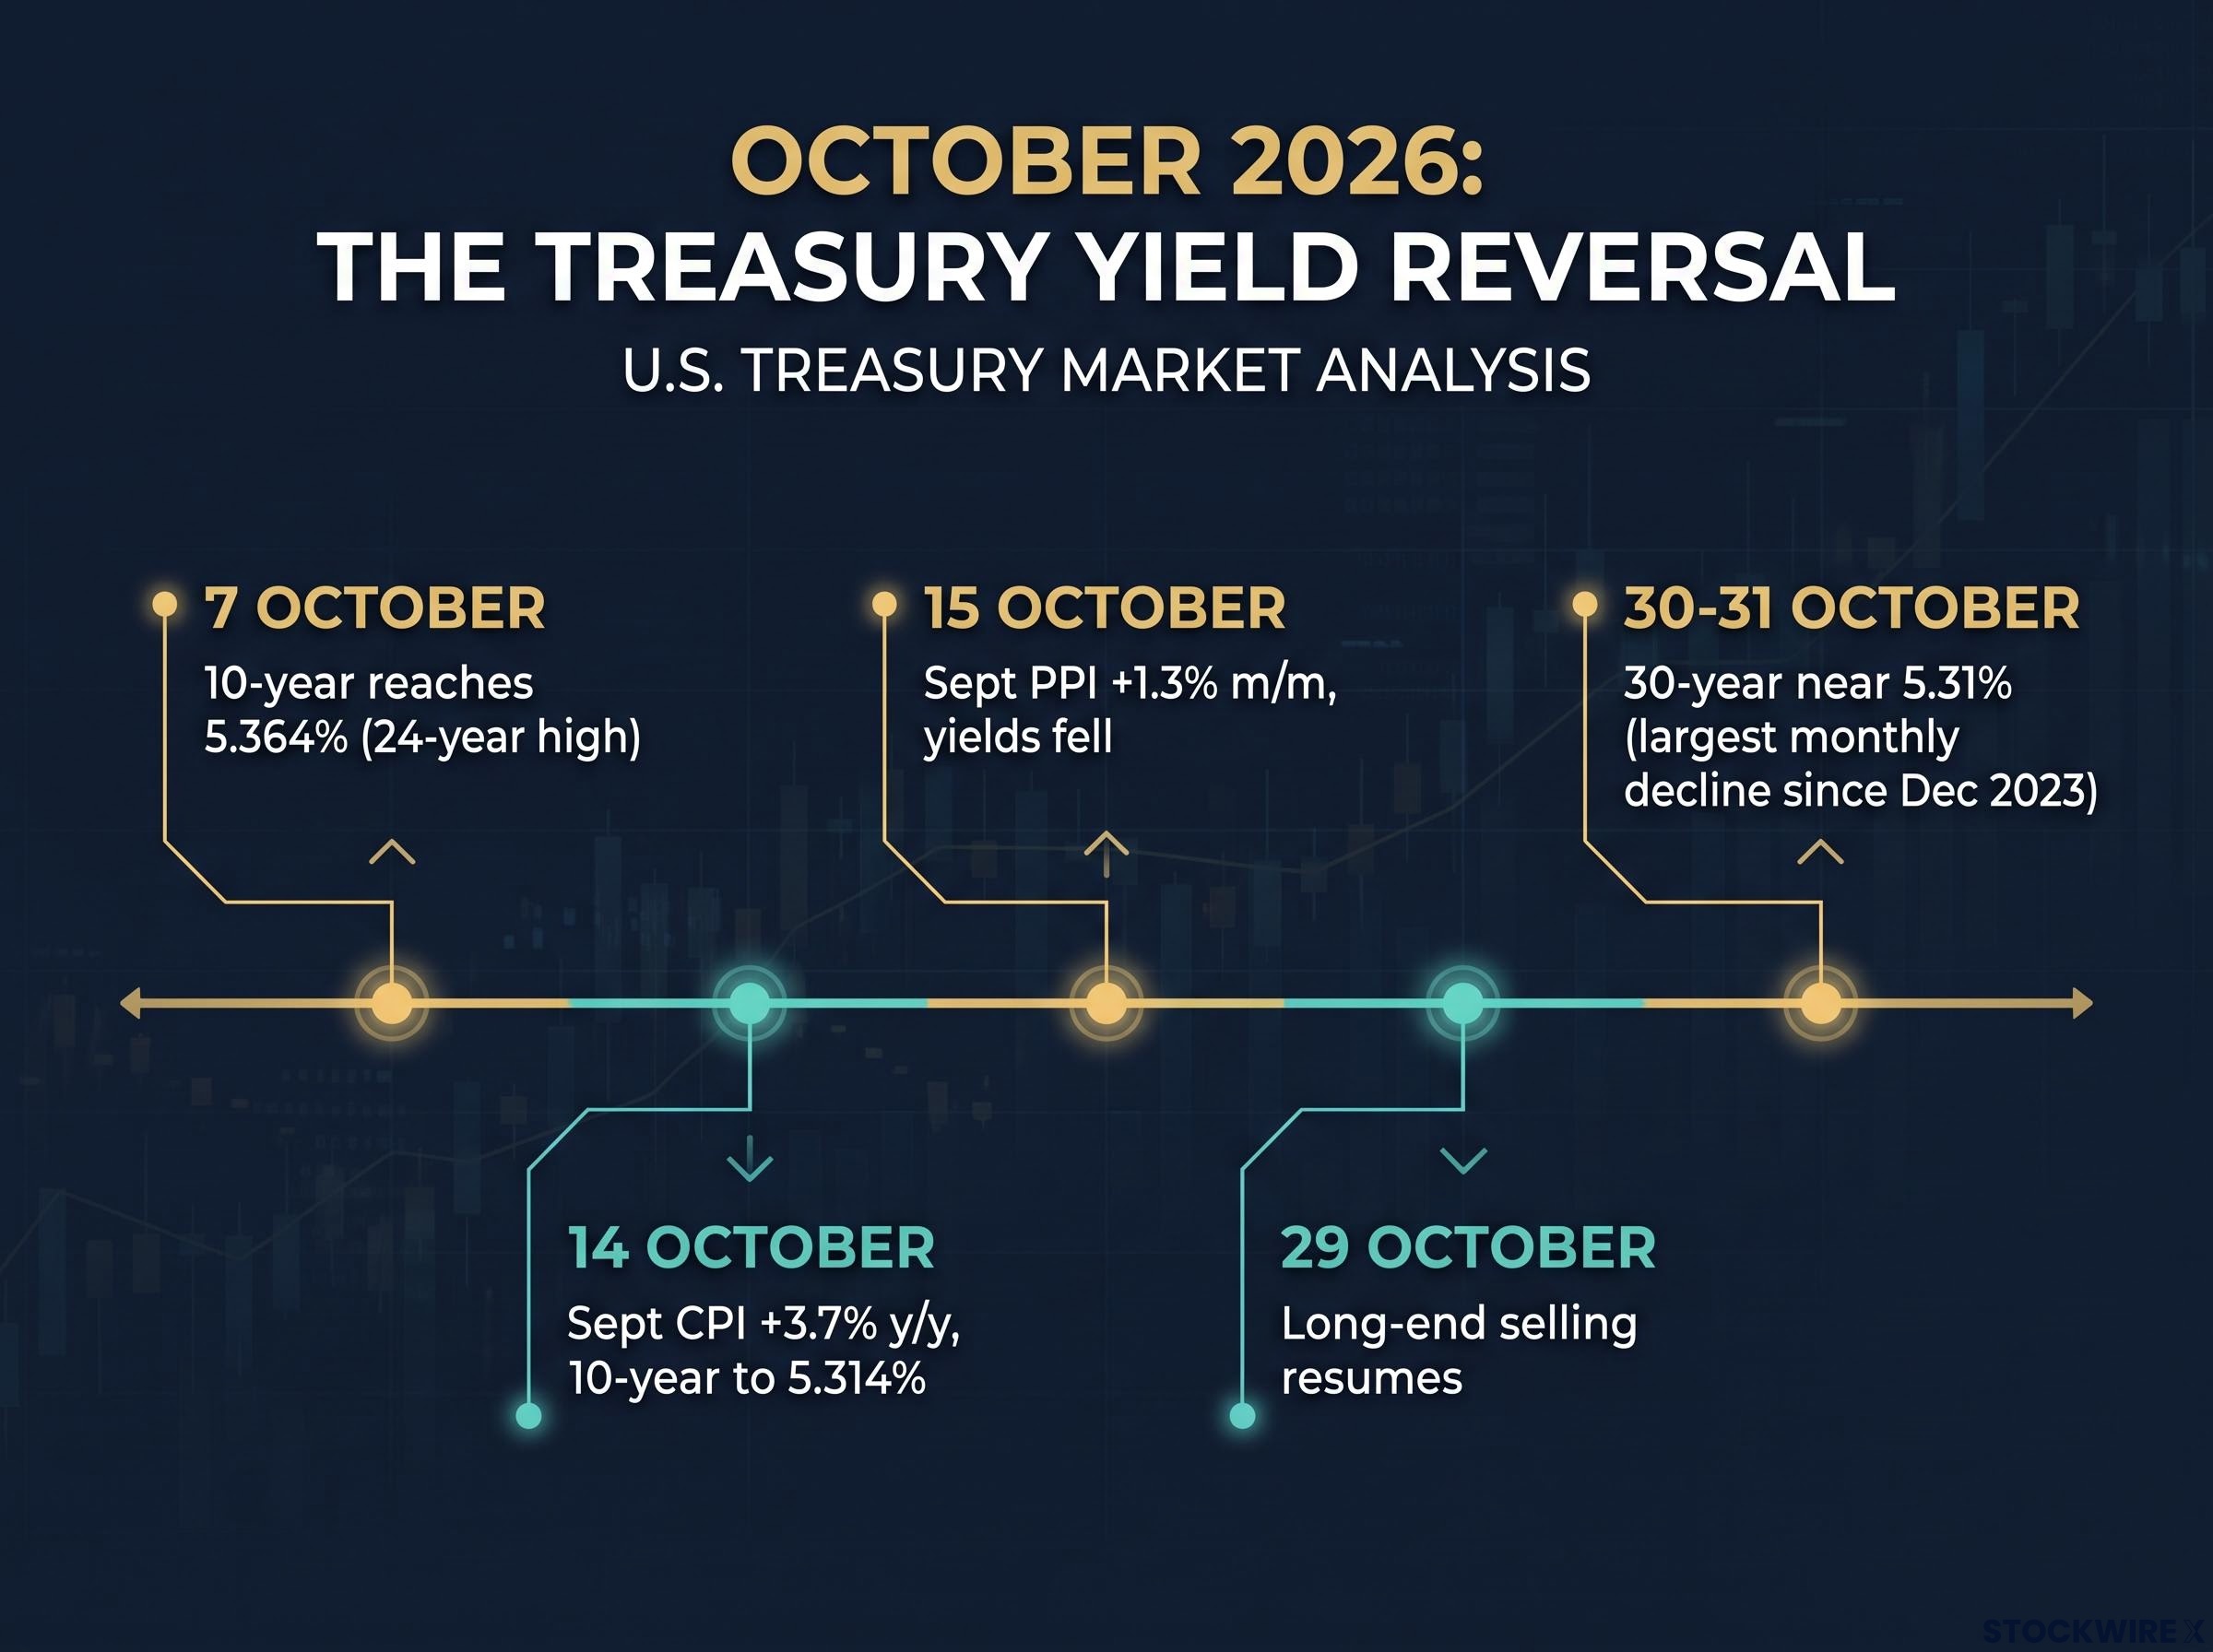
Exact peak figures differ by source. Reuters data cited by researchers put the 10-year at 5.364% intraday on 7 October, a 24-year high, while other audits place it closer to 5.31%. The 30-year topped out at about 5.7%.
The climb behind it was steep. The July-September quarter brought the 10-year’s largest quarterly yield rise and the Treasury market’s worst quarter since 1994, driven by Fed repricing, an expanding term premium, fiscal supply worries and an Iran-related oil shock. The term premium is the extra yield investors demand for holding a long-dated bond instead of rolling over short-dated ones.
The climb behind the peak owed much to a rebuilding term premium, which has swung from deeply negative in 2020 to a structural positive as sovereign debt supply surges and price-insensitive central bank buyers step back.
The evidence for a turn
The first clue came on 14 October. September consumer price index (CPI) data showed headline inflation up 0.6% for the month and 3.7% on the year, and yields rose as expected.
The next day broke the pattern.
| Release | Result | Market reaction |
|---|---|---|
| September CPI (14 October) | Headline +0.6% m/m, +3.7% y/y; core +0.3% m/m, +2.6% y/y | 2-year up about 14 bp to 4.93%; 10-year up about 10 bp to 5.314% |
| September PPI (15 October) | Final demand +1.3% m/m, largest since March 2022 | Initially bearish, then yields fell |
| October CPI | Due 10 November | Pending |
| October PPI | Due 13 November | Pending |
The producer price index (PPI) tracks what businesses receive for their goods and services. A 1.3% monthly jump should have crushed bonds. Instead, they rallied, and by 30-31 October the 30-year sat near 5.31%, its largest monthly decline since December 2023.
Greer, speaking in a recent market discussion, reads this as a regime change in which bonds can now tolerate some inflation. He also flagged a three-sigma move across the 2s-to-30s curve, an unusually extreme swing, which he interprets as a fund being forced to cover short positions. J.P. Morgan offered a different explanation: a flight to safety as worries shifted towards growth and AI-financing stress.
Why it is not yet confirmed
When bonds rally on bad inflation news, the market is pricing growth fears or a positioning unwind, not just inflation. That makes the signal far less clean than the headline drop suggests.
Reuters reported on 29 October that long-end selling resumed after the Fed meeting, with the curve steepening as investors demanded more compensation for duration risk. The case for a turn is credible. It is not yet confirmed.
When big ASX news breaks, our subscribers know first
What do gold, the dollar and oil say about the bond move?
If bonds were really sending a clear signal, other markets should echo it. Lower yields usually lift gold, which pays no interest and becomes relatively more attractive, and weaken the dollar as expected US rates fall.
October ignored that script.
| Asset | Latest level (1 November) | Usual reaction to falling yields | October behaviour |
|---|---|---|---|
| Gold | $3,884.90 | Rises | Fell as bonds rallied, below $4,000 |
| US Dollar Index | 101.96 | Weakens | Mixed; soft against the pound and Australian dollar |
| Brent crude | $113.43 | Driven mainly by supply | Elevated, keeping inflation risk alive |
Gold, which hit peaks above $5,000 earlier in 2026, held up while yields and the dollar were rising, then slipped when bonds rallied. Greer has a theory for that.
A crowded trade unwinding Greer speculates that a fund was unwinding a long-gold, short-bond position, forcing gold sales just as it bought back bonds.
That idea fits the data but remains his speculation. Liquidation, profit-taking and margin calls can all override the support lower yields normally give gold.
The dollar sent its own mixed message. Greer sees it as weak against the pound and the Australian dollar, yet safe-haven demand and funding needs can lift the currency even as yields fall. His co-participant Spie observed that the dollar, tech earnings reactions and bond reactions to inflation all moved opposite to the news in October.
Oil is the inflation channel to watch. Brent at $113.43 keeps price pressure in play regardless of what bonds do next.
What this tells you is that positioning and liquidity, not fundamentals, drove many October moves. Treat any single-asset signal with caution, and look for agreement across markets before giving the bond rally full weight.
How a yield peak could transmit to sectors in a fragmented market
The theory of how lower yields reach the share market is straightforward. Three channels do most of the work.
- Discount rates: Investors value a company’s future cash flows by discounting them back to today. Lower yields mean a lower discount rate, which raises the present value of earnings far in the future.
- Mortgage rates: Long Treasury yields anchor home loan pricing, cited at around 7.25% in the original discussion.
- Financing costs: Cheaper borrowing helps companies that rely on debt to grow.
Rate-sensitive sectors
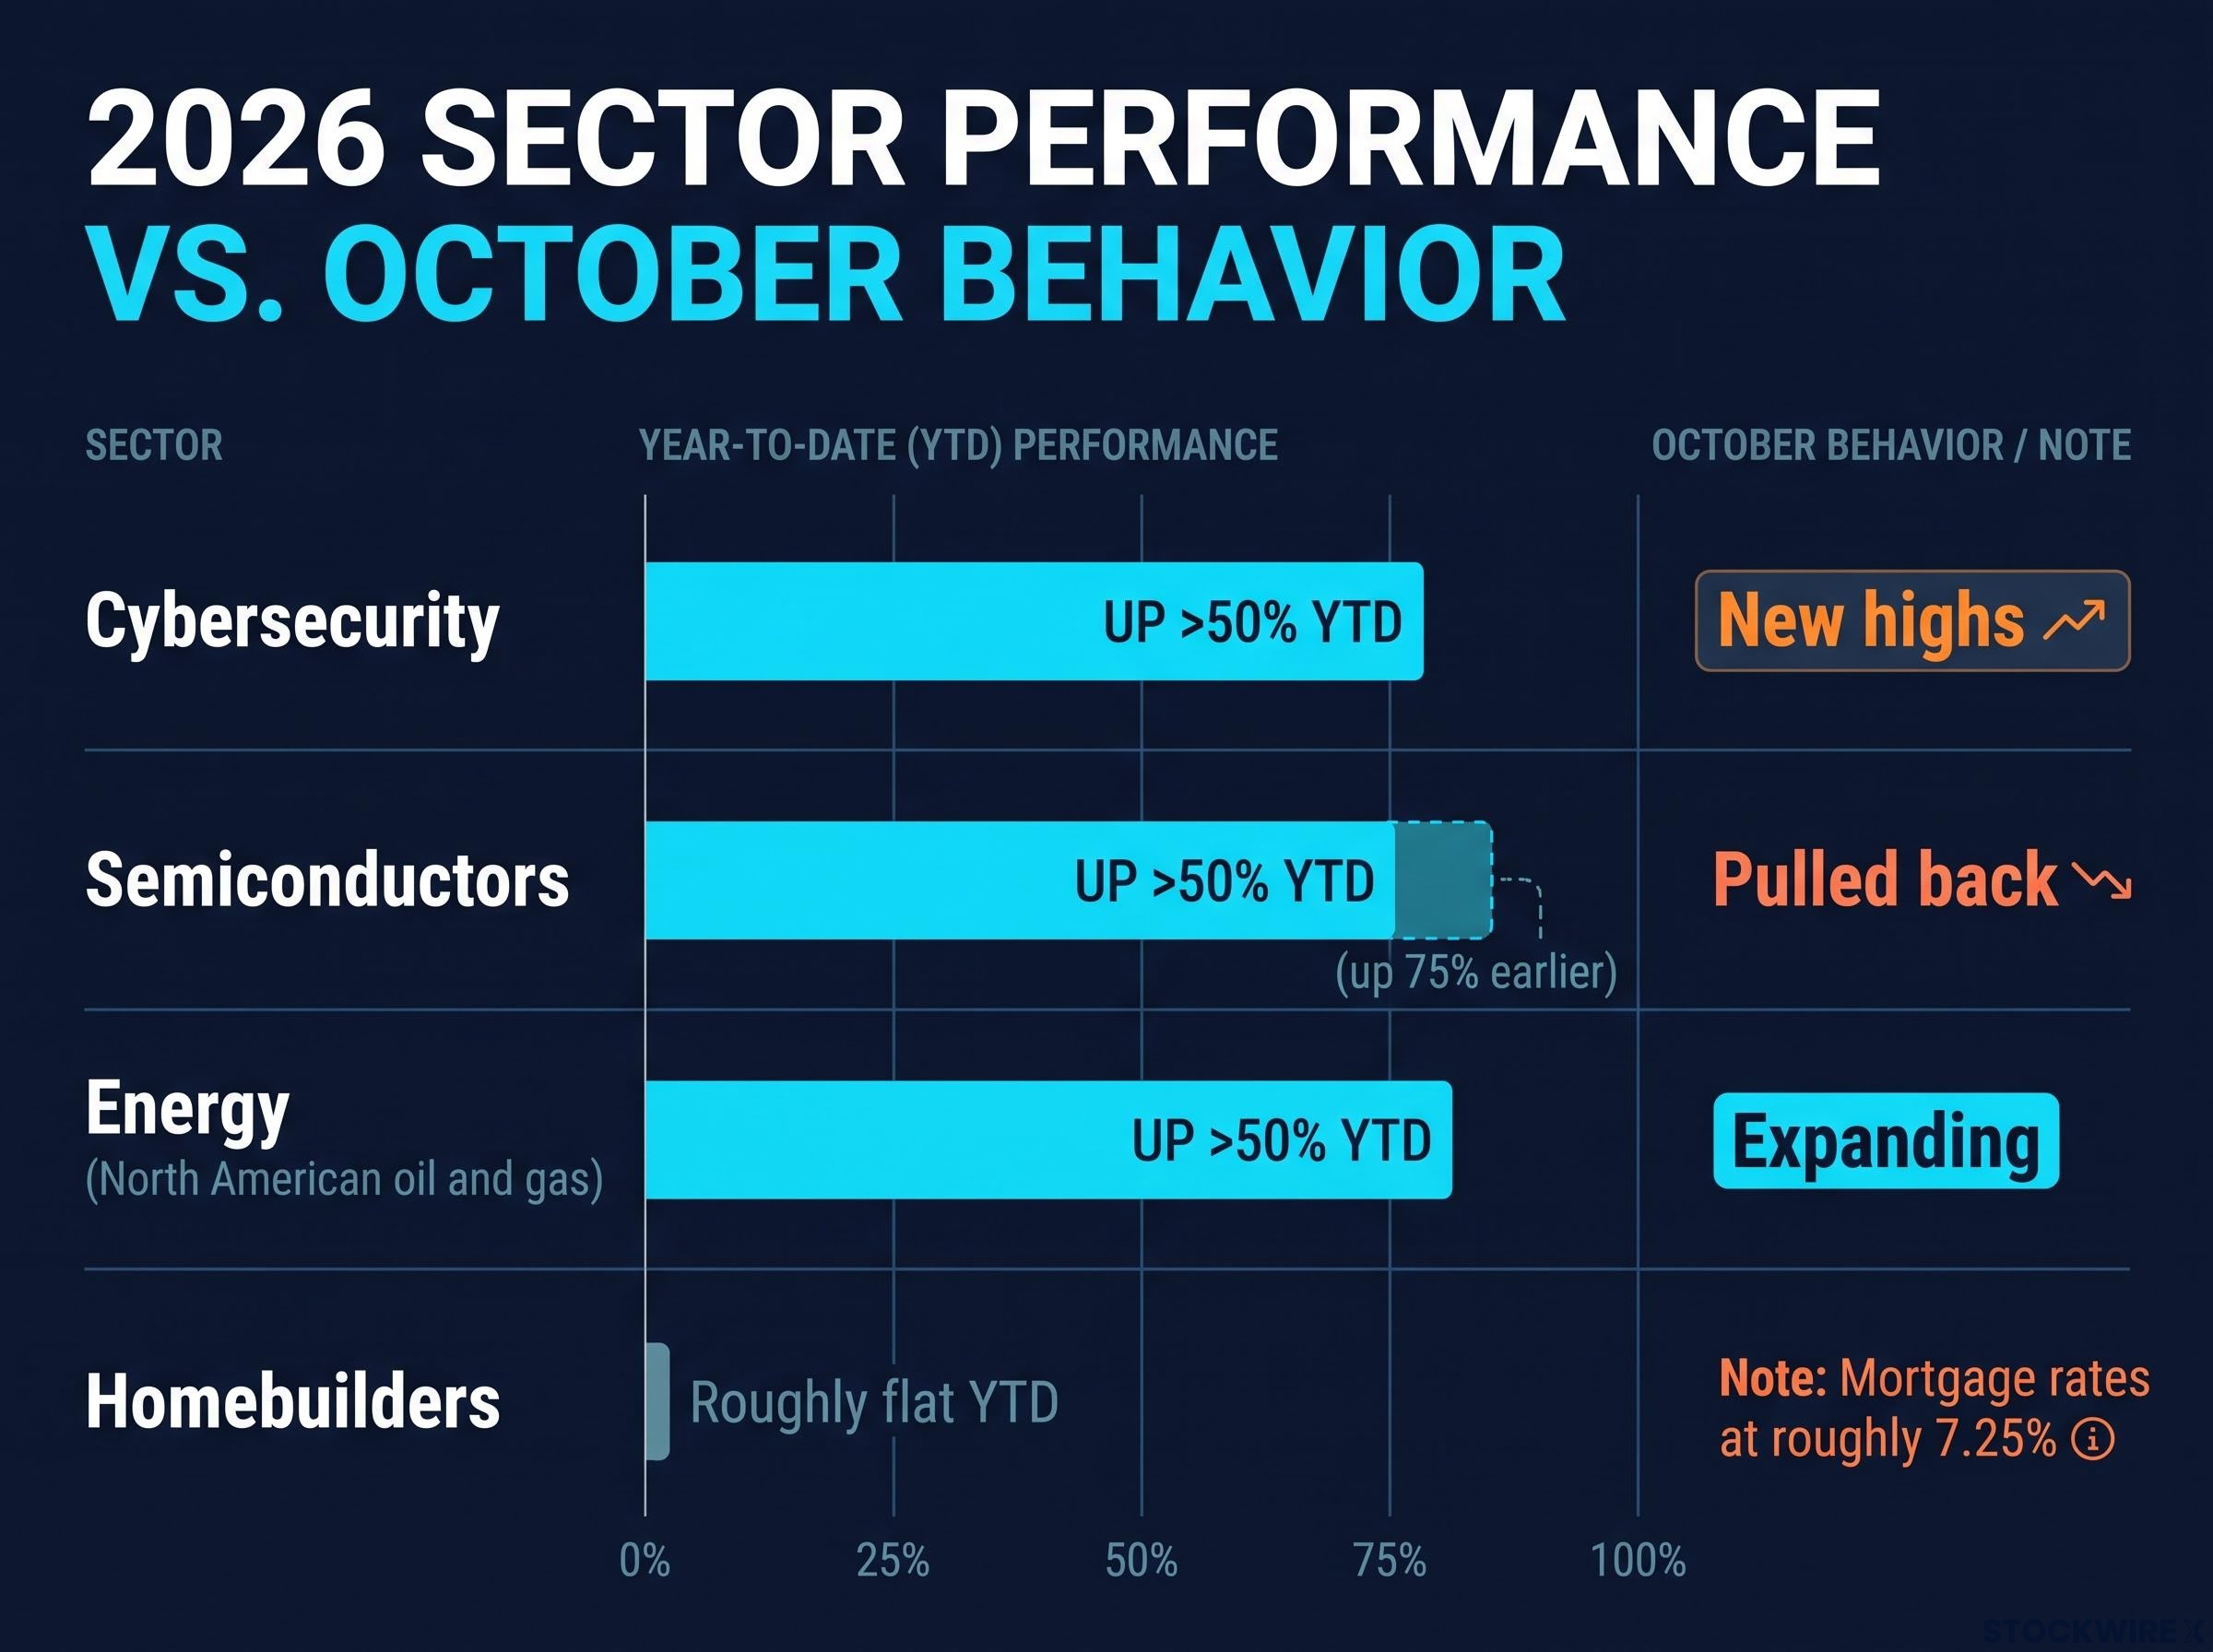
Homebuilders sit closest to the mortgage channel. They are roughly flat for the year despite high rates and surging fuel costs, which Greer reads as relative strength worth watching if yields have peaked. Wider mortgage spreads or weakening employment could still blunt the benefit.
The margin grind facing builders, where buydowns and price cuts erode gross margins even as orders hold steady, shows why relative strength is not the same as health.
Cybersecurity benefits through discount rates, since much of its value sits in long-dated cash flows and security budgets tend to hold up better than other tech spending. Cybersecurity and cloud storage hit new highs in October.
Where the link broke
Semiconductors should have gained from falling yields. Instead they pulled back after a run that had them up 75% earlier in the year, because investors feared financing trouble in AI infrastructure would slow the investment cycle. Reuters described markets as focused more on AI financing and deficits than on the Fed.
| Sector | Transmission channel | October behaviour | Main offset |
|---|---|---|---|
| Homebuilders | Mortgage rates, financing costs | Roughly flat year to date, relative strength | Mortgage spreads, employment |
| Cybersecurity | Lower discount rates | New highs | Broader tech sentiment |
| Semiconductors | Lower discount rates | Pulled back | AI financing stress |
| Energy | Easier financial conditions | Expanding; commodity index at records | Oil supply, geopolitics |
Energy runs on separate fuel. With the Bloomberg commodity index at record highs, the sector can outperform while yields rise. Greer reports North American oil and gas, energy, cybersecurity and semiconductors each up more than 50% year to date, while uranium, rare earths and industrial miners lag.
Correlations are low enough that Greer skips a view on the S&P 500 and works sector by sector. The takeaway for you is that a yield peak helps sectors differently depending on why yields fell, so the same bond move can be a tailwind for homebuilders and a warning for semiconductors.
Peak or pause: the case against a confirmed top
Who says peaked, who disagrees
The peak camp is persuasive. Greer believes the low in bonds is unlikely to be retested for a year or two, though he concedes back-and-fill selling is possible. J.P. Morgan described a reversal on 16 October, and Advisor Perspectives tied the rally to doubts about AI-driven growth and crowded shorts unwinding.
The sceptics carry equal weight. J.P. Morgan Asset Management expected yields to stay elevated while activity and jobs held firm, and J.P. Morgan’s Jay Barry flagged that the Treasury might trim long-end auction sizes, keeping supply central. BNY Chief Executive Robin Vince said a 10-year near 5.25% is not historically extraordinary, and Reuters analysts warned a rising term premium can keep long yields under pressure even if the Fed cuts.
The main risks to a lasting top are:
- Renewed oil-driven inflation delaying Fed easing
- Wider deficits and heavier Treasury issuance
- Back-and-fill selling after a crowded short trade cleared
- A growth shock that helps bonds but hurts cyclical sectors
These views are opinions and remain subject to change as data and market conditions develop.
What history adds
| Episode | Lesson | Comparability to 2026 |
|---|---|---|
| 1981 | Yields peaked only after aggressive tightening and recession | Limited; inflation and rates far lower today |
| 2007 | Long yields peaked before the financial crisis, then fell as growth cracked | Warning that a peak can hurt cyclicals and housing |
| 2023 | Multi-year highs on deficits and term premium, then a fall as expectations shifted | Closest modern analogue, though 2026 levels are higher |
The lesson cuts across all three episodes. A peak driven by cooling inflation tends to favour rate-sensitive equities, while one driven by recession or fiscal stress favours Treasuries and gold. Watch the cause, not just the level.
What to watch before calling a treasury yields peak confirmed
The weight of evidence points to a probable interim peak, not a confirmed secular top. Four signposts will sharpen the picture:
- October CPI and PPI: Due 10 November and 13 November; another rally on hot data would strengthen the regime-change reading.
- Long-end auctions: Watch demand and any cut to auction sizes.
- Oil’s direction: Brent above $113 keeps inflation risk alive.
- Cross-asset confirmation: Gold rising and the dollar softening alongside lower yields would be a cleaner signal.
Your decision point is less about whether yields have peaked and more about why they might have. When several of these signposts line up, the bond market’s message becomes far harder to dismiss.
Because the structural-versus-cyclical debate is unresolved, institutions often favour a barbell strategy that pairs short-duration quality bonds with a smaller long-duration allocation, rather than betting on a single outcome.
This article is for informational purposes only and should not be considered financial advice. Investors should conduct their own research and consult with financial professionals before making investment decisions.