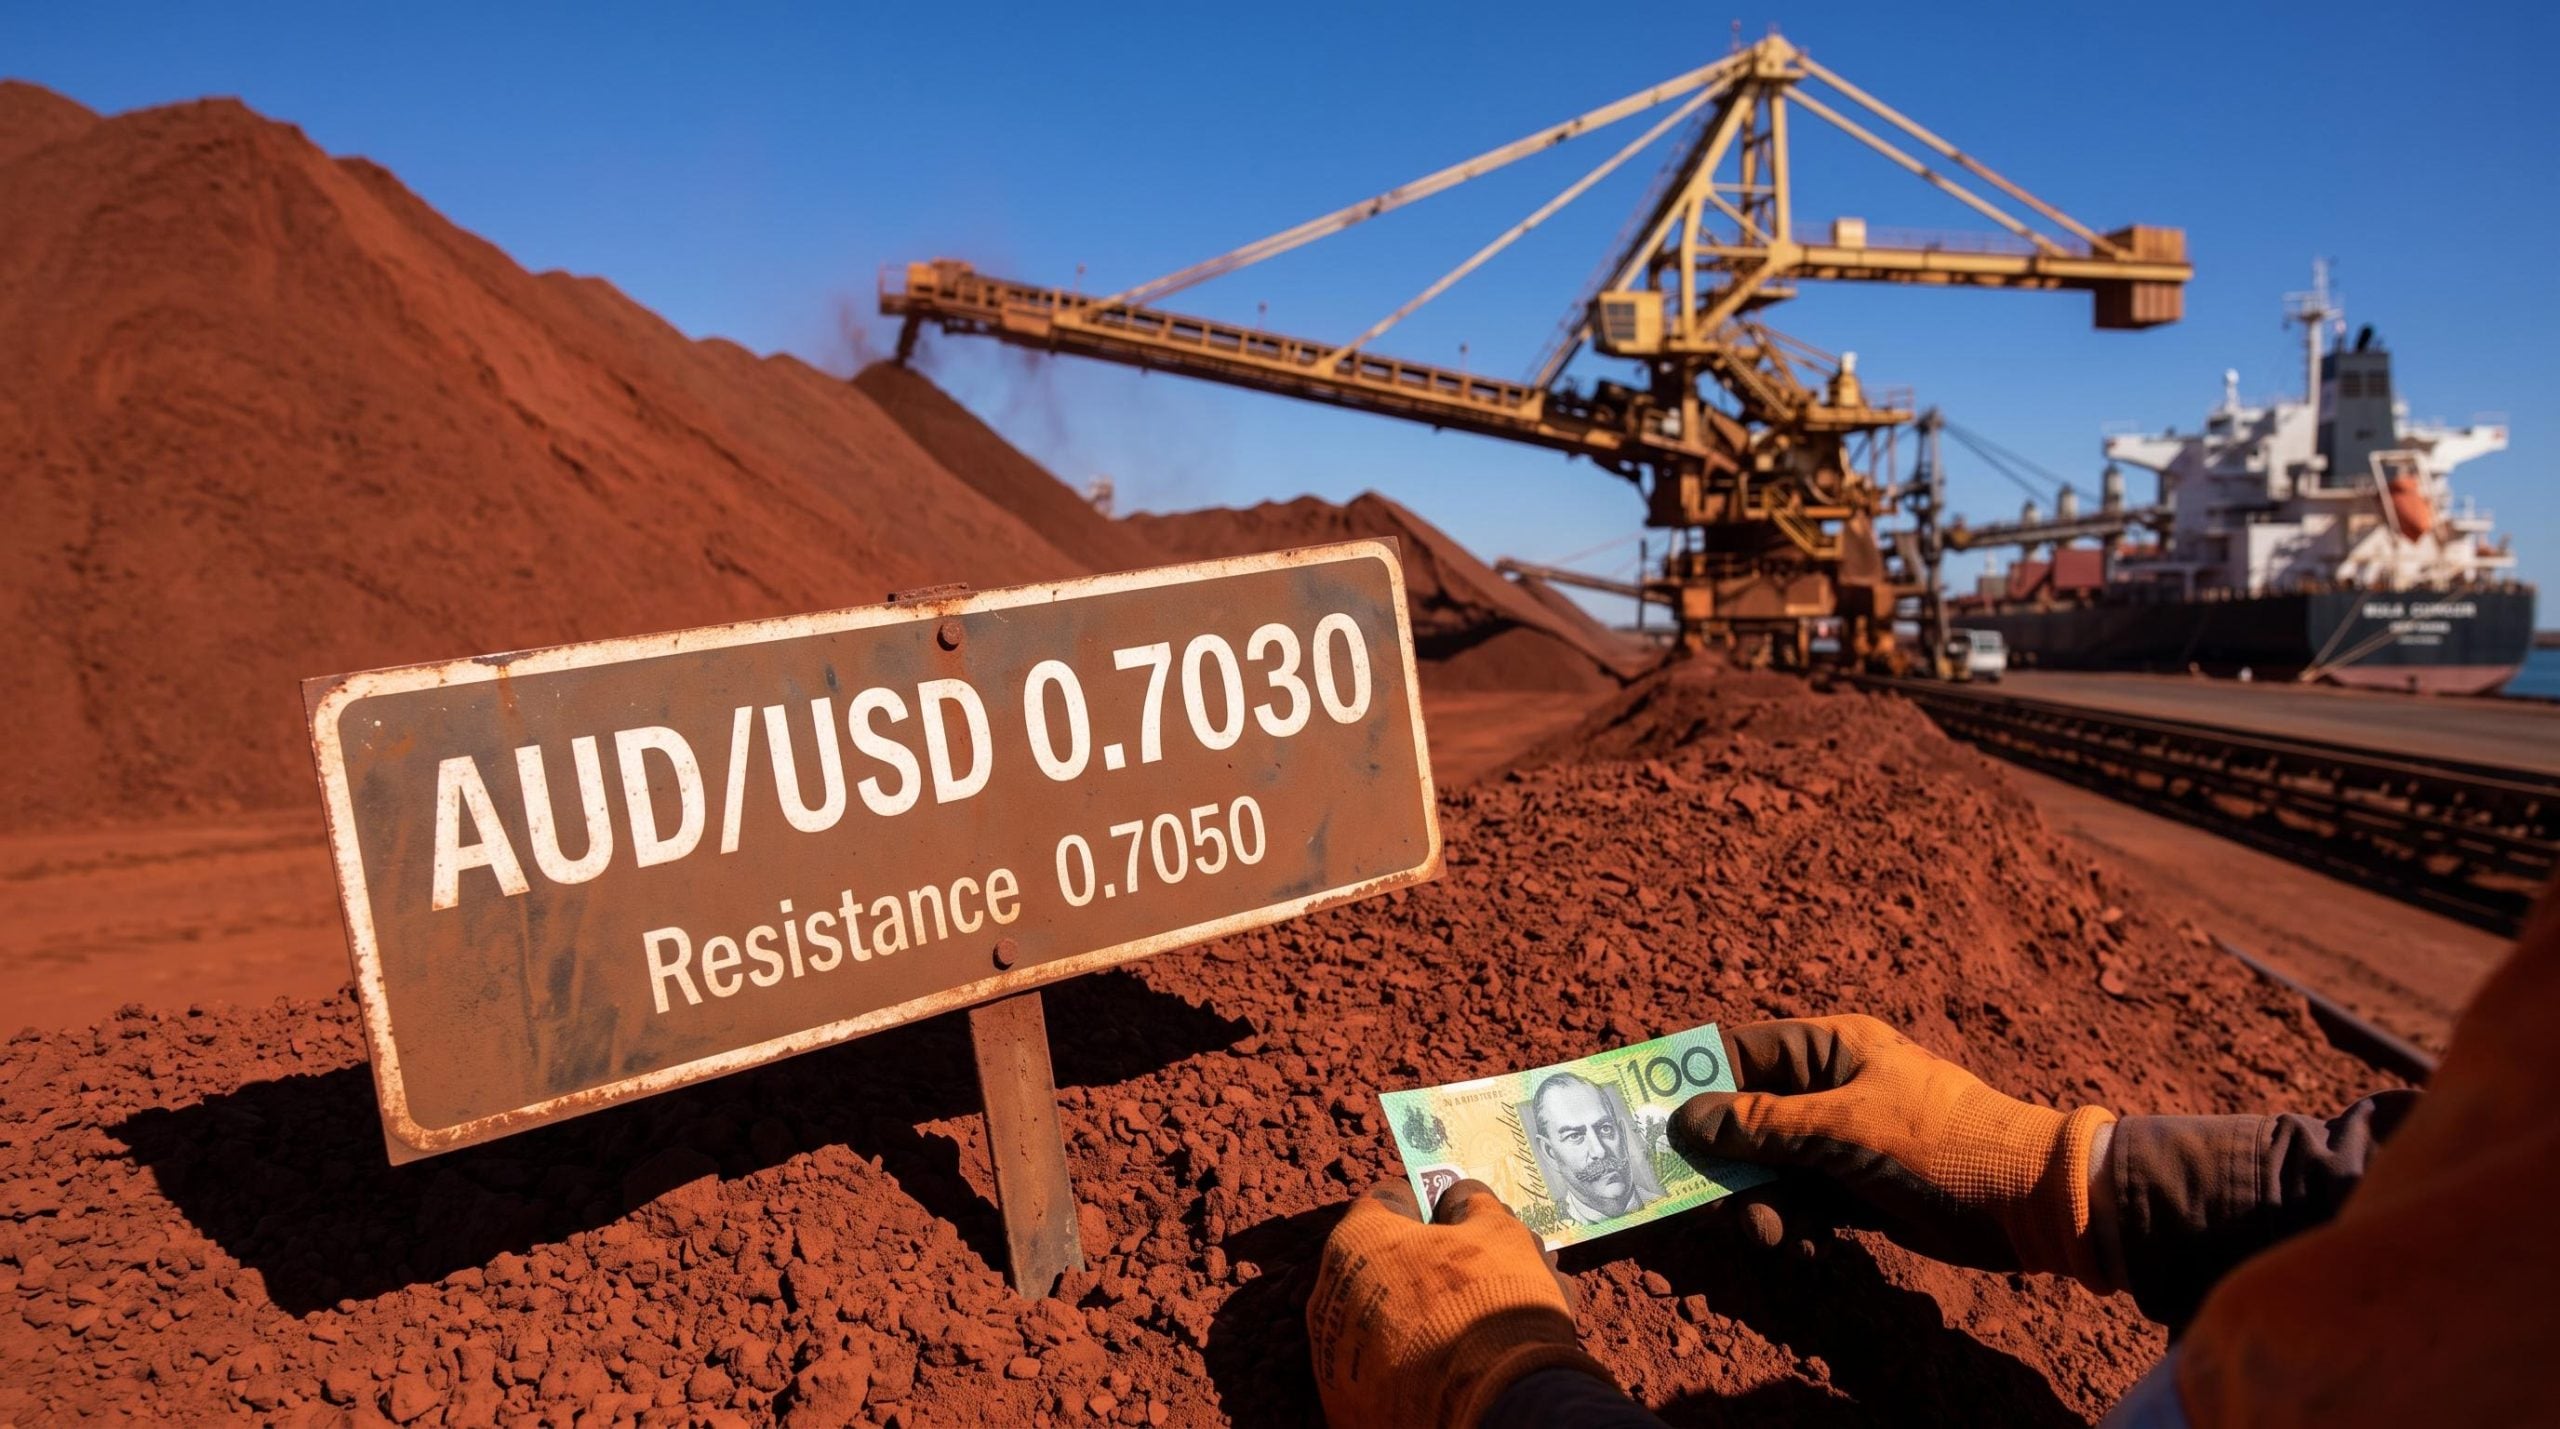
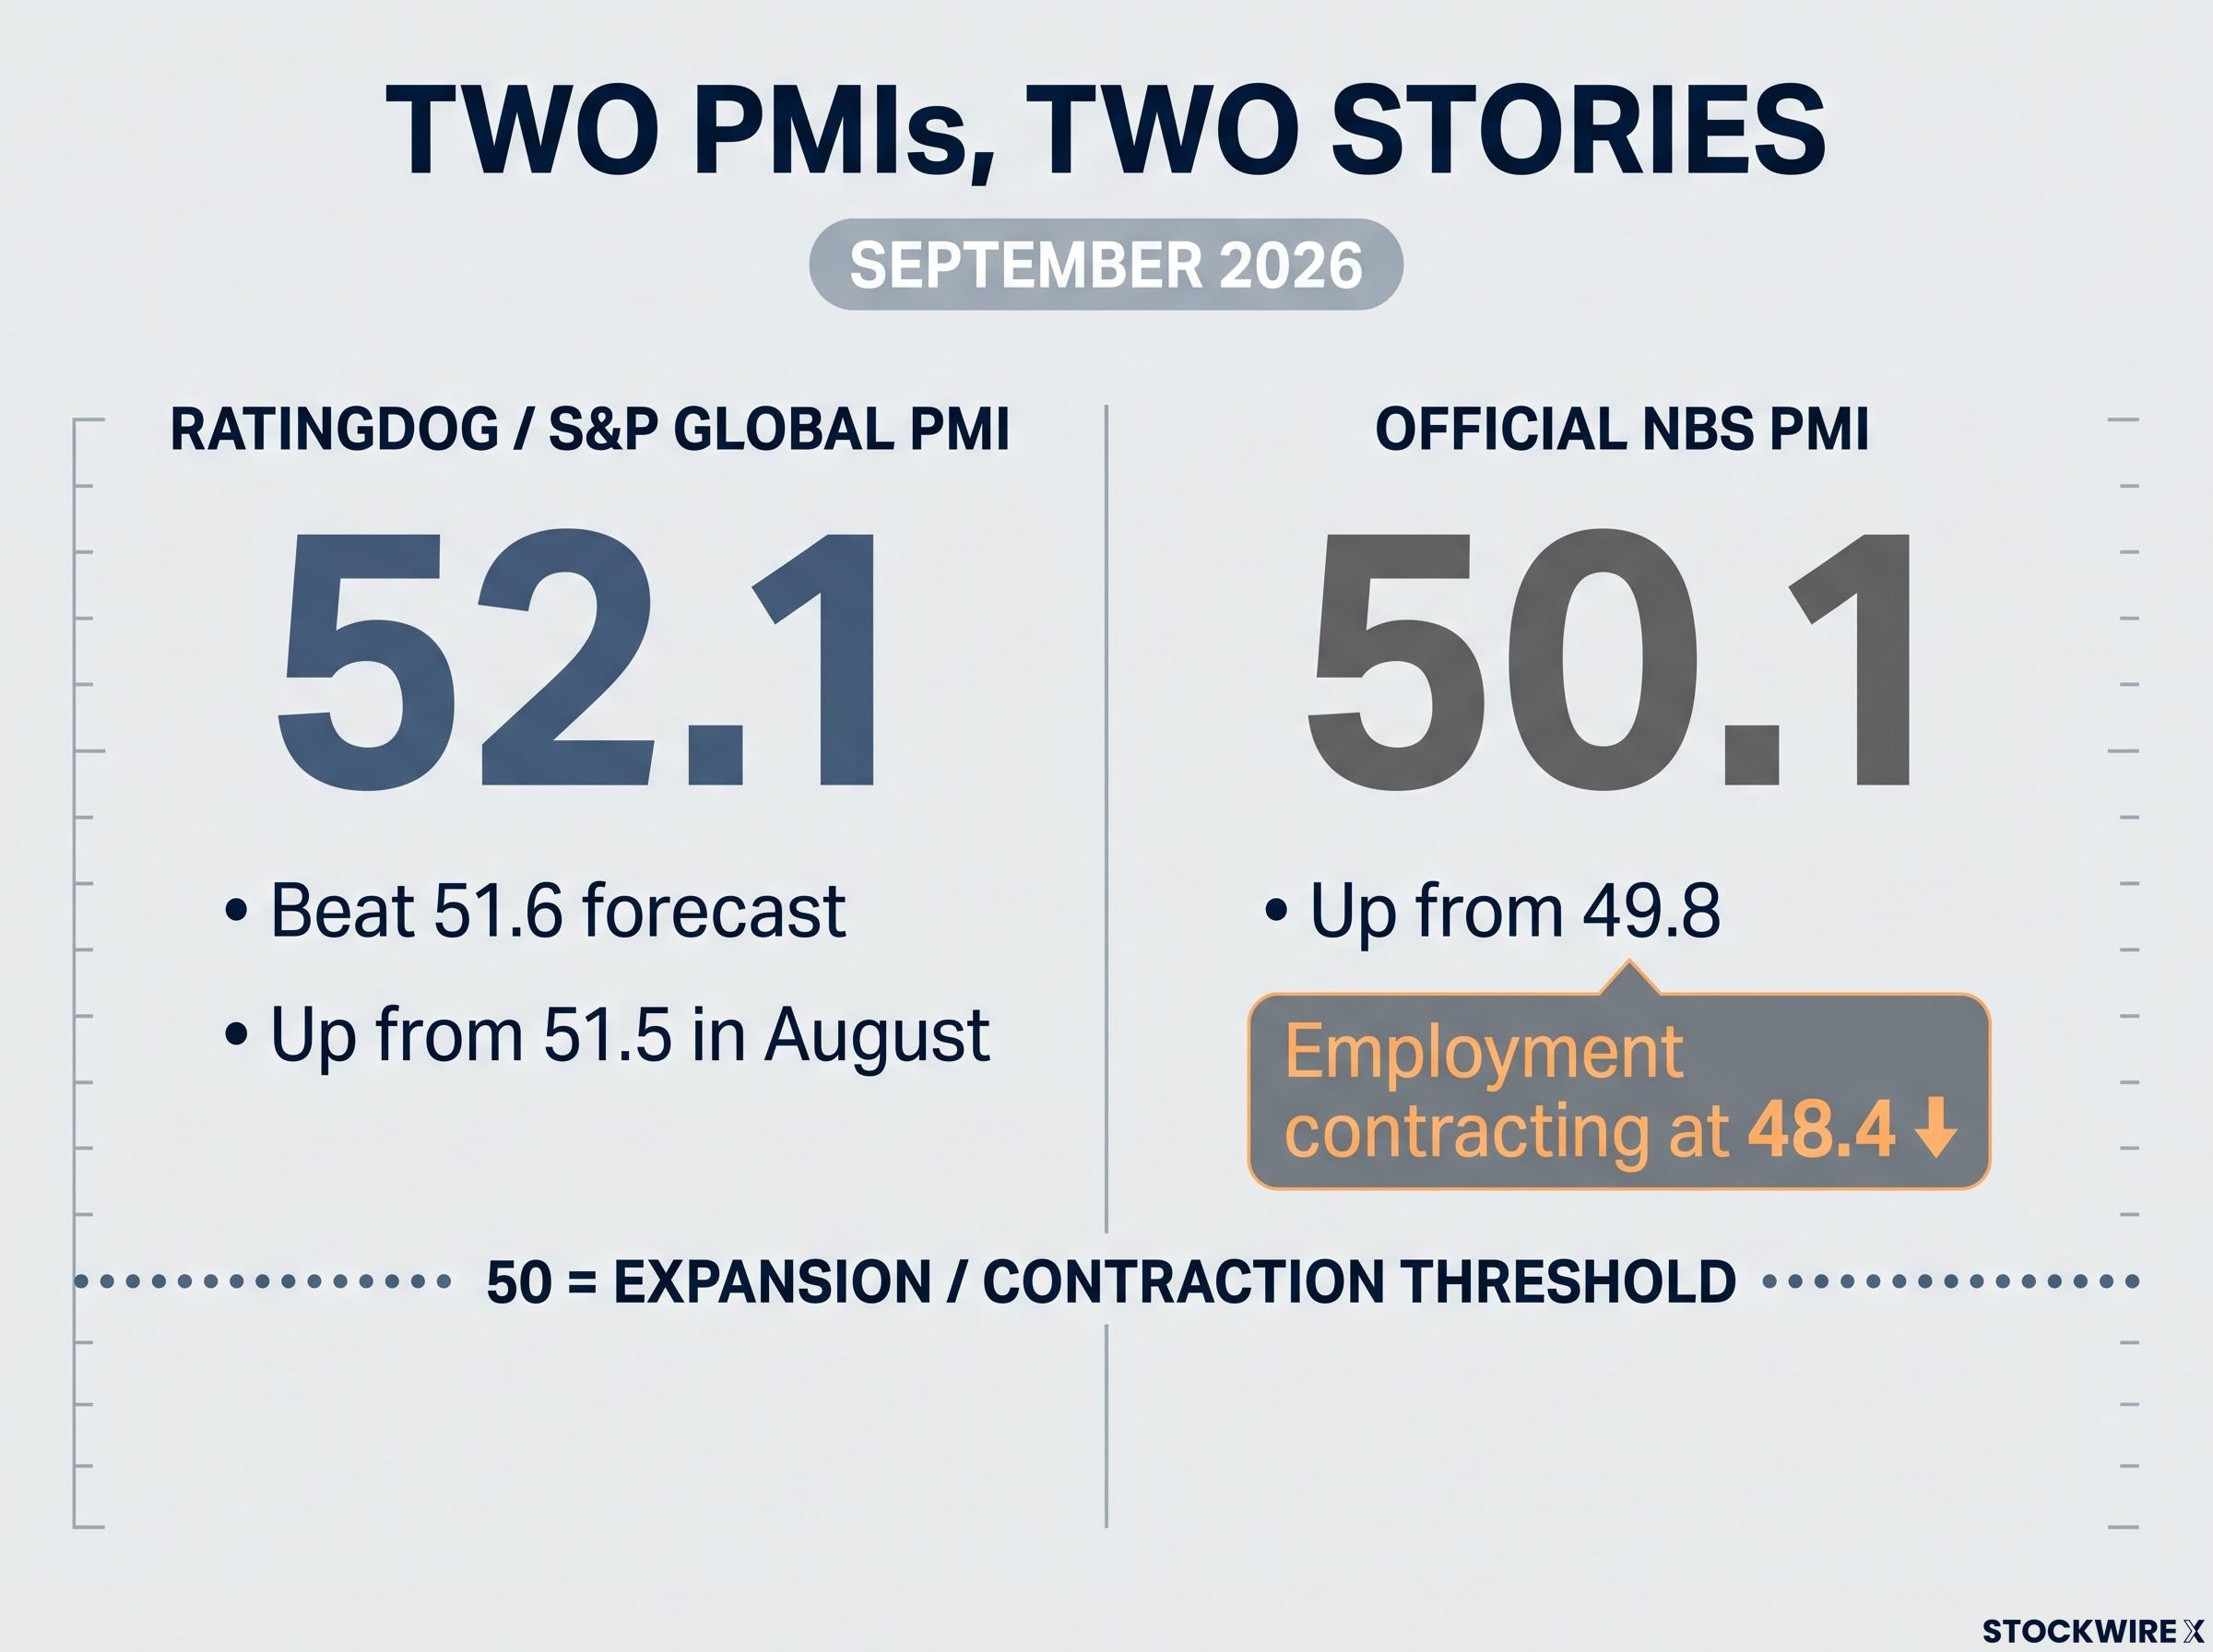
China’s private factory survey beat expectations in September, and the Australian dollar shrugged. The RatingDog/S&P Global manufacturing Purchasing Managers’ Index (PMI) came in at 52.1 against a 51.6 forecast, yet AUD/USD sits near 0.7030, still below 0.7050. If you assume strong China data lifts the Aussie, that gap is worth understanding before you form any Australian dollar outlook.
The reading was a rise, not a slip. It climbed from 51.5 in August to its strongest level in five months.
The timing explains the shrug. The Reserve Bank of Australia (RBA) decides on rates tomorrow, Tuesday 3 November 2026, and markets expect the US Federal Reserve (Fed) to hike in December. Two central banks moving in the same direction leave little room for a single survey to steer the currency.
Here is a repeatable way to judge whether the next China data point will actually move the AUD, or simply get absorbed.
Why did a stronger China PMI barely move the Australian dollar?
On paper, September’s survey was a clean win. A PMI is a monthly survey of factory purchasing managers, where any reading above 50 signals expansion and below 50 signals contraction. RatingDog’s 52.1 beat consensus by 0.5 points, with total new orders growing at the fastest pace since June.
The detail looked even better. New export orders rose for a third straight month to a seven-month high, and employment edged up marginally.
So why the flat response? Because the currency was taking its cues from bigger forces.
Two PMIs, two stories
China publishes two manufacturing PMIs. The official National Bureau of Statistics (NBS) reading rose to 50.1 from 49.8, back into expansion but only just, with employment still contracting at 48.4.
The gap comes down to who gets surveyed. RatingDog gives more weight to smaller private and export-focused manufacturers, while the NBS captures larger and state-linked firms. The surveys do not contradict each other, but the split weakens the case for a broad Chinese acceleration.
That left the PMI as a positive, partly expected signal rather than a demand shock. Meanwhile, the rest of the market was moving in other directions.
| Factor | What happened | Effect on AUD |
|---|---|---|
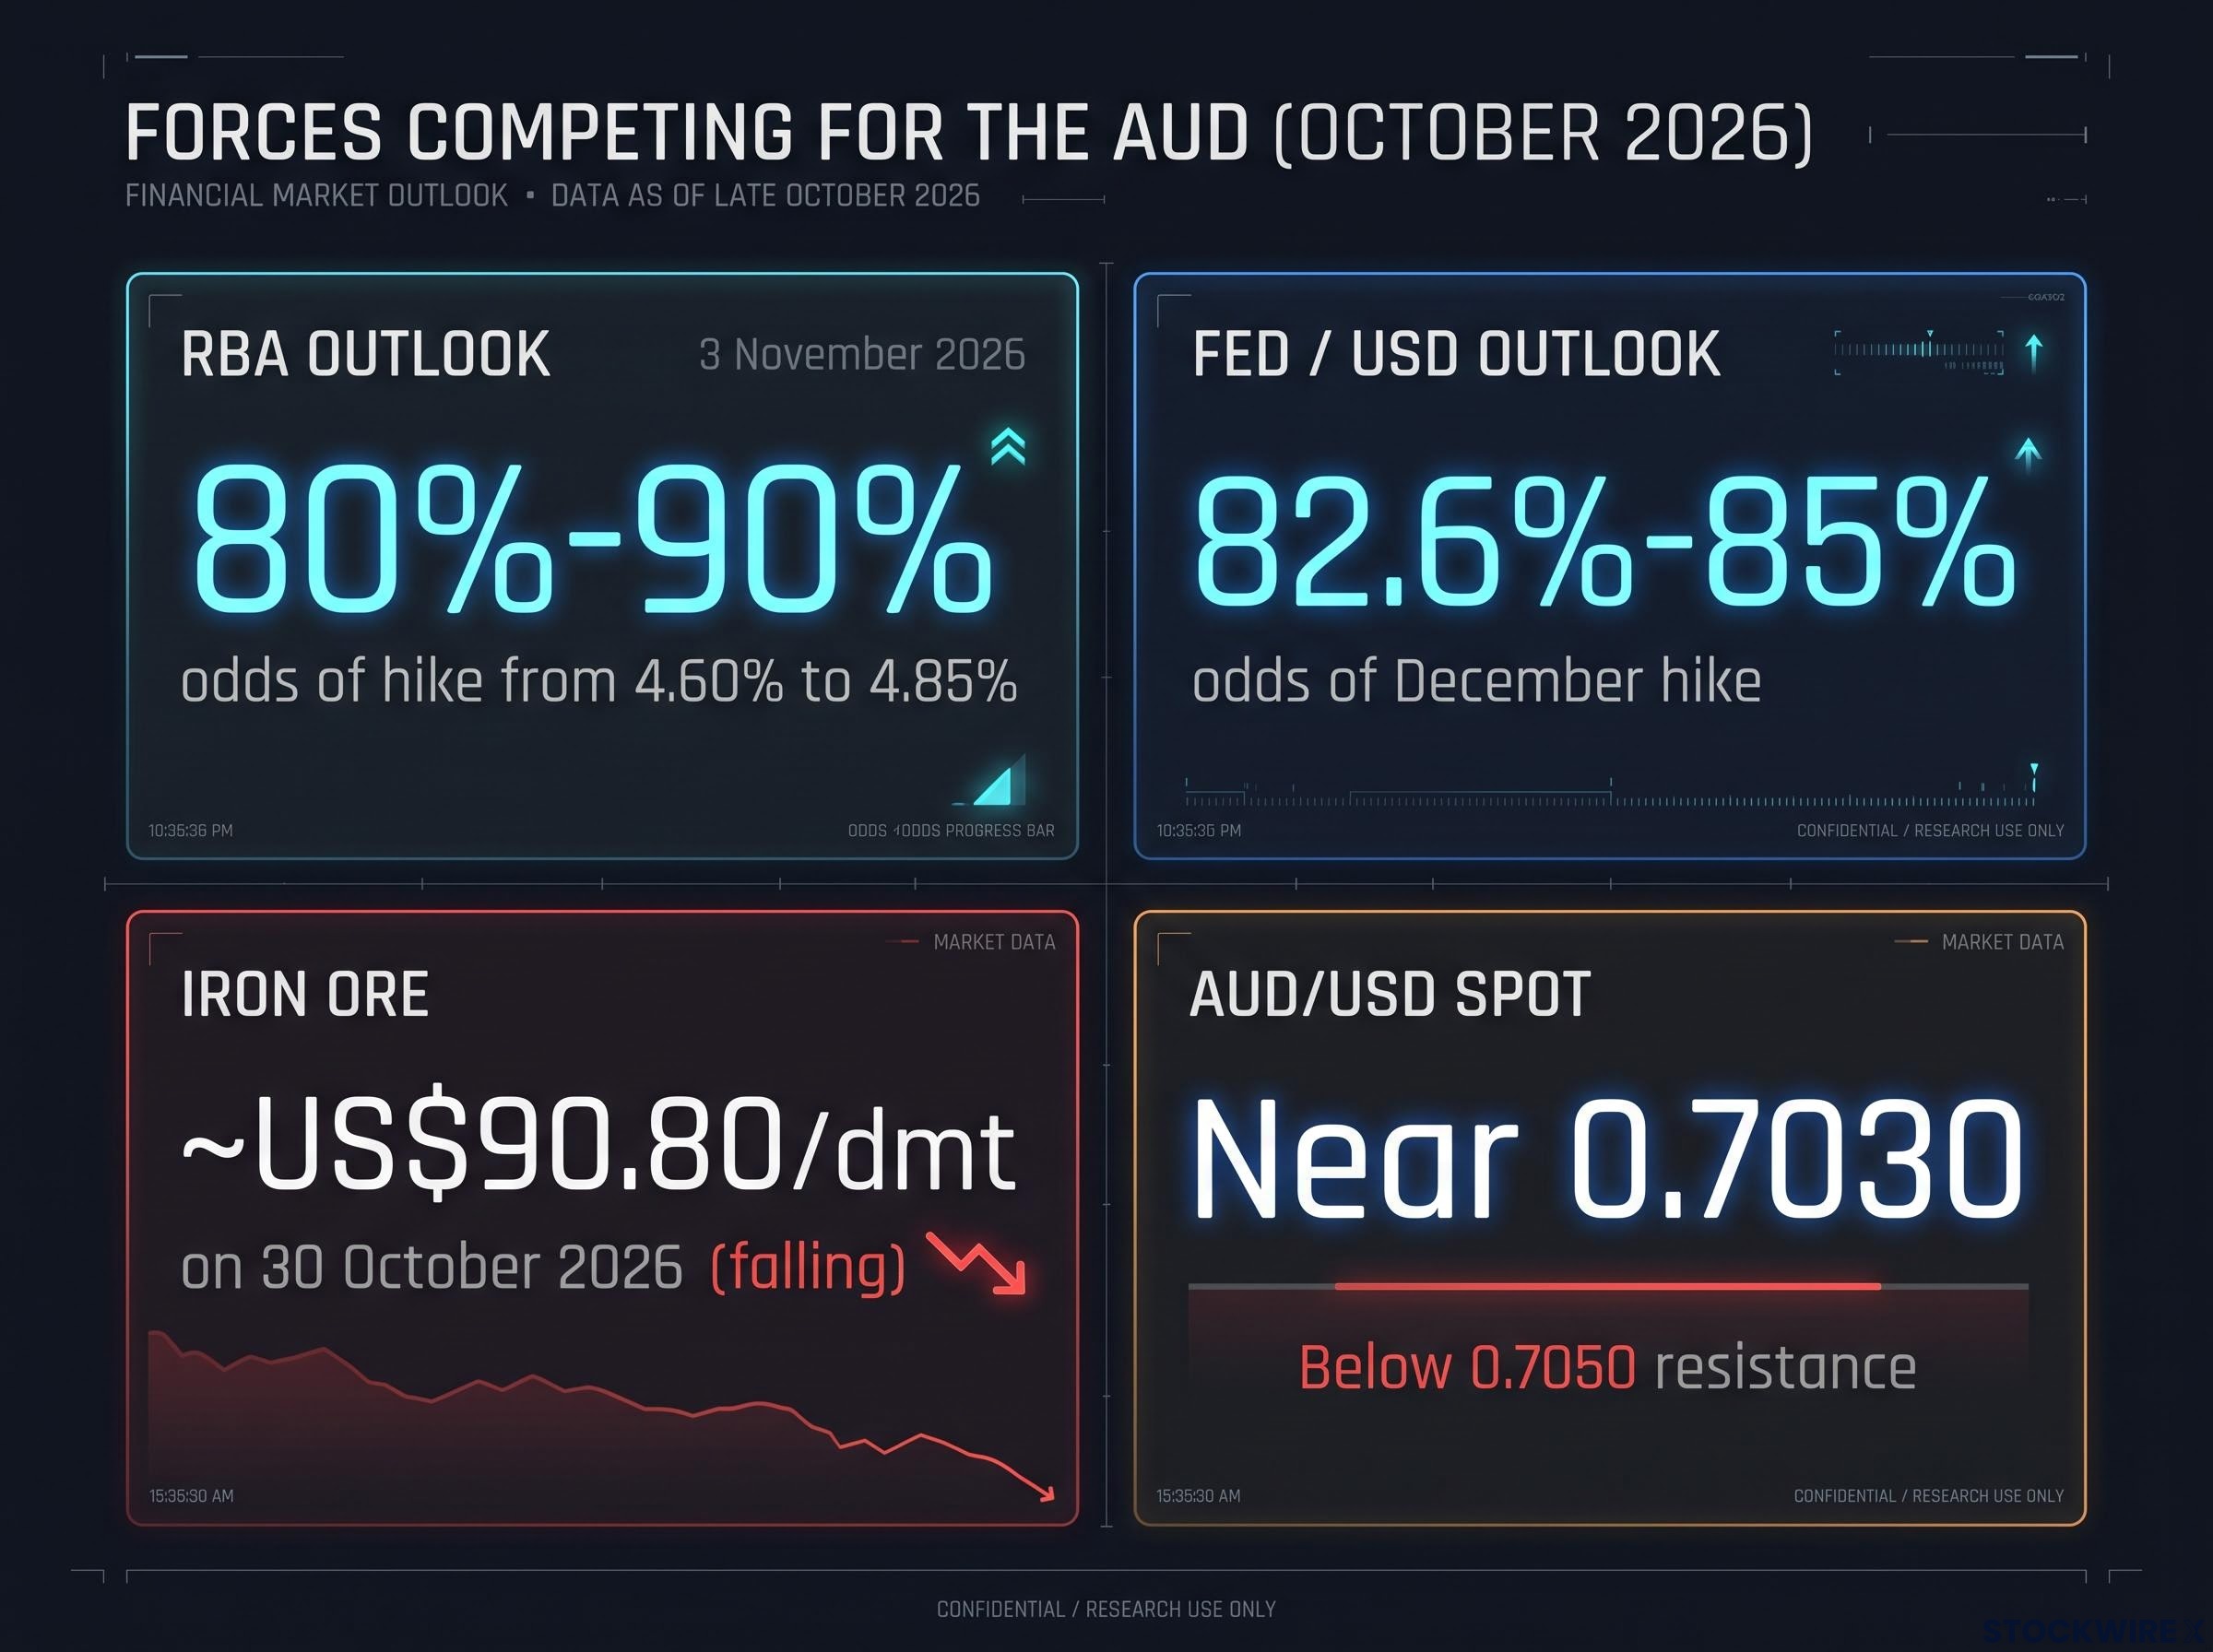
| RBA repricing | September CPI of 4.3% and trimmed mean of 3.6%; about 80% odds of a hike to 4.85% from 4.60% (Westpac, Reuters) | Supportive, but largely priced |
| Fed/USD | December Fed hike priced at roughly 80% or higher | Firmer USD capped AUD upside |
| Split China PMIs | RatingDog 52.1 vs NBS 50.1 | Muted confidence in broad recovery |
| Iron ore | About US$90.80/dmt on 30 October 2026 and falling | Weak commodity confirmation |
When both the RBA and the Fed are expected to tighten, you should expect a China surprise to be absorbed by interest rate differentials and the US dollar’s direction rather than driving the AUD on its own. An interest rate differential is simply the gap between rates in two countries.
The mechanics of how the Fed moves the dollar run through yield differentials, balance-sheet policy and market pricing, which is why a December hike that is already largely priced can still keep the US currency firm and cap AUD upside.
When big ASX news breaks, our subscribers know first
What actually drives the Australian dollar?
To see why one survey got drowned out, it helps to lay out the forces that compete for control of the currency. Five do most of the work:
- RBA policy: The RBA targets inflation of 2-3%. Higher rates than in other major economies attract capital and support the AUD, and quantitative tightening (the central bank shrinking its bond holdings) also helps.
- China demand: China is Australia’s largest trading partner, so stronger Chinese growth lifts demand for Australian goods.
- Iron ore: Australia’s largest export, worth about $118 billion a year on 2021 data, mostly sold to China.
- Trade balance: Exports above imports support the AUD. The goods surplus shrank to $495 million in August from $1.351 billion in July, down $856 million (ABS, 1 October 2026).
- Risk sentiment: When investors feel confident (risk-on), the AUD tends to rise; when they turn cautious (risk-off), it tends to fall.
These drivers link together. A Chinese data point reaches the AUD through a chain:
- Chinese demand
- Steel production and construction activity
- Iron ore imports
- Australian export receipts
- Terms of trade (the price of exports relative to imports)
- RBA outlook and foreign capital flows
- The AUD
Any broken link weakens the signal. In October, iron ore fell more than 2% on ample supply and high Chinese port stocks, heading toward a four-year month-end low. The chain snapped at step three, despite improving PMIs.
The key point: A strong China PMI helps the AUD only when it changes expectations for commodity demand and Australia’s terms of trade.
The drivers also compete, and whichever is strongest at the time tends to win. For you as an AUD watcher, a China data point matters only to the extent it travels the full chain, so check whether iron ore and yields are confirming it before reading too much into the headline.
How to read a China PMI surprise: a four-step check
That chain becomes practical once you turn it into a checklist. Here it is, applied to the September release:
- Compare with 50 and consensus. RatingDog’s 52.1 was 0.5 above consensus and 0.6 above August, an ordinarily positive surprise.
- Check the composition. A beat driven by new orders, export orders and hiring is more meaningful than one built on inventories. September rested on new orders (fastest since June), exports and marginal employment gains, which is constructive.
- Cross-check the official PMI. NBS at 50.1 with employment at 48.4 kept the signal positive but less convincing.
- Check iron ore and the rate differential. With iron ore near US$91/t and falling, and the US dollar supported by Fed hike pricing, the PMI had little lasting effect.
September 2026 in one line: A good private factory print, a lukewarm official one, sliding iron ore and a firm US dollar added up to a currency that barely moved.
The lesson is that a positive surprise does not automatically produce a large rally. The currency responds to the net effect of Chinese demand, commodity prices, Australian and US yields and global risk appetite.
One honest caveat: fully sourced historical examples of AUD reactions to specific China PMI surprises since 2024 were not available, so this method rests on the September case rather than a back-tested record. You can still run the four steps within minutes of any release to decide whether it deserves a position change or just a note.
What could move the AUD next: the RBA, the Fed and China risks
If China data struggled to move the currency, the next real move is more likely to come from tomorrow’s RBA decision. A 25 basis point hike (a quarter of a percentage point) to 4.85% is priced at roughly 80% by Westpac and Reuters and around 90% in InvestingLive coverage.
CBA switched its November call from hold to hike after the CPI release, and Westpac sees December as likely the final hike of the cycle. Because the move is largely expected, the hike itself may do little; the guidance on what follows matters more.
The RBA rate hike impact on households is already visible, with consumer sentiment at multi-decade lows and home values falling for six straight months, which is part of why the guidance after tomorrow’s decision matters more than the move itself.
Across the Pacific, Fed December hike pricing sits around 82.6%-85%, keeping the US dollar firm. Technically, the AUD faces resistance near 0.7050, a level it has struggled to clear.
| Scenario | What it looks like | Likely AUD effect |
|---|---|---|
| Hawkish RBA surprise | Higher inflation forecasts or guidance for more tightening | Supportive via higher yields |
| Hike but near the end | 25bp move with signals the peak is close | Initial support could fade, especially if US yields keep rising |
| Fed or USD shock | Fed reinforces a December hike | Narrower policy advantage weighs on AUD |
| China disappoints | Weak stimulus, split data or soft iron ore | Weakens the terms-of-trade channel |
| Risk-off shock | Geopolitical stress, such as Iran headlines | Safe-haven USD demand could overwhelm China data |
Westpac has flagged that global risk conditions and higher oil prices are weighing on markets around the RBA meeting, and Iran has warned of wider strikes against the US despite progress in talks. Because the RBA hike is largely priced, you should watch whether the statement points to more hikes, not the hike itself, to judge where the AUD goes next.
Reading the Australian dollar’s next move without chasing every data point
September’s PMI was good news for China’s private factories. It just was not the news the AUD was waiting for. The currency’s direction now rests on RBA guidance, the Fed’s path, iron ore and risk sentiment.
Four variables will tell you more than the next headline:
- The RBA statement on 3 November, especially any hint of further hikes
- US ISM Manufacturing and Friday’s non-farm payrolls (NFP) jobs report
- Iron ore relative to US$90
- Whether AUD/USD can break 0.7050
If several line up in the same direction, a move becomes more likely. If they pull against each other, expect more of September’s quiet.
This article is for informational purposes only and should not be considered financial advice. Investors should conduct their own research and consult with financial professionals before making investment decisions.