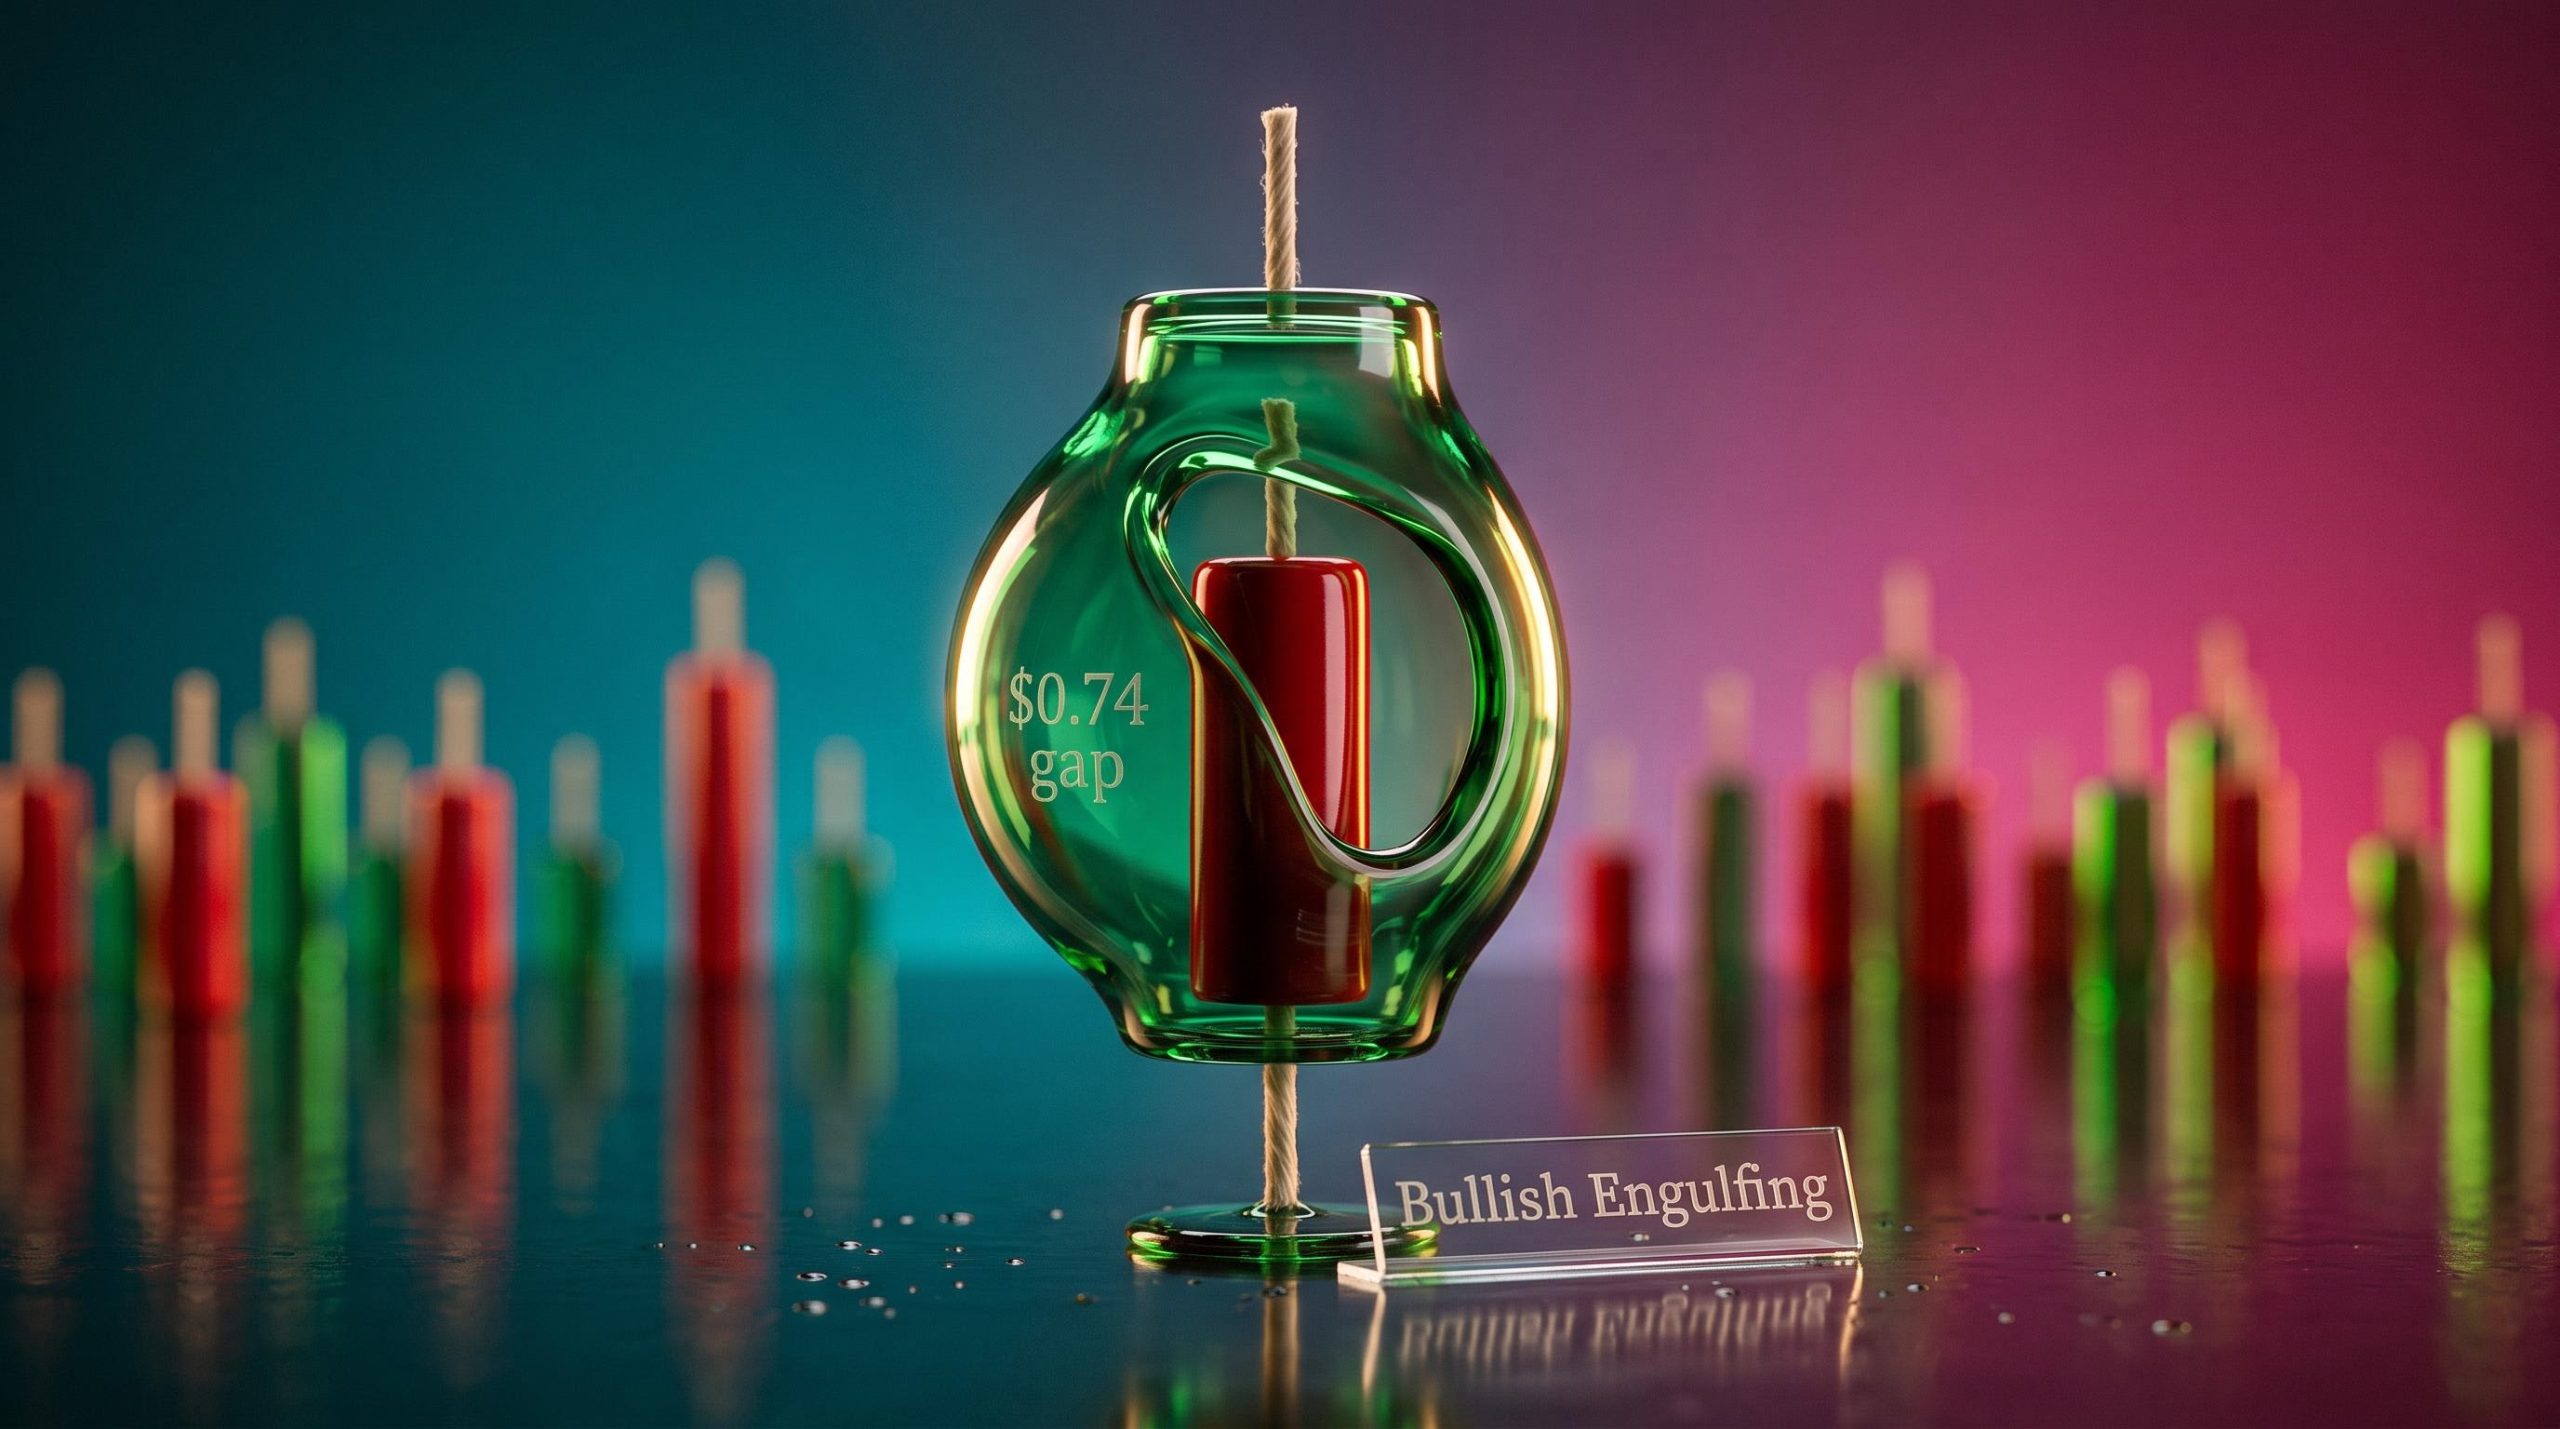
Most traders think any green candle that swallows the red one before it is a bullish engulfing candle. Apple’s chart from Tuesday, 27 October 2026, shows how thin that line really is. The stock opened just $0.74 below Monday’s close, a gap small enough to look like nothing, and the candle still passed every test.
This week gave you a useful set of examples. Apple, Verizon and American Express all printed engulfing pairs on 26-27 October, so you have three recent, real candle pairs to check your own pattern recognition against.
The stakes are simple. If you label a setup wrongly, you end up building a trade on a signal that was never there.
Here is a precise checklist for validating both the bullish and bearish versions. It comes with three live examples showing what a clean setup, a messy one and a disappointing one look like.
What makes an engulfing candle valid? The four conditions for each pattern
You probably carry a rough rule in your head: a bigger candle covering a smaller one. That rule lets too much through. The definitions from Investopedia (updated 30 October 2026), Fidelity (updated 14 October and 24 October 2025) and Charles Schwab (updated 6 March 2026) all rest on real bodies. A real body is the thick part of a candle, running from the opening price to the closing price.
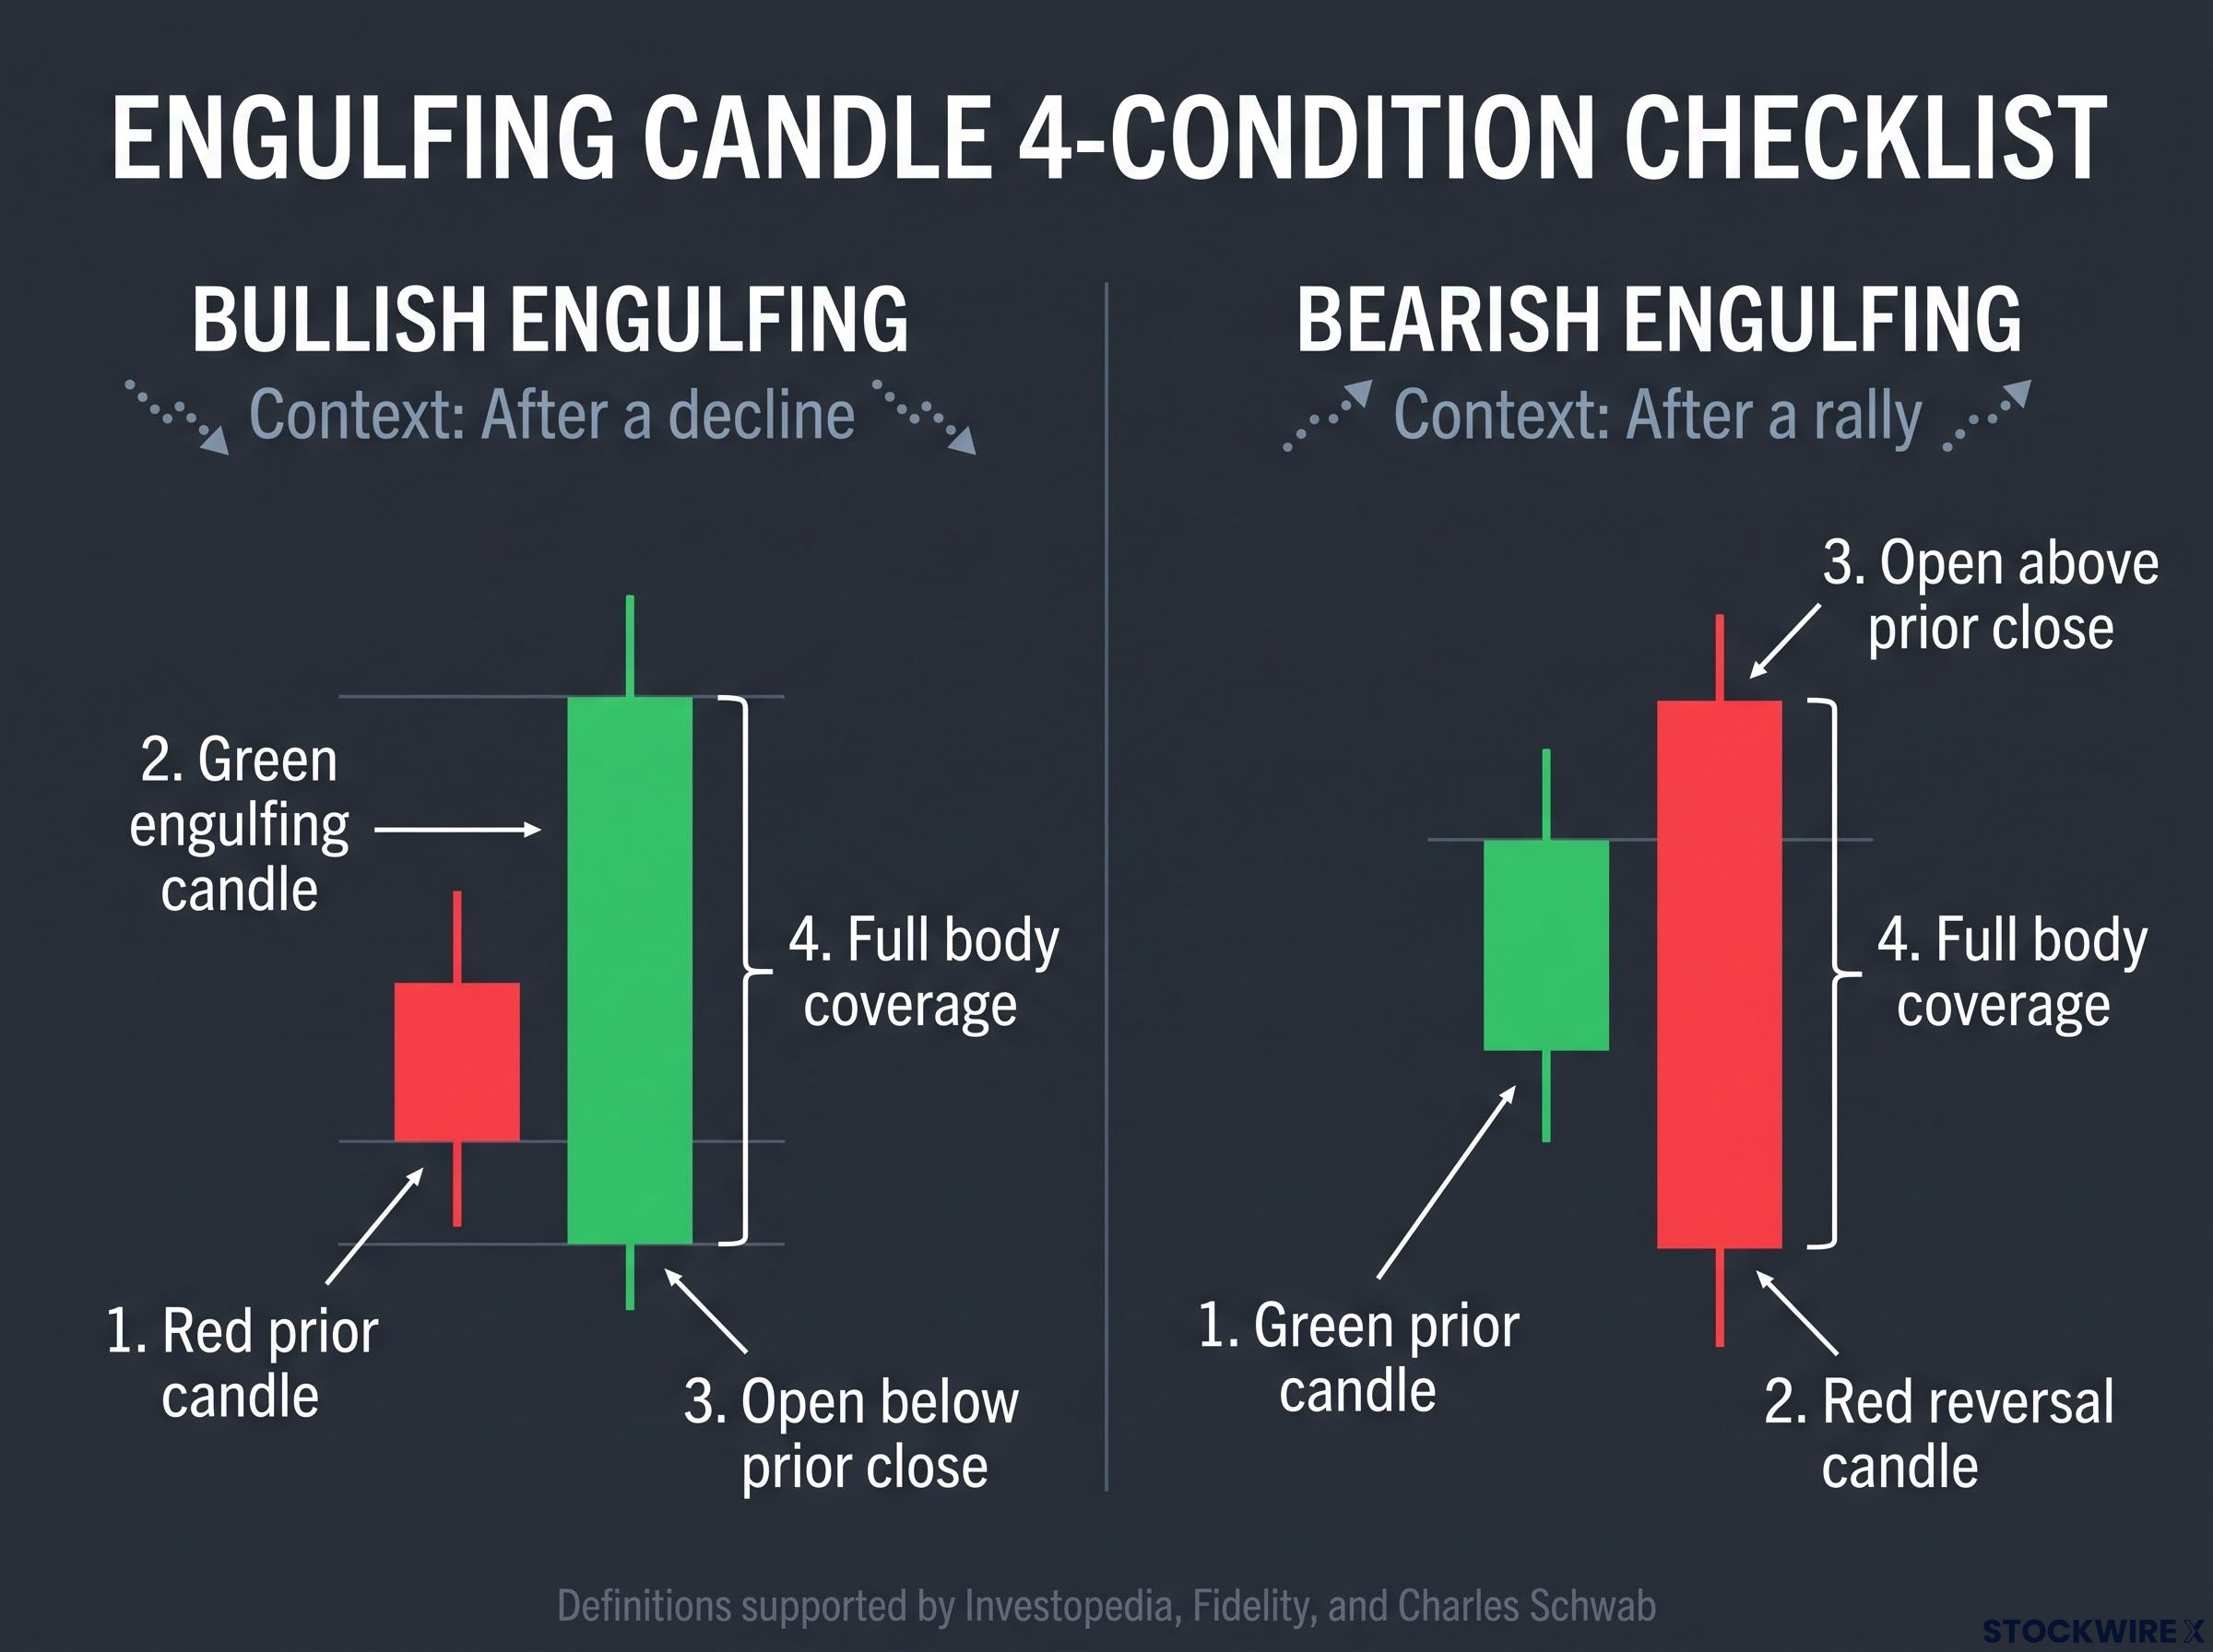
A bullish engulfing pattern needs all four of these:
- Red prior candle. The first candle closes below its open.
- Green engulfing candle. The second candle closes above its open.
- Open below the prior close. The second candle starts lower than where the first one finished.
- Full body coverage. The second body covers the entire first body.
The bearish engulfing pattern mirrors it:
- Green prior candle. The first candle closes above its open.
- Red reversal candle. The second candle closes below its open.
- Open above the prior close. The second candle starts higher than the first one finished.
- Full body coverage. The second body covers the entire first body.
The key rule Covering the prior candle’s range is not enough; the body must fully cover the prior body.
The range is the full distance from high to low, including the thin lines (wicks) above and below the body. If the second candle also swallows the first candle’s wicks, sources treat that as a strength factor, not a basic requirement. Fidelity adds that the tops or bottoms of the two bodies may line up, but not both, and it separates engulfing patterns from outside days.
| Feature | Bullish engulfing | Bearish engulfing |
|---|---|---|
| Prior candle colour | Red | Green |
| Reversal candle colour | Green | Red |
| Open position | Below prior close | Above prior close |
| Trend context | After a decline | After a rally |
Lawton Hope of Verified Investing compares the pattern with doji candles, which open and close at almost the same price and hint at a milder shift. The engulfing candle makes a louder claim.
If a candle fails any one of the four conditions, treat it as a different formation altogether, not a weaker version of the pattern.
When big ASX news breaks, our subscribers know first
Why does the second candle signal a shift in control?
On your screen, the pattern is easy to spot: a small candle, then a larger opposite-coloured one wrapped around it. The reason it matters sits inside the second session.
Investopedia describes the second candle as evidence that control changed hands during the day. The CMT Association frames it as a transfer of open-to-close control. In a bullish case, the second candle opens below the prior bearish close, so sellers appear to be in charge at the start. By the close, buyers have pushed the price above the prior bearish open, wiping out the whole of the previous session’s net loss.
Behind every candle sits a continuous auction, and how stock markets set prices through order matching explains why the opening gap and the closing level of a session carry so much information about who held control.
That does not mean every trade reversed direction. It means the net result from open to close swung decisively one way. Schwab is careful here: the candle is evidence of a potential trend change, not a certainty.
This is why a bigger second body is more persuasive. The larger it is, the more ground the other side had to reclaim. Compare the two ends of the spectrum:
- Strong setup: large second body, forming after a clear downtrend or uptrend.
- Weak setup: small second body, forming in a sideways market with no trend to reverse.
Why trend context changes the weight of the signal
A reversal pattern needs something to reverse. Fidelity says these patterns are generally more effective after a sharp decline for bullish setups, or a sharp rally for bearish ones.
Investopedia makes the same point about size: small qualifying candles lack force. So a tiny two-bar pair in a quiet market deserves far less of your weight than one built from substantial candles at the end of a real move.
Three real setups from October 26-27, 2026: Apple, Verizon and American Express
Now test the checklist yourself. Run each pair below through the four conditions before reading the verdict.
| Stock and session | Open | High | Low | Close |
|---|---|---|---|---|
| AAPL, Mon 26 Oct | $343.92 | $347.09 | $341.03 | $343.91 |
| AAPL, Tue 27 Oct | $343.17 | $347.78 | $342.39 | $347.10 |
| VZ, Mon 26 Oct | $43.49 | $43.84 | $42.47 | $43.10 |
| VZ, Tue 27 Oct | $43.00 | $44.06 | $42.91 | $43.93 |
| AXP, Mon 26 Oct | $313.70 | $318.54 | $312.03 | $315.05 |
| AXP, Tue 27 Oct | $317.48 | $317.81 | $312.66 | $312.91 |
Apple: a clean bullish engulfing
Monday was red, if only by a cent: open $343.92, close $343.91. Tuesday was green, opened at $343.17 (below Monday’s close) and finished at $347.10 (above Monday’s open). All four conditions pass.
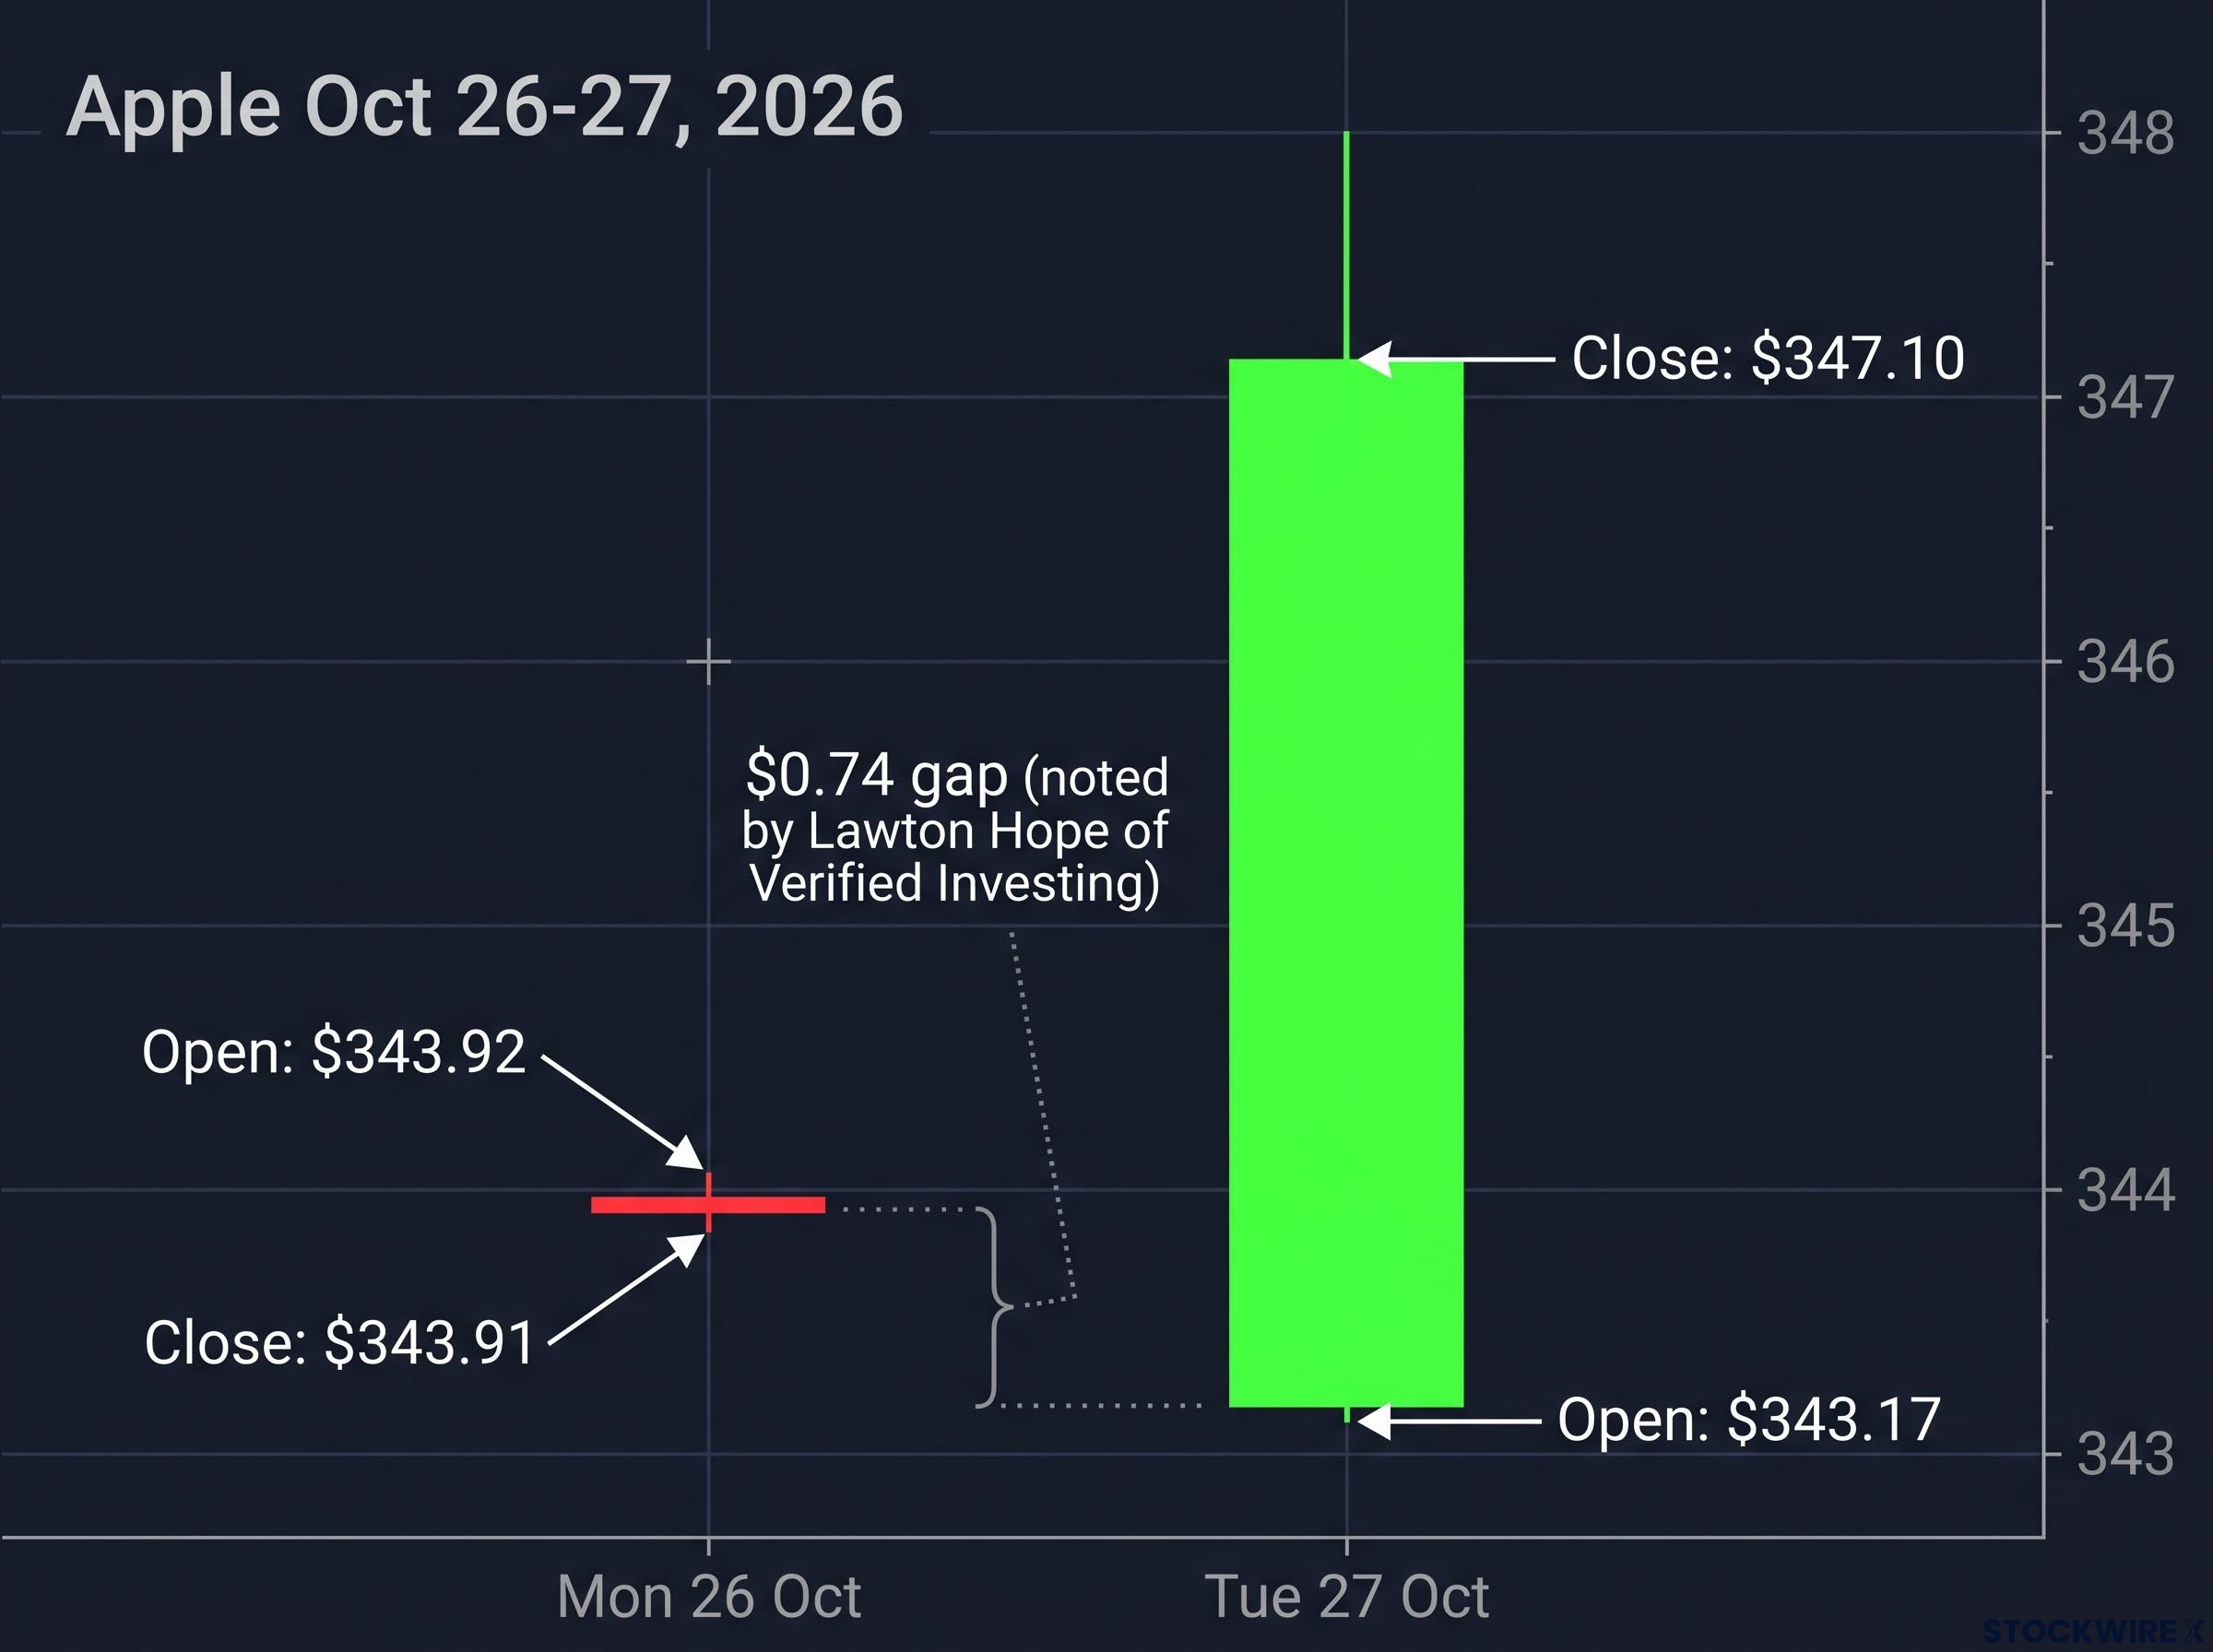
Lawton Hope, Verified Investing Hope pointed out that the candle first looked borderline because it opened only about 75 cents below Monday’s close, yet it still qualified.
That is the lesson of the hook. A small gap is still a gap.
Verizon: valid, but uneven follow-through
Hope presented Verizon as a second bullish example. Monday was red, Tuesday opened at $43.00 below the $43.10 close and finished at $43.93, above the $43.49 open, a 1.93% gain.
The follow-through wobbled. Verizon closed at $43.18 on 28 October, $43.66 on 29 October and $44.73 on 30 October, according to MarketWatch (one source reports $44.98 for that day). Press coverage reportedly tied the Tuesday move to Verizon’s Q3 operating report rather than to any chart pattern, though that link is not fully confirmed. Either way, you should ask whether news, not the candle, drove the move.
American Express: a bearish engulfing that fizzled
Monday was green. Tuesday opened at $317.48, above Monday’s $315.05 close, and closed at $312.91, below the $313.70 open, a decline of about 0.68%. Structurally, it is a valid bearish engulfing.
Then the stock closed at $317.94 on 28 October, higher than Tuesday. No immediate downside followed. Hope also showed an AXP look-alike that failed outright because its preceding candle was red. Some later coverage reportedly described the shares as trading below their 200-day moving average, but that is not fully verified.
The same logic applies to every reversal formation: bearish chart patterns win far more often when strict volume and trend filters are applied, which is why a bearish engulfing candle like American Express’s needs surrounding evidence before it deserves weight.
Three valid structures produced a clean, an uneven and a failed outcome. Passing the checklist earns a setup your attention, not your conviction.
Which look-alikes fail, and which indicators should confirm a signal?
The checklist tells you what to reject. The next step is knowing what to add before you act.
Look-alikes to rule out
| Look-alike | Why it fails |
|---|---|
| Wrong-colour prior candle | A bullish pattern needs a red first candle; a bearish one needs a green first candle. Hope’s AXP look-alike failed this test. |
| Outside day without body engulfment | A higher high and lower low that does not cover the prior body. Fidelity notes outside days use the full range, engulfing patterns use real bodies. |
| Tiny two-bar formation | Technically qualifies but carries little force, according to Investopedia. |
Confirmation signals to add
Work through confirmation in a practical order. Start with the market’s structure, then check participation, then the indicators.
Reading trading volume alongside the candle is the quickest way to test whether a reversal drew broad participation, since an engulfing body on thin turnover tells you far less than the same body on heavy activity.
| Indicator | What to look for | Why it matters |
|---|---|---|
| Trend context | Bullish after a meaningful decline, bearish after a meaningful rally | Fidelity says the pattern is generally more effective here |
| Support and resistance | Bullish near support, bearish near resistance | Gives the reversal a structural reason |
| Volume | Higher than normal on the engulfing candle | Shows broader participation (Investopedia) |
| Next-session follow-through | A further close in the pattern’s direction | Separates a reversal from a one-day reaction |
| RSI | Oversold or bullish divergence (bullish); overbought or bearish divergence (bearish) | Adds momentum context |
| Moving averages | Reclaiming or holding (bullish); rejecting or breaking (bearish) | Distinguishes a reversal from a countertrend bounce |
| MACD | Crossover agreeing with the candle | Independent momentum evidence |
| OBV | Improving for bullish, weakening for bearish | Tests whether volume backs the direction |
The Relative Strength Index (RSI) measures how stretched recent gains or losses are. Moving Average Convergence Divergence (MACD) tracks momentum through two moving averages, and On-Balance Volume (OBV) adds or subtracts each day’s volume depending on whether price rose or fell.
Hope’s advice is that more confirming factors raise the odds of a trade working out. Stack two or three independent confirmations and you are trading a setup with a structural reason to work, not a lone candle.
How reliable are engulfing candles, and where do traders go wrong?
The published numbers are humbling. Results swing from near chance to substantially higher, depending on the market, the time horizon and how each study defines the pattern.
| Source | Result | Caveat |
|---|---|---|
| AJSR study (2025/2026) | 138 bullish observations, 75 correct, 54.35% accuracy | Only modestly above chance |
| Journal of Investment Management (2026 summary) | Bullish buy success 51.35%, bearish sell success 53.23%, bullish confirmation 47.6% in crisis periods | Not independently verified |
| Bulkowski-based practitioner reviews | About 63% bullish upward breakouts, 79% bearish reversals | Not independently verified; a raw statistic is not a strategy |
| CMC Markets | Roughly 55%-70% depending on conditions | Not independently verified |
| SAGE Open (Thailand) | More useful for very short-term forecasts, generally under two days | Not independently verified; market-specific |
The takeaway Engulfing patterns are context-dependent signals, not stand-alone forecasts.
Even valid setups get undone by the same recurring problems:
- False reversals in sideways markets
- Small candles that qualify but lack force
- Earnings, macro announcements or overnight gaps overpowering the pattern
- Entering before the next session confirms
- Survivorship bias, hindsight selection and inconsistent backtest definitions
A hit rate above 50% does not by itself make money. If your losing trades are larger than your winners, a 54% accuracy rate can still leave you behind once costs are counted.
Because the edge is modest, stop placement and position sizing do more work than the candle itself; placing the stop where the pattern fails and sizing from maximum loss keeps a 54% hit rate from becoming a losing account.
The numbers point to a modest, conditional edge at best. That means your position sizing and stop placement matter more than the candle itself.
Turning a valid pattern into a disciplined decision
You now have a sharper test than “bigger candle wins”. Four conditions, judged on real bodies, separate the genuine pattern from look-alikes, and this week’s examples show that passing them is only the start. Apple ran cleanly, Verizon advanced unevenly and American Express rebounded straight through its bearish signal.
Use this sequence on the next engulfing candle you spot on your own watchlist:
- Run the four-condition test. Any failure means a different formation.
- Check trend context. Look for a real move to reverse.
- Require at least two independent confirmations. Volume, support or resistance, and momentum indicators all count.
- Wait for next-session follow-through. Let the market agree with the candle first.
Treat every engulfing pattern as evidence of a possible change in control, not a buy or sell command.
This article is for informational purposes only and should not be considered financial advice. Investors should conduct their own research and consult with financial professionals before making investment decisions.