A high option price does not automatically make an option a good one to sell. In one 20-year study of SPY, the exchange-traded fund that tracks the S&P 500, implied volatility of 13.8 came with an IV rank of just 8, while a reading of 49 carried a rank close to 100. The same word, “volatility”, described two very different markets.
That gap is the reason IV rank exists. A late-October presentation drew on the presenter’s own analysis of two decades of SPY data to track what happens to implied volatility after it spikes. The figures have not been independently verified, so treat them as the study’s reported results rather than settled fact.
Rank is also a relative gauge, and current data shows it. On 30 October 2026, the Cboe Volatility Index (VIX) sat at 19.41, according to Cboe, yet SPY’s one-year IV rank was only 12.5%, according to Unusual Whales.
You will learn how to separate IV from IV rank, what the study found about next-day and five-day volatility, and where the signal stops being useful.
What is the difference between implied volatility and IV rank?
A temperature of 25 degrees feels warm in winter and mild in summer. Volatility numbers work the same way: whether a reading is high depends on what you compare it with.
Implied volatility (IV) is the annualised estimate of how much an asset is expected to move, worked out from current option prices. It measures the size of the expected move, not its direction. An IV of 20% does not mean the price will rise 20%; it signals an expected move of roughly that size, up or down, over a year.
IV rank places today’s IV on a 0-100 scale within its own 52-week high and low. IV percentile asks a different question: on what share of the past year’s trading days was IV lower than today?
How the IV rank formula works
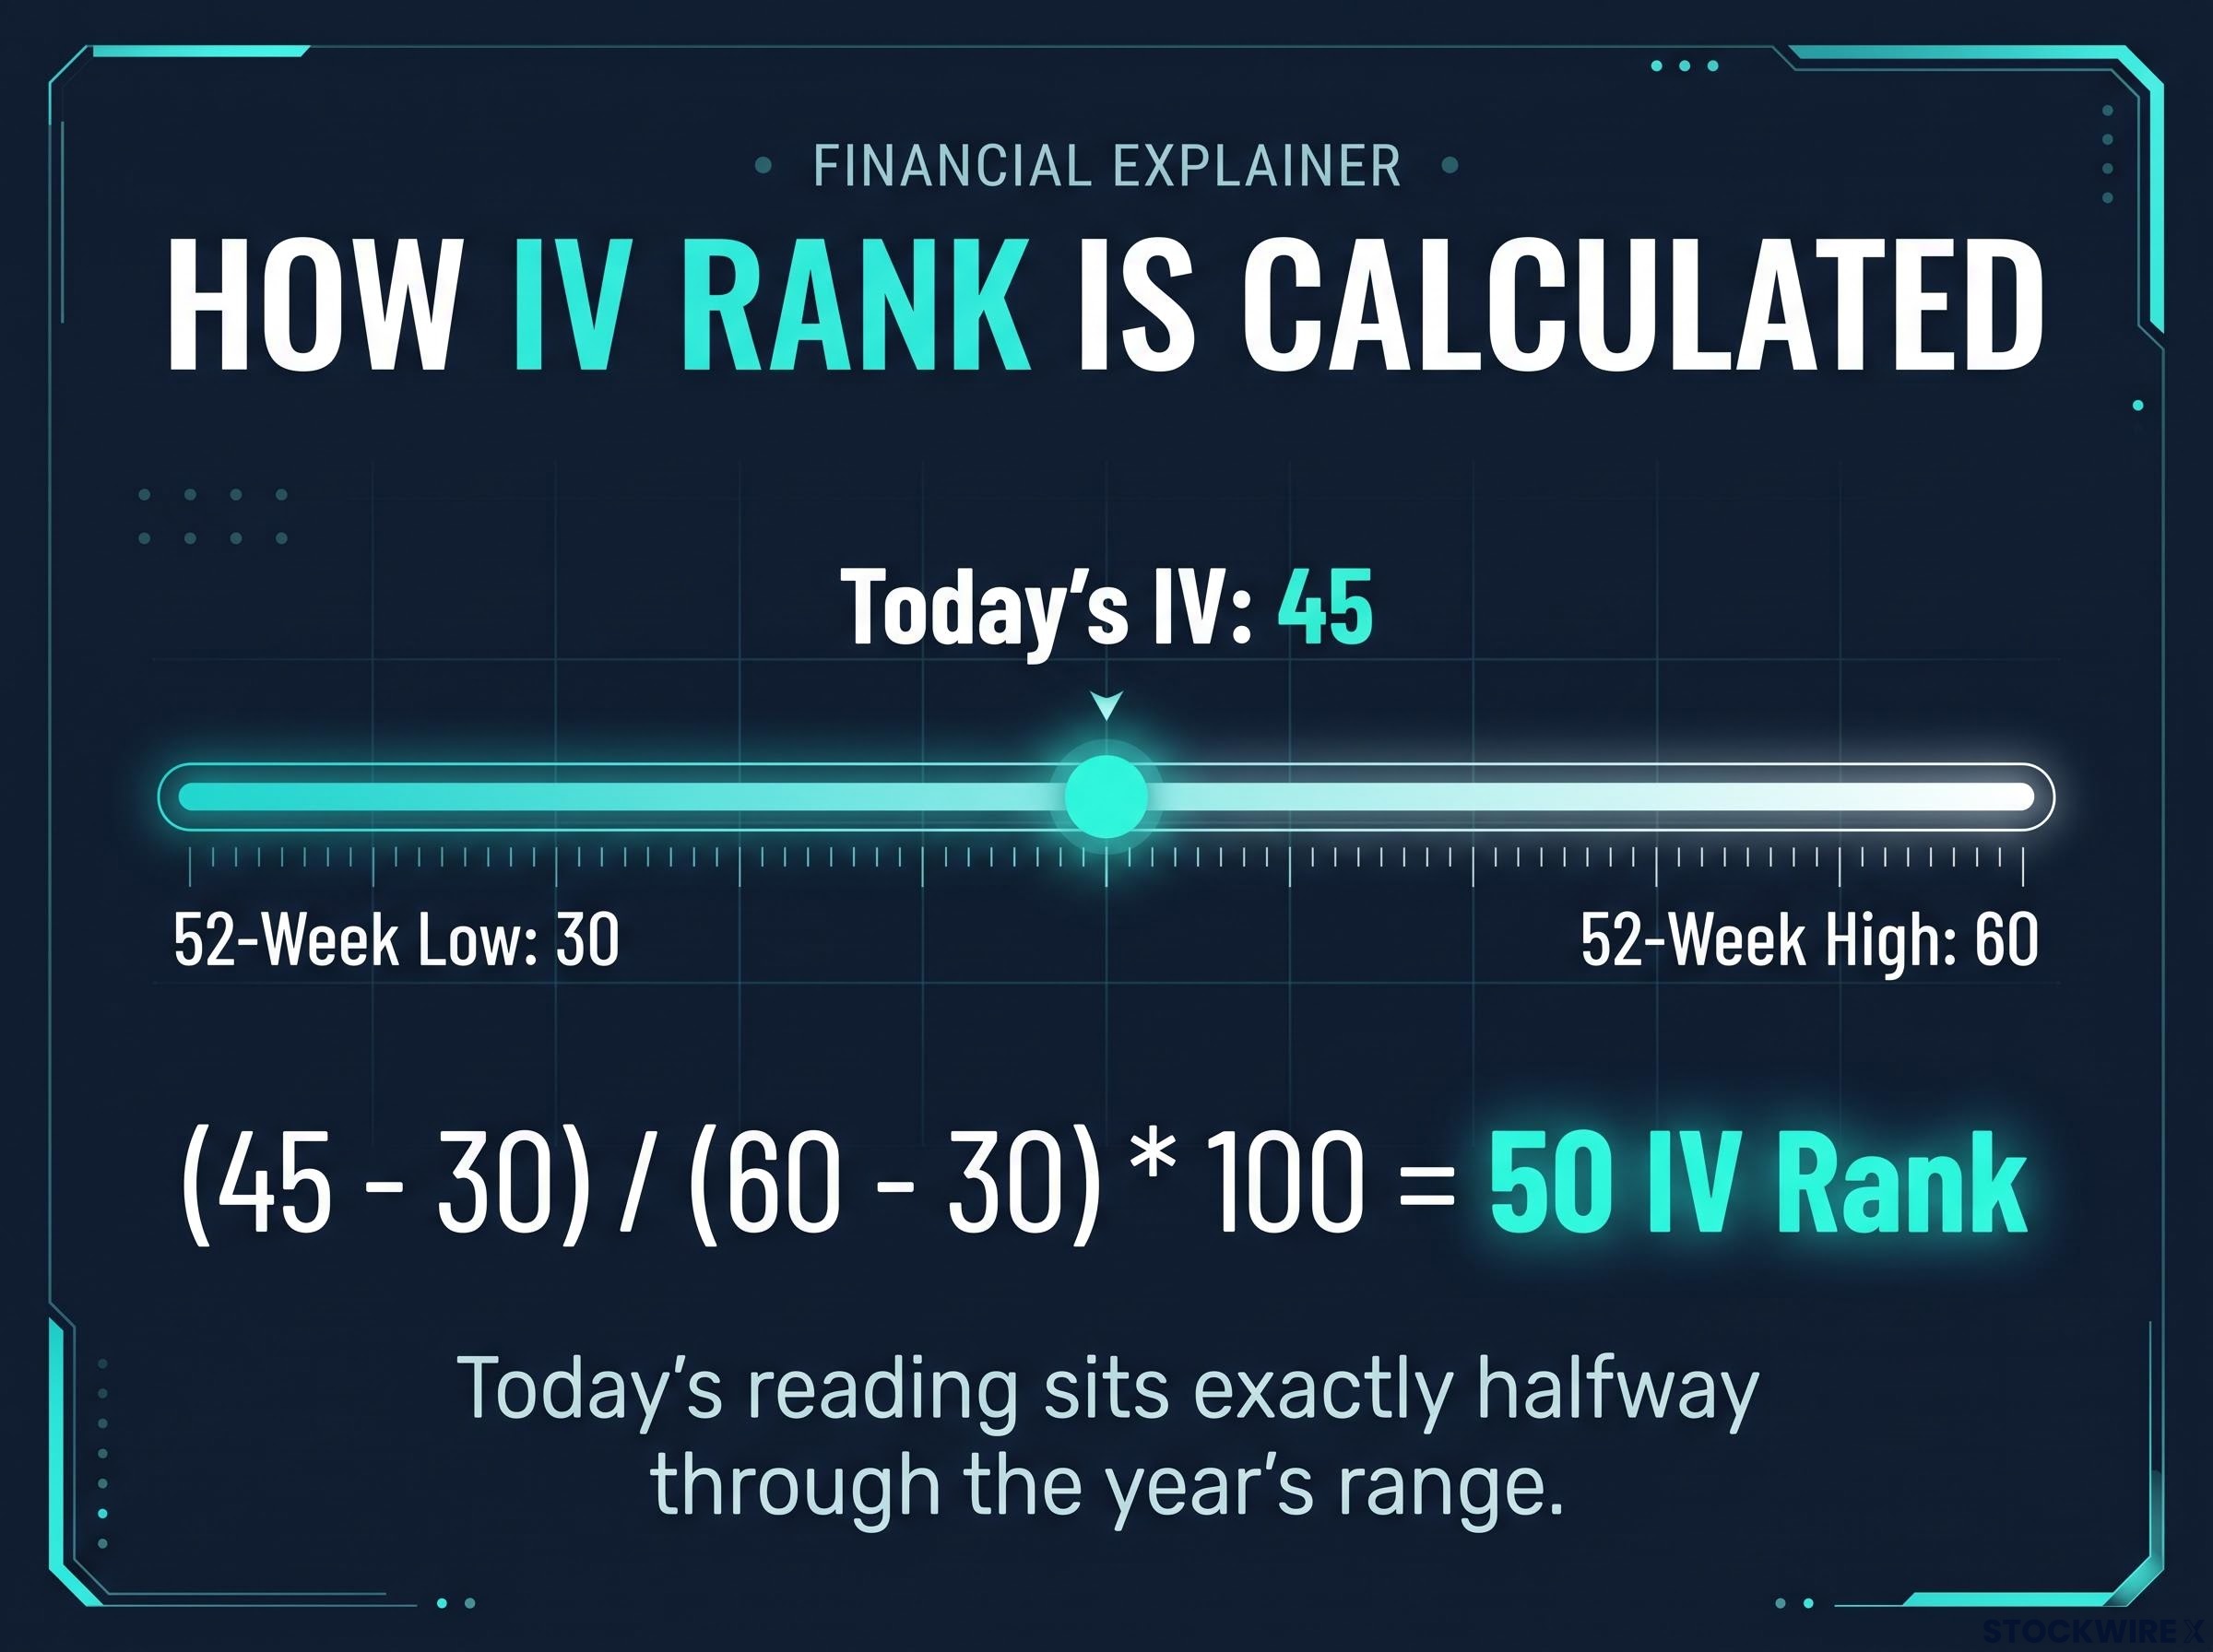
Tastytrade sets the formula out as current IV minus the 52-week low, divided by the 52-week high minus the low, multiplied by 100. If the one-year low is 30, the high is 60 and today’s IV is 45, the rank is 50. Today’s reading sits exactly halfway through the year’s range.
Tastytrade calculates IV percentile as the number of days in the past 52 weeks with lower IV, divided by 252, multiplied by 100.
Why rank and percentile can disagree
Rank uses only three numbers: today, the high and the low. One extreme spike sets the high and squashes every later reading, so rank can look moderate even when today’s IV beats most of the year.
When a single crisis day sets the 52-week high, you will often see IV percentile and rank diverge, with percentile staying high while rank looks moderate. Checking both numbers together gives you a more reliable read on whether premium is truly rich.
Labels add confusion. Schwab‘s thinkorswim platform calls its statistic IV percentile, notes it is sometimes called IV rank, and uses a 252-trading-day window. Check what your broker actually calculates before you act on the number.
| Measure | What it uses | What it tells you | Main weakness |
|---|---|---|---|
| Implied volatility | Current option prices | Expected size of future moves, annualised | No context on whether it is high or low |
| IV rank | Today’s IV, 52-week high and low | Position within the year’s range | One extreme reading can distort it |
| IV percentile | Count of lower-IV days over 252 days | Share of days IV was lower than today | Brokers label it inconsistently |
If you see “IV of 20” without a rank, you cannot tell whether options on that asset are cheap or expensive. The rank is the context that makes the number usable.
When big ASX news breaks, our subscribers know first
What did 20 years of SPY data show about IV fades?
With the definitions in place, the study’s numbers become readable. All figures below come from the presenter’s own analysis and were not confirmed by independent sources.
Next-day fades
At low IV rank, SPY’s implied volatility fell the next day about 49% of the time, close to a coin toss. In the 20-50 band, that rose to about 58%. Above 50, where fear is elevated, it reached about 63%.
The pattern climbs with every bucket. The more stretched volatility was relative to its year, the more often it eased the following day.
Five-day medians and the volatility scan
Over five days, the gap widens. At the lowest rank, the median IV change was about +3.5%, meaning quiet markets tended to get slightly less quiet. At the highest rank, the median change was about -6.1% to -6.3%.
| IV rank bucket | Next-day IV fell | Five-day median IV change |
|---|---|---|
| Low | About 49% | About +3.5% (lowest rank) |
| 20-50 | About 58% | Not separately reported |
| Above 50 | About 63% | About -6.1% to -6.3% (highest rank) |
The study also tested a scan. After a 10% one-day jump in IV, there was roughly a 65% chance IV would fall over the next five days. Combining the jump with an IV rank around 30 lifted that to about 67%.
Price told a weaker story. SPY rose only about 56% of the time in the five days after spikes.
Key finding IV fades more consistently than SPY rebounds.
These odds tilt towards fading, but they are far from certain. Treat roughly 63-67% as a screening edge across many trades, not a promise on any single one.
Why do price and volume add so little while IV rank adds more?
The study held a puzzle. On the same day, SPY and IV moved together tightly, with a correlation of about 72%, and IV rose on about 94% of days when SPY fell 1%. The next day, that link almost disappeared.
Several forces drive the same-day connection:
- Hedging demand: investors buy put options, which pay off if prices fall, when downside risk feels close.
- Dealer hedging: dealers buy or sell futures and stock as prices move, reinforcing short-term swings.
- Deleveraging: Reuters reported that high volatility can trigger selling by volatility-control, risk-parity and trend-following strategies.
Why the same-day link vanishes
The next-day correlation between price move and IV change was about 0.06, close to zero. Price level explained only about 1% of the next IV move.
IV looks forward, not back. By the time the day closes, the shock may already be priced into options and hedges may be in place. Yesterday’s price move says almost nothing about tomorrow’s IV change, so for this decision you are better off watching the volatility metrics rather than the price chart.
Volume and IV rank were the most closely related variables, though their correlation stayed under 0.5. That is why the study treats them as screening inputs while dismissing price level.
Mean reversion and the risk premium
Cboe explains that volatility mean reverts, meaning it tends to drift back towards a longer-term average, because it cannot rise forever or sit at zero. It also clusters in regimes: long quiet stretches broken by short, intense bursts.
The volatility risk premium is the gap between implied volatility and the volatility that actually follows. Cboe found it positive in 336 of 387 observations (86.8%), and a separate Cboe guide found the trailing VIX average exceeded following realised volatility by roughly 4-5 percentage points.
That premium is compensation. Option buyers pay for protection, and sellers collect for accepting crash, gap and liquidity risk, so it is not free yield.
The positive premium is persistent: SPY implied volatility has exceeded realised volatility in most periods over the past decade, though the minority of periods that reverse tend to cluster in sharp regime shifts.
Why is a high IV rank a screen and not an automatic entry?
The statistics look encouraging. History shows why they are only a starting point.
A six-step screening workflow
- Screen for high rank. Look for underlyings with relatively high IV rank or percentile.
- Check the catalyst. Identify the cause: earnings, an economic release, litigation or a broad-market shock.
- Compare IV with realised volatility. Judge whether options are priced above the movement actually occurring.
- Prefer defined risk. Spreads cap losses where naked short options do not.
- Size for a bigger move. Allow for an adverse move substantially larger than the implied one.
- Manage the position. Monitor and adjust rather than assuming high IV means “sell”.
When the fade does not arrive
On 5 August 2024, the VIX jumped from about 23.9 to a pre-market high of 65.73 before closing at 38.57. Research from the Bank for International Settlements (BIS) found widened put quotes materially amplified the reading. Reuters reported investors in ten large short-volatility funds lost about $4.1 billion of gains built up earlier that year.
On 5 February 2018, known as “Volmageddon”, the VIX rose from 17.31 to 37.32. The inverse volatility product XIV reportedly lost about 96%.
| Risk | Example | Lesson |
|---|---|---|
| Volatility clustering | August 2024 | Reversion is a tendency, not a timetable |
| Forced unwinding | February 2018, XIV down about 96% | Short volatility can collapse in one session |
| Lookback distortion | One crisis sets the 52-week high | Rank depends on the window chosen |
| No direction | High rank in rallies or selloffs | Rank says options are rich, not where price goes |
The most dangerous stretch can begin after the first spike, as new headlines and deleveraging push volatility higher before it reverts. Longer horizons look different: Cboe found the S&P 500 returned about 23% on average over the following year after VIX closed above 30 (1990-2021), a separate measure from the study’s 56% five-day figure. Past performance does not guarantee future results.
The bottom line High IV rank can identify relatively rich option premiums, but it is a screening condition, not an automatic entry signal.
A high reading tells you premium is rich, not that the catalyst is over. Position size and defined risk matter more than the signal.
For readers building a full screen, our comprehensive walkthrough of premium selling signals covers the multi-indicator convergence test beyond IV rank alone.
What to carry forward before the next volatility spike
IV rank gives a raw volatility number the context it lacks. The study points to a tilt towards fading after spikes, strongest at high ranks, while price level adds almost nothing to the forecast. Remember these are the presenter’s own figures, not independently verified.
Your framework is short: check the rank, check volume, look for a one-day IV jump, then size for a move larger than options imply. Defined risk keeps a wrong call survivable.
Right now, the screen is quiet for the index. With SPY’s IV rank at 12.5% on 30 October 2026, premium is not rich relative to the past year, and the study’s fade odds sit near their weakest.
A low IV rank can veto a short premium trade even when a thesis looks sound, because thin credits fail to pay you for the tail risk you carry.
This article is for informational purposes only and should not be considered financial advice. Investors should conduct their own research and consult with financial professionals before making investment decisions.